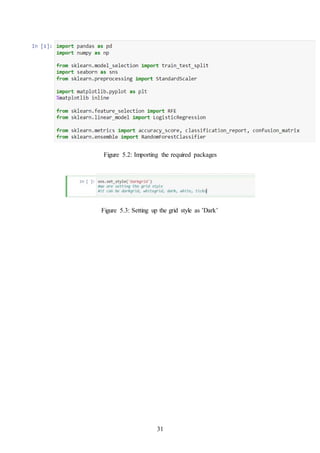
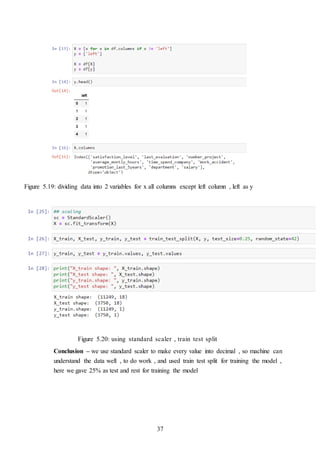
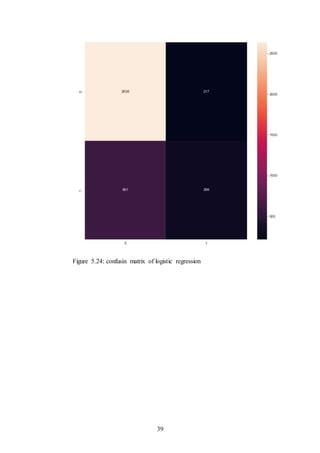
This document discusses using machine learning algorithms to predict employee attrition and understand factors that influence turnover. It evaluates different machine learning models on an employee turnover dataset to classify employees who are at risk of leaving. Logistic regression and random forest classifiers are applied and achieve accuracy rates of 78% and 98% respectively. The document also discusses preprocessing techniques and visualizing insights from the models to better understand employee turnover.
Python is the choice llanguage for data analysis,
The aim of this slide is to provide a comprehensive learning path to people new to python for data analysis. This path provides a comprehensive overview of the steps you need to learn to use Python for data analysis.
Python for Data Science: A Comprehensive Guidepriyanka rajput
Python’s popularity in data science is undeniable, to sum up. It is the best option for data analysts and scientists because of its simplicity, extensive library environment, and community support. The essential Python tools and best practices have been highlighted in this thorough book, enabling data aficionados to succeed in this fast-paced industry.
Data Science With Python | Python For Data Science | Python Data Science Cour...Simplilearn
This Data Science with Python presentation will help you understand what is Data Science, basics of Python for data analysis, why learn Python, how to install Python, Python libraries for data analysis, exploratory analysis using Pandas, introduction to series and dataframe, loan prediction problem, data wrangling using Pandas, building a predictive model using Scikit-Learn and implementing logistic regression model using Python. The aim of this video is to provide a comprehensive knowledge to beginners who are new to Python for data analysis. This video provides a comprehensive overview of basic concepts that you need to learn to use Python for data analysis. Now, let us understand how Python is used in Data Science for data analysis.
This Data Science with Python presentation will cover the following topics:
1. What is Data Science?
2. Basics of Python for data analysis
- Why learn Python?
- How to install Python?
3. Python libraries for data analysis
4. Exploratory analysis using Pandas
- Introduction to series and dataframe
- Loan prediction problem
5. Data wrangling using Pandas
6. Building a predictive model using Scikit-learn
- Logistic regression
This Data Science with Python course will establish your mastery of data science and analytics techniques using Python. With this Python for Data Science Course, you'll learn the essential concepts of Python programming and become an expert in data analytics, machine learning, data visualization, web scraping and natural language processing. Python is a required skill for many data science positions, so jumpstart your career with this interactive, hands-on course.
Why learn Data Science?
Data Scientists are being deployed in all kinds of industries, creating a huge demand for skilled professionals. Data scientist is the pinnacle rank in an analytics organization. Glassdoor has ranked data scientist first in the 25 Best Jobs for 2016, and good data scientists are scarce and in great demand. As a data you will be required to understand the business problem, design the analysis, collect and format the required data, apply algorithms or techniques using the correct tools, and finally make recommendations backed by data.
You can gain in-depth knowledge of Data Science by taking our Data Science with python certification training course. With Simplilearn Data Science certification training course, you will prepare for a career as a Data Scientist as you master all the concepts and techniques.
Learn more at: https://www.simplilearn.com
Introduction to Data Science, Prerequisites (tidyverse), Import Data (readr), Data Tyding (tidyr),
pivot_longer(), pivot_wider(), separate(), unite(), Data Transformation (dplyr - Grammar of Manipulation): arrange(), filter(),
select(), mutate(), summarise()m
Data Visualization (ggplot - Grammar of Graphics): Column Chart, Stacked Column Graph, Bar Graph, Line Graph, Dual Axis Chart, Area Chart, Pie Chart, Heat Map, Scatter Chart, Bubble Chart
Machine learning with Python refers to the process of using the Python programming language and its associated libraries and tools to develop and apply machine learning algorithms. Python has become the de facto language for machine learning due to its simplicity, readability, and extensive ecosystem of libraries such as NumPy, Pandas, and Scikit-learn.
Machine learning involves the study and development of algorithms that enable computers to learn from data and make predictions or decisions without explicit programming instructions. Python provides a versatile and intuitive platform for implementing various machine learning techniques, including supervised learning, unsupervised learning, and reinforcement learning.
VISIT TO LEARN MORE: https://skillup.online/courses/machine-learning-with-python-a-practical-introduction/
To succeed as a data scientist, you should follow a structured path known as the “Data Science Roadmap.” This path outlines foundational knowledge in math and programming. Data manipulation and visualization, exploratory data analysis. Machine learning, deep learning, and advanced topics such as natural language processing and time series analysis. Following this roadmap can help you acquire the skills and knowledge needed to excel in this rapidly growing field.
Becoming a successful data scientist requires a unique combination of technical skills, business acumen, and critical thinking ability. To achieve your career goals in this field, you need a structured plan or a data science roadmap that outlines the skills, tools, and knowledge required to succeed. In this blog, we’ll take a closer look at what a data science roadmap is, why it’s important, and how to create one that works for you.
At its core, It is a structured plan that outlines the skills, tools, and knowledge required to become a successful data scientist. It serves as a guidepost to help individuals navigate the complex landscape of data science and provides a clear path towards achieving their career objectives.
Crossing the Analytics Chasm and Getting the Models You Developed DeployedRobert Grossman
There are two cultures in data science and analytics - those that develop analytic models and those that deploy analytic models into operational systems. In this talk, we review the life cycle of analytic models and provide an overview of some of the approaches that have been developed for managing analytic models and workflows and for deploying them, including using analytic engines and analytic containers . We give a quick overview of languages for analytic models (PMML) and analytic workflows (PFA). We also describe the emerging discipline of AnalyticOps that has borrowed some of the techniques of DevOps.
International Journal of Engineering Research and Development (IJERD)IJERD Editor
journal publishing, how to publish research paper, Call For research paper, international journal, publishing a paper, IJERD, journal of science and technology, how to get a research paper published, publishing a paper, publishing of journal, publishing of research paper, reserach and review articles, IJERD Journal, How to publish your research paper, publish research paper, open access engineering journal, Engineering journal, Mathemetics journal, Physics journal, Chemistry journal, Computer Engineering, Computer Science journal, how to submit your paper, peer reviw journal, indexed journal, reserach and review articles, engineering journal, www.ijerd.com, research journals,
yahoo journals, bing journals, International Journal of Engineering Research and Development, google journals, hard copy of journal
Understanding the benefits data classes will allow for cleaner code that's easier to maintain.Python Course in Bangalore.Join the Best Python Course Training in Bangalore. Enroll in Nearlearn now. Get trained by industry experts and become a certified Python developer.
Similar to employee turnover prediction document.docx (20)
Adjusting primitives for graph : SHORT REPORT / NOTESSubhajit Sahu
Graph algorithms, like PageRank Compressed Sparse Row (CSR) is an adjacency-list based graph representation that is
Multiply with different modes (map)
1. Performance of sequential execution based vs OpenMP based vector multiply.
2. Comparing various launch configs for CUDA based vector multiply.
Sum with different storage types (reduce)
1. Performance of vector element sum using float vs bfloat16 as the storage type.
Sum with different modes (reduce)
1. Performance of sequential execution based vs OpenMP based vector element sum.
2. Performance of memcpy vs in-place based CUDA based vector element sum.
3. Comparing various launch configs for CUDA based vector element sum (memcpy).
4. Comparing various launch configs for CUDA based vector element sum (in-place).
Sum with in-place strategies of CUDA mode (reduce)
1. Comparing various launch configs for CUDA based vector element sum (in-place).
06-04-2024 - NYC Tech Week - Discussion on Vector Databases, Unstructured Data and AI
Discussion on Vector Databases, Unstructured Data and AI
https://www.meetup.com/unstructured-data-meetup-new-york/
This meetup is for people working in unstructured data. Speakers will come present about related topics such as vector databases, LLMs, and managing data at scale. The intended audience of this group includes roles like machine learning engineers, data scientists, data engineers, software engineers, and PMs.This meetup was formerly Milvus Meetup, and is sponsored by Zilliz maintainers of Milvus.
Show drafts
volume_up
Empowering the Data Analytics Ecosystem: A Laser Focus on Value
The data analytics ecosystem thrives when every component functions at its peak, unlocking the true potential of data. Here's a laser focus on key areas for an empowered ecosystem:
1. Democratize Access, Not Data:
Granular Access Controls: Provide users with self-service tools tailored to their specific needs, preventing data overload and misuse.
Data Catalogs: Implement robust data catalogs for easy discovery and understanding of available data sources.
2. Foster Collaboration with Clear Roles:
Data Mesh Architecture: Break down data silos by creating a distributed data ownership model with clear ownership and responsibilities.
Collaborative Workspaces: Utilize interactive platforms where data scientists, analysts, and domain experts can work seamlessly together.
3. Leverage Advanced Analytics Strategically:
AI-powered Automation: Automate repetitive tasks like data cleaning and feature engineering, freeing up data talent for higher-level analysis.
Right-Tool Selection: Strategically choose the most effective advanced analytics techniques (e.g., AI, ML) based on specific business problems.
4. Prioritize Data Quality with Automation:
Automated Data Validation: Implement automated data quality checks to identify and rectify errors at the source, minimizing downstream issues.
Data Lineage Tracking: Track the flow of data throughout the ecosystem, ensuring transparency and facilitating root cause analysis for errors.
5. Cultivate a Data-Driven Mindset:
Metrics-Driven Performance Management: Align KPIs and performance metrics with data-driven insights to ensure actionable decision making.
Data Storytelling Workshops: Equip stakeholders with the skills to translate complex data findings into compelling narratives that drive action.
Benefits of a Precise Ecosystem:
Sharpened Focus: Precise access and clear roles ensure everyone works with the most relevant data, maximizing efficiency.
Actionable Insights: Strategic analytics and automated quality checks lead to more reliable and actionable data insights.
Continuous Improvement: Data-driven performance management fosters a culture of learning and continuous improvement.
Sustainable Growth: Empowered by data, organizations can make informed decisions to drive sustainable growth and innovation.
By focusing on these precise actions, organizations can create an empowered data analytics ecosystem that delivers real value by driving data-driven decisions and maximizing the return on their data investment.
Chatty Kathy - UNC Bootcamp Final Project Presentation - Final Version - 5.23...John Andrews
SlideShare Description for "Chatty Kathy - UNC Bootcamp Final Project Presentation"
Title: Chatty Kathy: Enhancing Physical Activity Among Older Adults
Description:
Discover how Chatty Kathy, an innovative project developed at the UNC Bootcamp, aims to tackle the challenge of low physical activity among older adults. Our AI-driven solution uses peer interaction to boost and sustain exercise levels, significantly improving health outcomes. This presentation covers our problem statement, the rationale behind Chatty Kathy, synthetic data and persona creation, model performance metrics, a visual demonstration of the project, and potential future developments. Join us for an insightful Q&A session to explore the potential of this groundbreaking project.
Project Team: Jay Requarth, Jana Avery, John Andrews, Dr. Dick Davis II, Nee Buntoum, Nam Yeongjin & Mat Nicholas
1. 1
Abstract
Employee Attrition can likewise be named Employee Turnover. The prediction and interpretation of employee
turnover using machine learning and relates those findings to a cost reduction., different employee turnover costing
frameworks, machine learning methods, and feature importances are evaluated. Based on these findings, insights
into a current turnover. Furthermore, the history of employee turnover data is used to train and optimize six state-
of-the-art machine learning models, which classify employees who are at risk of leaving. Ultimately, an optimal
version of the best-performing model is best-performing insights here by using the machine learning models and
some preprocessing techniques are building model on employee turnover prediction and also to understand the
insights with some visualization on technique, This document gives a definite perspective on foreseeing the
representative turnover utilizing the Machine Learning algorithms. We utilized the Logistic Regression for the
expectation and we got a nearly 78% we also used a random forest classifier which gives us a 98% exactness rate.
Keywords: Employee Defection, Logistic Regression, Machine Learning algorithm, Programming Industry.
Contents
3. 3
Chapter 1
Data Science Introduction
1.1 Data Science
Data science is the field of data analytics and data visualization in which raw data or the un-
structured data is cleaned and made ready for the anlysis purpose. Data scientists use this data
to get the required information for the future purpose.[1] ”Data science uses many processes
and methods on the big data, the data may be structured or unstructured”. Data frames avail-
able on the internet is the raw data we get. It may be either in unstructured or semi structured
format.This data is further filtered, cleaned and then number of required task are performed for
the analysis with the use of the high programming language. This data is further analyzed and
then presented for our better understanding and evaluation.
One must be clear that data science is not about making complicated models or making awe-
some visualization neither it is about writing code but about using the data to create an impact
for your company, for this impact we need tools like complicated data models and data visual-
ization.
1.2 Stages of Data Science
There are many tools used to handle the big data available to us. [2] ”Data scientists use pro-
gramming tools such as Python, R, SAS, Java, Perl, and C/C++ to extract knowledge from
prepared data”.
Data scientists use many algorithms and mathematical models on the data.
Following are the stages and their cycle performed on the unstructured data.[3]
• Identifying the problem.
• Identify available data sources
4. 4
• Identify available data sources
• Identify if additional data sources are needed.
• Statistical analysis
• Implementation, development
• Communicate results
• Maintenance
Figure 1.1: 7 steps that together constitute this life-cycle model of Data science[3]
Data science finds its application in many fields. With the assistance of data science it is
easy to get the search query on search engines in plenty of time. A role of the data scientist is
to have a deep understanding of the data as well as a good command on the programming lan-
guage, he should also know how to work with the raw data extracted from the data source. Many
programming languages are used to analyze and evaluate the data such as Python, Java, MAT-
LAB, Scala, Julia, R., SQLand TensorFlow. Among which python is the most user friendly and
vastly used programming language in the field of data science.
This life cycle is applied in each and every field, in this project we will be considering all this
seven stages of data science to analyze the data. The process will be starting from data collec-
tion, data preparation, data modeling and finally data evaluation. For instance, As we have huge
5. 5
amount of data we can create an energy model for a particular country by collecting its previous
energy data, we can also predict the future requirement of it with the same data.
6. 6
Chapter 2
Python Programming language basics
2.1 Why only Python?
”Python is an interpreted, object-oriented, high-level programming language with dynamic
semantics”.[6] This language consist of mainly data structures which make it very easy for
the data scientists to analyse the data very effectively. It does not only help in forecasting
and analysis it also helps in connecting the two different languages.Two best features of this
programming language is that it does not have any compilation step as compared to the other
programming language in which compilation is done before the program is being executed and
other one is the reuse of the code, it consist of modules and packages due to which we can use
the previously written code any where in between the program whenever is required.
There are multiple languages for example R., Java, SQL, Julia, Scala, MATLAB available in
market which can be used to analyze and evaluate the data, but due to some outstanding features
python is the most famous language used in the field of data science.
Python is mostly used and easy among all other programming languages is due to the following
reasons.
7. 7
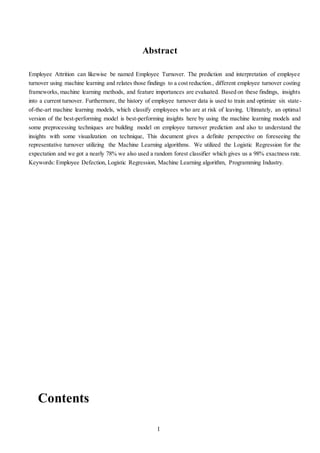
2.2 Data structuresin Python
Data structures are the way of storing the data so that we can easily perform different operations
on the data whenever its required. When the data has been collected from the data source the
data is available in different forms. So later it is easy for the data scientists to perform different
operation on the data once it is sorted in to different data structures.
Data structures are mainly classified in to two categories and then further their subcategories
shown below.
1. Primitive Data Structures.
They are also called as basic data structures.This type of data structures contains simple values
of the data.[7]
• Integers - All the whole numbers from negative infinity to positive infinity comes under
integer data types. for example 4,9,-2,-6.
• Float - The decimal figure numbers or rational numbers comes under float data types. for
example 3.1,2.2,8.96
• Strings - Collection of alphabets or characters are called strings. We enclose the string
either in single or double quotes in python. for example ’hello’ and ”bread”.
• Boolean- These are the built in data types which take two values that are ’True’ and
’False’. True represents the 1 and False represents 0 in python.
2. Non-Primitive Data Structures
These are the derived type or reference variables data structures. They are called derived data
structures because they derived from the basic data structures such as integer and float. Python
has mainly five types of data structures.
Following are the non primitive data structures.
Array - Array is the collection of data types of same type. Arrays data structures are used
mostly in the NumPy library of python. In the below example we have first imported the pack-
age array from numpy library and defined the array as variable arr then divided the array by 7
and we have printed our array to get output.
8. 8
Figure 2.1: Array example
List - ”A list is a value that contains multiple values in an ordered sequence”.[8]. Values in the
list referred to list itself, that is the value can be stored in a variable or passed to a function. List
are changeable and values in the list are enclosed inside a square bracket, we can perform
multiple operations such as indexing, slicing, adding and multiplying.
Figure 2.2: list example
Tuple - A tuple is a list of non changeable objects. The differences between tuples and lists are
that the tuples cannot be changed, tuples use parentheses, whereas list uses square brackets.
9. 9
Figure 2.3: tuple example
Dictionary- These are nothing but a type of data structure which consist of key value pairs
enclosed in the curly brackets. It is same as the any dictionary we use in day to day life in which
we find the meaning of the particular words. So if I compare normal dictionary to this python
dictionary data structure then the a word in a dictionary will be our key and its meaning will be
the value of the dictionary. In the figure name, occupation and hobby are the keys and Suraj,
data analyst and vlogging are the values assigned to the keys.
Figure 2.4: dictionary example
Sets - Set are used for calculating mathematical operation such as union, intersection and sym-
metric difference.
10. 10
Below is the data structure tree which explains the category and sub-category of each
data types.
Figure 2.5: A data structure tree at glance
[7]
11. 11
2.3 Operators
OPERATORS - Operators are the symbols in python that are used to perform Arithmetic or
logical operations. Following are the different types of operators in python.
Arithmetic operators - Arithmetic operators carry out mathematical operations and they are
mostly used with the numeric values.
Arithmetic operators
Operator Name Example
+ Addition A+B
- Subtraction A-B
* Multiplication A*B
/ Division A/B
% Modulus A%B
** Exponentiation A**B
// Quotient A//B
Table 2.1: Arithmetic operators
A and B are the numeric values.
12. 12
Assignment operators - As the name decides this operators are used for assigning the values
to the variables.
ASSIGNMENT OPERATORS
Operator Example may also be writ-
ten
= a = 6 a = 6
+= a += 3 a = a + 3
-= a -= 4 a = a - 4
*= a *= 5 a = a * 5
/= a /= 6 a = a / 6
%= a %= 7 a = a % 7
//= a //= 8 a = a // 8
**= a **= 9 a = a ** 9
&= a &= 1 a = a & 1
Table 2.2: Assignment Operators
Here a is any value and number of operations are performed on this value.
13. 13
Logical operators - These operators are used to join conditional statements
Logical Operators
Operator Description Example
and if both statements are true it x <5 and x
<10
x <4 or x
<8
not (x <4
and x <8)
returns true
or if any of the two statement is
true it returns true
not if the result is true it reverses
the result and gives false
Table 2.3: Logical Operators
Here a is any value provided by us and on which multiple operations can be performed.
Comparison operators - These operators are used to compare two different values.
Comparison operators
Operator Name Example
== Equal a == b
!= Not equal a!=b
> Greater than a >b
< less than a <b
>= Greater than a>= b
equal to
<= less than equal to a <=b
Table 2.4: Comparison operators
Here a and b are two different values and these values are compared.
14. 14
Membership operators - These operators are used to check membership of a particular value.It
is used to check whether a specific value is present in the object or not.
Membership operators
Operator Description Example
in
not in
it returns a True if the value is
present inside the object
it returns a True if the value is
not present inside the object
a in b
a not in b
Table 2.5: Membership operators
15. 15
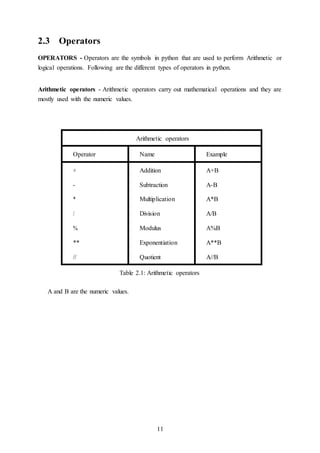
2.4 Condition statements
2.4.1 If else statements
”The most common type of statement is the if statement. if statement consist of a block which
is called as clause”,[8] it is the block after if statement, it executed the statement if the condition
is true. The statement is omitted if the condition is False. then the statement in the else part is
printed
If statement consist of following -
• If keyword itself
• Condition which may be True or False
• Colon
• If clause or a block of code
Below is the figure shows how If and else statements are used with description inside it.
Figure 2.6: if else statement
16. 16
2.4.2 elif statements
In this statement only one statement is executed, There are many cases in which there is only
one possibility to execute. ”The elif statement is an else if statement that always follows an if or
another elif statement”[8]. The elif statement provides another condition that is checked only
if any of the previous conditions were False. In code, an elif statement always consists of the
following:. The only difference between if else and elif statement is that in elif statement we
have the condition where as in else statement we do not have any condition.
elIf statement consist of following -
• elIf keyword itself
• Condition which may be True or False
• Colon
• elIf clause or a block of code
Below is the figure shows how elIf statement is used with description inside it.
18. 18
2.5 Loops in python
2.5.1 For loop
When do we use for loops ?
for loops are traditionally used when you have a block of code which you want to repeat a fixed
number of times. The Python for statement iterates over the members of a sequence in order,
executing the block each time.[9]
Range statement - This statement ’range()’ is used with for loop statements where you can
specify one value. For example, if you specify 10, the loop statement starts from 1 and ends
with 9, which is n-1. Also, you can specify the start and end values. The following examples
demonstrate loop statements.
Figure 2.8: for example with range statement
19. 19
2.5.2 While loop
While loops are used for repeating the section of code but not same as for loop, the while loop
does not run n times, but until a defined condition is no longer met. If the condition is initially
false, the loop body will not be executed at all.
Figure 2.9: While loop example
20. 20
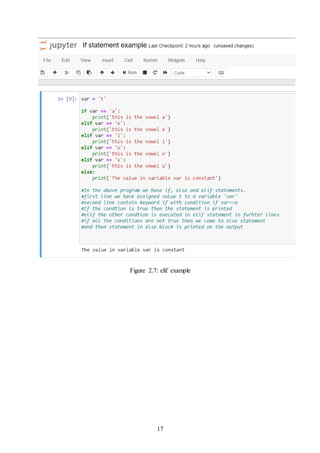
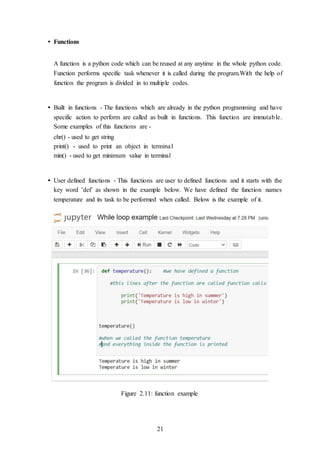
2.6 Module, Package and Functions
• Module
Modules are Python files which has extension as .py. The name of the module will be the
name of the file. A Python module can have a set of functions, classes or variables defined
and implemented.
Module has some python codes, this codes can define the classes, functions and vari-
ables.The reason behind using the module is that it organizes your python code by group-
ing the python code so that it is easier to use.
• Package
A package consist of the collection of modules in which python codes are written with
name init.py. It means that each python code inside of the python path, which contains a
file named init.py, will be treated as a package by Python. Packages are used for organiz-
ing the module by using dotted names.
for example -
We have a package named simple package which consist of two modules a and b. We will
import the module from package in following way.
from simple package import a, b
Figure 2.10: packages example [10]
21. 21
• Functions
A function is a python code which can be reused at any anytime in the whole python code.
Function performs specific task whenever it is called during the program.With the help of
function the program is divided in to multiple codes.
• Built in functions - The functions which are already in the python programming and have
specific action to perform are called as built in functions. This function are immutable.
Some examples of this functions are -
chr() - used to get string
print() - used to print an object in terminal
min() - used to get minimum value in terminal
• User defined functions - This functions are user to defined functions and it starts with the
key word ’def’ as shown in the example below. We have defined the function names
temperature and its task to be performed when called. Below is the example of it.
Figure 2.11: function example
22. 22
Chapter 3
Libraries in Python
Python library is vast. There are built in functions in the library which are written in C lan-
guage. This library provide access to system functionality such as file input output and that is
not accessible to Python programmers. This modules and library provide solution to the many
problems in programming.
Following are some Python libraries.
Matplotlib
Pandas
TensorFlow
Numpy
Keras
PyTorch
LightGBM
Eli5
SciPy
23. 23
3.1 Matplotlib
”Matplotlib is a plotting library for the Python programming language and its numerical math-
ematics extension NumPy”[11]. Matlab provides an application that is used in graphical user
interface tool kits. Another such libraby is pylab which is almost same as MATLAB.
It is a library for 2D graphics, it finds its application in web application servers, graphical user
interface toolkit and shell.Below is the example of a basic plot in python.
Figure 3.1: Matplotlib basic example
24. 24
3.2 Pandas
Pandas is also a library or a data analysis tool in python which is written in python program-
ming language. It is mostly used for data analysis and data manipulation. It is also used for data
structures and time series.
We can see the application of python in many fields such as - Economics, Recommendation Sys-
tems - Spotify, Netflix and Amazon, Stock Prediction, Neuro science, Statistics, Advertising,
Analytics, Natural Language Processing. Data can be analyzed in pandas in two ways -
Data frames - In this data is two dimensional and consist of multiple series. Data is always
represented in rectangular table.
Series - In this data is one dimensional and consist of single list with index.
26. 26
3.3 NumPy
”NumPy is a library for the Python programming language, adding support for large, multi-
dimensional arrays and matrices, along with a large collection of high-level mathematical func-
tions to operate on these arrays”. The previous similar programming of NumPy is Numeric, and
this language was originally created by Jim Hugunin with contributions from several other
developers. In 2005, Travis Oliphant created NumPy by incorporating features of the compet-
ing Numarray into Numeric, with extensive modifications. [12] It is an open source library and
free of cost.
Figure 3.3: NumPy basic example
27. 27
Chapter 4
Data collection
Before analyzing and visualization we need the raw data and this raw data can gathered from
different open source data websites available on the internet. This data will be in raw form, it
may be the PV solar panel sales, renewable energy consumption or production in any specific
area or regions where solar or wind which one is more favorable. As here we are focusing on
the renewable energy data sets so we will be considering following websites where this data is
available.
https://data.world/
Here we can find data related to each and every field, it is the most widely used website for data
analysis. We can also gather energy related data from this website.
The data sets available here is not specifically for renewable energy. Kaggle is general data sets
website, here you can get generalized data.
28. 28
https://www.kaggle.com/
The data sets available here is not specifically for renewable energy. Kaggle is general data sets
website, here you can get generalized data.
29. 29
Chapter 5
Employee Turnover Prediction
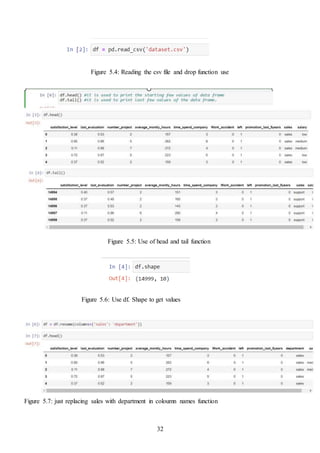
This raw data consist of 'satisfaction_level', 'last_evaluation', 'number_project',
'average_montly_hours', 'time_spend_company', 'Work_accident', 'left',
'promotion_last_5years', 'sales', 'salary']
. We are going to analyze the data, we will also focus on the other trends and compare them.
Data collection methodology The data set has many data points transaction, year, unit,
DATA VISUALIZATION AND ANALYSIS
We will be analyzing the data with the help of some questions. Below is the figure of the data
sheet in excel that will give you the hint that how the data is available to us.
30. 30
Figure 5.1: Data Set
Analysis will be easierby giving explanation to the following set of questions.
1. Importing necessary libraries
2. Solution: The explanation of each and every line is provided inside the program itself,
A line beginning with hash tag is the explanation of that particular line of code.
32. 32
Figure 5.4: Reading the csv file and drop function use
Figure 5.5: Use of head and tail function
Figure 5.6: Use df. Shape to get values
Figure 5.7: just replacing sales with department in coloumn names function
33. 33
Figure 5.8: checking unique values in department
Figure 5.9: Plotting the graph
Figure 5.10: seeing visuvalization of time spent in company
note – from above we seen how to import data , shape of the data , and some EDA part
of particular columns , technical is high so it will be taking as outlet as most of people is
there in that domain , we taking that colum off from data or ot considering and it cn be
seen below
34. 34
Solution: Explanation of the code is provided inside the program itself after each line
of code.
Figure 5.11: Importing the packages
Figure 5.12: taking colums except support , technical and it as thery not much needed
35. 35
Figure 5.13checking if there is null values
Figure 5.14: checking unique values in salary
Figure 5.15: adding sub in department as new columns from dummies
36. 36
Figure 5.16: dummies of department
Figure 5.17: droping these columns as no more needed from dataset
Figure 5.18: using seaborn checking correlation of data
37. 37
Figure 5.19: dividing data into 2 variables for x all columns except left column , left as y
Figure 5.20: using standard scaler , train test split
Conclusion – we use standard scaler to make every value into decimal , so machine can
understand the data well , to do work , and used train test split for training the model ,
here we gave 25% as test and rest for training the model
41. 41
bliography
[1] Data science https://en.wikipedia.org/wiki/Data_science Accessed on
27-06-2020.
[2] A book on data science by Dr. Ossama Embarak, https://www.academia.edu/
37886932/Data_Analysis_and_Visualization_Using_Python_-_Dr.
_Ossama_Embarak.pdf Accessed on 27-06-2020.
[3] A blog on quora
https://www.quora.com Accessed on 27-06-2020.
[4] Smart data collective site
https://www.smartdatacollective.com Accessed on 28-06-2020
[5] A blog on by Grenoble School of business
https://www.stoodnt.com/index.php/blog/ Accessed on 28-06-2020.
[6] Python website https://www.python.org/doc/essays/blurb/ Accessed on 29-
06-2020.
[7] Data camp tutorial
https://www.datacamp.com/community/tutorials/
data-structures-python#adt Accessed on 29-06-2020
[8] AutomAte the Boring Stuff with Python Practical Programming for total Beginners (Au-
thor AL SWEIGART) Accessed on 29-06-2020
[9] https://wiki.python.org/ Accessed on 03-07-2020
[10] https://www.python-course.eu/python3_packages.php Accessed on
03-07-2020
[11] Matplotlib https://en.wikipedia.org/wiki/Matplotlib Accessed on 04- 07-
2020
[12] Numpy online https://en.wikipedia.org/wiki/NumPy Accessed on 07-07-
2020