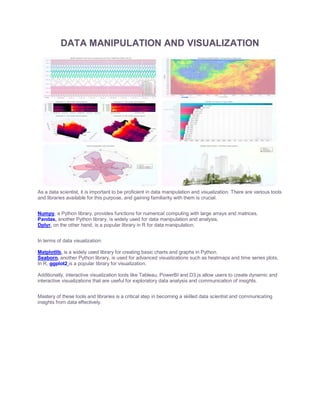
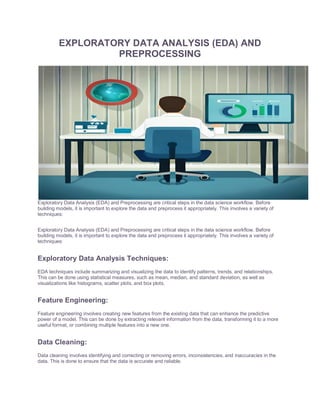
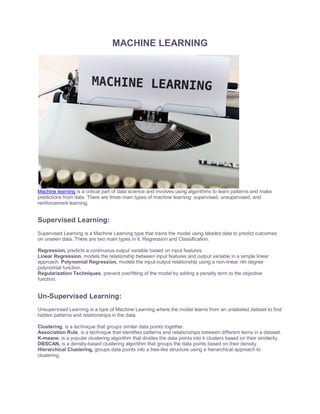
Data Science Roadmap: Your Path to
Mastery
To succeed as a data scientist, you should follow a structured path known as the “Data Science Roadmap.”
This path outlines foundational knowledge in math and programming. Data manipulation and visualization,
exploratory data analysis. Machine learning, deep learning, and advanced topics such as natural language
processing and time series analysis. Following this roadmap can help you acquire the skills and knowledge
needed to excel in this rapidly growing field.
Becoming a successful data scientist requires a unique combination of technical skills, business acumen, and
critical thinking ability. To achieve your career goals in this field, you need a structured plan or a data science
roadmap that outlines the skills, tools, and knowledge required to succeed. In this blog, we’ll take a closer look
at what a data science roadmap is, why it’s important, and how to create one that works for you.
At its core, It is a structured plan that outlines the skills, tools, and knowledge required to become a successful
data scientist. It serves as a guidepost to help individuals navigate the complex landscape of data science and
provides a clear path towards achieving their career objectives.
WHAT IS DATA SCIENCE ROAD MAP?
Data science journey typically consists of several key components, including:
Technical Skills:
Data science is a highly technical field that requires a solid foundation in mathematics, statistics, programming,
and database management. A good data science roadmap will identify the specific technical skills needed to
succeed in the field and provide guidance on the best resources for learning them.
Tools and Technologies:
In addition to technical skills, data scientists must also be proficient in a variety of tools and technologies, such
as data visualization tools, machine learning frameworks, and big data platforms. A data science roadmap
should provide an overview of these tools and help individuals identify which ones are most relevant to their
career goals.
Business Acumen:
Data science is not just about technical skills – it’s also about understanding the business context in which data
is being used. A good data science roadmap will help individuals develop a strong foundation in business
acumen, including topics such as project management, communication skills, and strategic thinking.
Specializations:
Data science is a broad field, and individuals may choose to specialize in specific areas, such as data
engineering, data visualization, or machine learning. A data science roadmap should help individuals identify
which specializations are most aligned with their career goals and provide guidance on how to acquire the
necessary skills and knowledge.
To become an expert in the field of data science, there are certain steps that one can take to advance their
skills and knowledge
FOUNDATIONAL KNOWLEDGE
Foundational knowledge is essential for anyone who wishes to pursue a career in data science. It includes a
strong understanding of mathematics and programming, specifically in areas such as linear algebra, calculus,
probability and statistics, and Python programming. This foundational knowledge serves as a building block for
gaining practical experience through internships, personal projects, or online courses, ultimately leading to the
development of advanced skills in the field of data science.
MATHEMATICS
Linear Algebra, is a branch of mathematics that deals with linear equations and linear functions, their
representations, and properties. It is an essential mathematical tool in many areas of science, engineering, and
computer science. Linear algebra involves the study of vector spaces, linear transformations, matrices,
determinants, eigenvalues, and eigenvectors.
Calculas is a branch of mathematics that deals with rates of change and the accumulation of small quantities.
It has two main branches: differential calculus and integral calculus. Differential calculus is concerned with the
study of the rate at which quantities change, while integral calculus deals with the accumulation of quantities
over time.
Probability and Statistics, are two interrelated branches of mathematics that deal with the analysis of data
and the likelihood of events occurring. Probability is concerned with the study of random events and their
outcomes, while statistics is concerned with the analysis of data and the drawing of conclusions from it.
PROGRAMMING
PYTHON
Syntax and Basic Concepts: Python is a high-level, interpreted programming language that is widely used in
many areas of computer science, such as data analysis, artificial intelligence, web development, and scientific
computing. Python’s syntax is designed to be easy to read and write, with minimal use of punctuation and a
consistent indentation scheme. Some basic concepts in Python include variables, data types, operators, and
control structures.
Data Structures: Data structures are a way of organizing and storing data in a computer’s memory. Python
provides several built-in data structures, such as lists, tuples, dictionaries, and sets. These data structures can
be used to represent complex data in a structured and organized manner.
Control Structures: Control structures are programming constructs that control the flow of execution in a
program. Python provides several control structures, such as if-else statements, loops, and functions. These
control structures are used to make decisions, iterate over data, and execute specific code blocks.
Functions: Functions are a way of encapsulating a piece of code that can be reused in a program. In Python,
functions are defined using the “def” keyword and can take input parameters and return output values.
Functions can be used to modularize code and make it more organized and easier to read.
Object-Oriented Programming: Object-oriented programming (OOP) is a programming paradigm that is
based on the concept of objects. Objects are instances of classes that encapsulate data and behavior. Python
is an object-oriented language, and it provides several features for implementing OOP, such as classes,
inheritance, and polymorphism.
R (optional, based on preference):
R is a programming language that is widely used in data analysis, statistical computing, and scientific research.
It provides several built-in functions and packages for data manipulation, visualization, and statistical analysis.
R is often preferred by statisticians and data scientists due to its powerful statistical capabilities and its flexibility
in data analysis.
DATA MANIPULATION AND VISUALIZATION
As a data scientist, it is important to be proficient in data manipulation and visualization. There are various tools
and libraries available for this purpose, and gaining familiarity with them is crucial.
Numpy, a Python library, provides functions for numerical computing with large arrays and matrices.
Pandas, another Python library, is widely used for data manipulation and analysis.
Dplyr, on the other hand, is a popular library in R for data manipulation.
In terms of data visualization:
Matplotlib, is a widely used library for creating basic charts and graphs in Python.
Seaborn, another Python library, is used for advanced visualizations such as heatmaps and time series plots.
In R, ggplot2 is a popular library for visualization.
Additionally, interactive visualization tools like Tableau, PowerBI and D3.js allow users to create dynamic and
interactive visualizations that are useful for exploratory data analysis and communication of insights.
Mastery of these tools and libraries is a critical step in becoming a skilled data scientist and communicating
insights from data effectively.
EXPLORATORY DATA ANALYSIS (EDA) AND
PREPROCESSING
Exploratory Data Analysis (EDA) and Preprocessing are critical steps in the data science workflow. Before
building models, it is important to explore the data and preprocess it appropriately. This involves a variety of
techniques:
Exploratory Data Analysis (EDA) and Preprocessing are critical steps in the data science workflow. Before
building models, it is important to explore the data and preprocess it appropriately. This involves a variety of
techniques:
Exploratory Data Analysis Techniques:
EDA techniques include summarizing and visualizing the data to identify patterns, trends, and relationships.
This can be done using statistical measures, such as mean, median, and standard deviation, as well as
visualizations like histograms, scatter plots, and box plots.
Feature Engineering:
Feature engineering involves creating new features from the existing data that can enhance the predictive
power of a model. This can be done by extracting relevant information from the data, transforming it to a more
useful format, or combining multiple features into a new one.
Data Cleaning:
Data cleaning involves identifying and correcting or removing errors, inconsistencies, and inaccuracies in the
data. This is done to ensure that the data is accurate and reliable.
Handling Missing Data:
Missing data is a common problem in real-world datasets, and handling it appropriately is crucial for accurate
analysis. This involves imputing missing values or removing them depending on the circumstances.
Data Scaling and Normalization:
Data scaling and normalization are techniques used to ensure that data is in a consistent format and that the
differences in scale and magnitude across features are accounted for.
Outlier Detection and Treatment:
Outliers are extreme values that can skew the analysis and results of a model. Detecting and treating them
appropriately is important for accurate modeling.
By applying these techniques, a data scientist can ensure that the data is in the best possible condition for
analysis and modeling.
MACHINE LEARNING
Machine learning is a critical part of data science and involves using algorithms to learn patterns and make
predictions from data. There are three main types of machine learning: supervised, unsupervised, and
reinforcement learning.
Supervised Learning:
Supervised Learning is a Machine Learning type that trains the model using labeled data to predict outcomes
on unseen data. There are two main types in it. Regression and Classification.
Regression, predicts a continuous output variable based on input features.
Linear Regression, models the relationship between input features and output variable in a simple linear
approach. Polynomial Regression, models the input-output relationship using a non-linear nth degree
polynomial function.
Regularization Techniques, prevent overfitting of the model by adding a penalty term to the objective
function.
Un-Supervised Learning:
Unsupervised Learning is a type of Machine Learning where the model learns from an unlabeled dataset to find
hidden patterns and relationships in the data.
Clustering, is a technique that groups similar data points together.
Association Rule, is a technique that identifies patterns and relationships between different items in a dataset.
K-means, is a popular clustering algorithm that divides the data points into k clusters based on their similarity.
DBSCAN, is a density-based clustering algorithm that groups the data points based on their density.
Hierarchical Clustering, groups data points into a tree-like structure using a hierarchical approach to
clustering.
Dimensionality Reduction:
Dimensionality Reduction is a technique that reduces the number of input features while preserving the data’s
information content.
Principal Component Analysis (PCA), is a linear technique that reduces the dimensionality of data while
retaining its essential information.
t-Distributed Stochastic Neighbor Embedding (t-SNE), is a non-linear method that maps high-dimensional
data to a low-dimensional space for visualization.
Linear Discriminant Analysis (LDA), uses a linear method to find the best discriminant functions that
separate the different classes.
Reinforcement Learning
Reinforcement Learning is a type of Machine Learning where an agent learns to make decisions by interacting
with an environment. The agent receives rewards or punishments based on its actions, and its goal is to
maximize the rewards over the long term. Reinforcement Learning algorithms use a trial-and-error approach to
learn the optimal behavior by adjusting the policy, which is a mapping from states to actions. The most
common Reinforcement Learning algorithms are
Q-Learning and SARSA, which are both based on the Bellman Equation. Reinforcement Learning has
applications in various fields, such as robotics, game playing, and recommendation systems. However, it
requires a lot of data and time to train the agent, and the reward function design can be challenging.
In the context of Machine Learning, performing certain tasks is essential. These tasks include Model Evaluation
and Validation, Cross-validation, Model Selection Techniques, and Evaluation Metrics.
Model Evaluation and Validation, to assess the model’s performance on new, unseen data.
Cross-validation, The technique used to estimate the performance of the model on new data.
Model selection, techniques utilize to choose the best model from multiple models.
Evaluation Metrics, are essential for measuring the performance of the model on new data. These steps help
in creating an accurate and reliable machine learning model.
DEEP LEARNING
Deep learning, a type of machine learning, is a highly effective approach to training artificial neural networks
using a vast amount of data. It has revolutionized various fields, including computer vision, natural language
processing, and speech recognition. Deep learning models, such as convolutional neural networks (CNNs) and
recurrent neural networks (RNNs), can autonomously learn to detect patterns and extract features from
complex data types, like images, audio, and text.
Neural Networks:
Neural networks are a type of machine learning algorithm inspired by the human brain.
The Perceptron, is the simplest form of a neural network, consisting of a single neuron that receives input and
produces output.
The multi-layer perceptron (MLP), is a more complex neural network that consists of multiple layers of
neurons and can learn to solve more complicated problems.
Convolutional Neural Networks (CNNs),
CNNs excel at image-related tasks such as image classification, object detection, and image segmentation.
They use convolutional layers to learn features from images, and can achieve state-of-the-art performance on a
variety of computer vision tasks.
Recurrent Neural Networks (RNNs)
RNNs are a type of neural network that can process sequences of input data, such as text or time series data.
RNNs can perform text classification and sentiment analysis, while sequence-to-sequence models can
translate one sequence into another. LSTM and GRU are RNN types that address the vanishing gradient
problem that arises when training traditional RNNs on lengthy sequences. They are frequently employed for
tasks like language modeling and time series forecasting.
Generative Adversarial Networks (GANs)
GANs are a type of neural network that can generate new data that is similar to a training set. They consist of
two neural networks, one that generates new data and one that tries to distinguish between real and fake data.
GANs enable the accomplishment of tasks such as image synthesis, style transfer, and data augmentation.
ADVANCED TOPICS
Natural Language Processing (NLP),
NLP is a subfield of artificial intelligence that focuses on enabling machines to understand, process, and
generate natural language. Text preprocessing, plays a crucial role in cleaning, normalizing, and transforming
raw text data into an analyzable format. Word embeddings, such as Word2Vec and GloVe, represent words
as vectors that capture their semantic meaning.
Transformer Models,
TM such as BERT and GPT, are a type of neural network that have recently achieved state-of-the-art
performance on a range of NLP tasks. They use self-attention mechanisms to enable the model to learn the
relationships between different parts of the input text.
Time Series Analysis
It is a field of study that focuses on analyzing and forecasting data that varies over time. Time series
decomposition involves separating a time series into its underlying trend, seasonal, and residual components.
ARIMA and SARIMA are models that use auto-regression, integration, and moving average components to
capture autocorrelation and seasonality in time series data for the purpose of forecasting. Exponential
smoothing methods are another family of time series forecasting models that are based on the idea of
smoothing past observations to make predictions for the future.
Recommender systems
are used to recommend items, such as movies or products, to users based on their preferences. Collaborative
filtering is a common technique that analyzes a user’s past behavior and the behavior of similar users to make
recommendations. Content-based filtering, on the other hand, recommends items based on their attributes
and the user’s past preferences. Matrix factorization is a technique that can be used for collaborative filtering
and involves decomposing a matrix of user-item interactions into low-rank matrices.
Causal Inference
It is a field of study that aims to identify causal relationships between variables. Experimental design involves
conducting experiments where the treatment is randomly assigned to the subjects. Observational studies, on
the other hand, involve analyzing data where the treatment is not randomly assigned. Propensity score
matching is a method used in observational studies to reduce selection bias by matching individuals in the
treatment and control groups based on their propensity score. Instrumental variable analysis is another method
used in observational studies that identifies a variable that affects the treatment but is not affected by the
outcome.
Advanced Deep Learning Techniques
It’s involve more complex architectures and models that can achieve state-of-the-art performance on a range of
tasks. Advanced architectures, like Transformers and GPT models, use attention mechanisms to learn the
relationships between different parts of input data. Additionally, generative models, such as VAEs and flow-
based models, generate similar new data. To improve performance on specific tasks, advanced techniques for
NLP and computer vision incorporate additional information. These techniques include visual attention and
knowledge graphs.
Are you interested in expanding your knowledge on data science roadmap? I highly recommend checking out
these helpful blog posts that have been a valuable resource for me. I believe they can provide great support
and guidance for you as well.
Essential data science job skills every data scientist should know

DataScience_RoadMap_2023.pdf

  • 1.
    Data Science Roadmap:Your Path to Mastery To succeed as a data scientist, you should follow a structured path known as the “Data Science Roadmap.” This path outlines foundational knowledge in math and programming. Data manipulation and visualization, exploratory data analysis. Machine learning, deep learning, and advanced topics such as natural language processing and time series analysis. Following this roadmap can help you acquire the skills and knowledge needed to excel in this rapidly growing field. Becoming a successful data scientist requires a unique combination of technical skills, business acumen, and critical thinking ability. To achieve your career goals in this field, you need a structured plan or a data science roadmap that outlines the skills, tools, and knowledge required to succeed. In this blog, we’ll take a closer look at what a data science roadmap is, why it’s important, and how to create one that works for you. At its core, It is a structured plan that outlines the skills, tools, and knowledge required to become a successful data scientist. It serves as a guidepost to help individuals navigate the complex landscape of data science and provides a clear path towards achieving their career objectives. WHAT IS DATA SCIENCE ROAD MAP?
  • 2.
    Data science journeytypically consists of several key components, including: Technical Skills: Data science is a highly technical field that requires a solid foundation in mathematics, statistics, programming, and database management. A good data science roadmap will identify the specific technical skills needed to succeed in the field and provide guidance on the best resources for learning them. Tools and Technologies: In addition to technical skills, data scientists must also be proficient in a variety of tools and technologies, such as data visualization tools, machine learning frameworks, and big data platforms. A data science roadmap should provide an overview of these tools and help individuals identify which ones are most relevant to their career goals. Business Acumen: Data science is not just about technical skills – it’s also about understanding the business context in which data is being used. A good data science roadmap will help individuals develop a strong foundation in business acumen, including topics such as project management, communication skills, and strategic thinking. Specializations: Data science is a broad field, and individuals may choose to specialize in specific areas, such as data engineering, data visualization, or machine learning. A data science roadmap should help individuals identify which specializations are most aligned with their career goals and provide guidance on how to acquire the necessary skills and knowledge. To become an expert in the field of data science, there are certain steps that one can take to advance their skills and knowledge
  • 3.
    FOUNDATIONAL KNOWLEDGE Foundational knowledgeis essential for anyone who wishes to pursue a career in data science. It includes a strong understanding of mathematics and programming, specifically in areas such as linear algebra, calculus, probability and statistics, and Python programming. This foundational knowledge serves as a building block for gaining practical experience through internships, personal projects, or online courses, ultimately leading to the development of advanced skills in the field of data science. MATHEMATICS Linear Algebra, is a branch of mathematics that deals with linear equations and linear functions, their representations, and properties. It is an essential mathematical tool in many areas of science, engineering, and computer science. Linear algebra involves the study of vector spaces, linear transformations, matrices, determinants, eigenvalues, and eigenvectors. Calculas is a branch of mathematics that deals with rates of change and the accumulation of small quantities. It has two main branches: differential calculus and integral calculus. Differential calculus is concerned with the study of the rate at which quantities change, while integral calculus deals with the accumulation of quantities over time. Probability and Statistics, are two interrelated branches of mathematics that deal with the analysis of data and the likelihood of events occurring. Probability is concerned with the study of random events and their outcomes, while statistics is concerned with the analysis of data and the drawing of conclusions from it.
  • 4.
    PROGRAMMING PYTHON Syntax and BasicConcepts: Python is a high-level, interpreted programming language that is widely used in many areas of computer science, such as data analysis, artificial intelligence, web development, and scientific computing. Python’s syntax is designed to be easy to read and write, with minimal use of punctuation and a consistent indentation scheme. Some basic concepts in Python include variables, data types, operators, and control structures. Data Structures: Data structures are a way of organizing and storing data in a computer’s memory. Python provides several built-in data structures, such as lists, tuples, dictionaries, and sets. These data structures can be used to represent complex data in a structured and organized manner. Control Structures: Control structures are programming constructs that control the flow of execution in a program. Python provides several control structures, such as if-else statements, loops, and functions. These control structures are used to make decisions, iterate over data, and execute specific code blocks. Functions: Functions are a way of encapsulating a piece of code that can be reused in a program. In Python, functions are defined using the “def” keyword and can take input parameters and return output values. Functions can be used to modularize code and make it more organized and easier to read. Object-Oriented Programming: Object-oriented programming (OOP) is a programming paradigm that is based on the concept of objects. Objects are instances of classes that encapsulate data and behavior. Python is an object-oriented language, and it provides several features for implementing OOP, such as classes, inheritance, and polymorphism. R (optional, based on preference): R is a programming language that is widely used in data analysis, statistical computing, and scientific research. It provides several built-in functions and packages for data manipulation, visualization, and statistical analysis. R is often preferred by statisticians and data scientists due to its powerful statistical capabilities and its flexibility in data analysis.
  • 5.
    DATA MANIPULATION ANDVISUALIZATION As a data scientist, it is important to be proficient in data manipulation and visualization. There are various tools and libraries available for this purpose, and gaining familiarity with them is crucial. Numpy, a Python library, provides functions for numerical computing with large arrays and matrices. Pandas, another Python library, is widely used for data manipulation and analysis. Dplyr, on the other hand, is a popular library in R for data manipulation. In terms of data visualization: Matplotlib, is a widely used library for creating basic charts and graphs in Python. Seaborn, another Python library, is used for advanced visualizations such as heatmaps and time series plots. In R, ggplot2 is a popular library for visualization. Additionally, interactive visualization tools like Tableau, PowerBI and D3.js allow users to create dynamic and interactive visualizations that are useful for exploratory data analysis and communication of insights. Mastery of these tools and libraries is a critical step in becoming a skilled data scientist and communicating insights from data effectively.
  • 6.
    EXPLORATORY DATA ANALYSIS(EDA) AND PREPROCESSING Exploratory Data Analysis (EDA) and Preprocessing are critical steps in the data science workflow. Before building models, it is important to explore the data and preprocess it appropriately. This involves a variety of techniques: Exploratory Data Analysis (EDA) and Preprocessing are critical steps in the data science workflow. Before building models, it is important to explore the data and preprocess it appropriately. This involves a variety of techniques: Exploratory Data Analysis Techniques: EDA techniques include summarizing and visualizing the data to identify patterns, trends, and relationships. This can be done using statistical measures, such as mean, median, and standard deviation, as well as visualizations like histograms, scatter plots, and box plots. Feature Engineering: Feature engineering involves creating new features from the existing data that can enhance the predictive power of a model. This can be done by extracting relevant information from the data, transforming it to a more useful format, or combining multiple features into a new one. Data Cleaning: Data cleaning involves identifying and correcting or removing errors, inconsistencies, and inaccuracies in the data. This is done to ensure that the data is accurate and reliable.
  • 7.
    Handling Missing Data: Missingdata is a common problem in real-world datasets, and handling it appropriately is crucial for accurate analysis. This involves imputing missing values or removing them depending on the circumstances. Data Scaling and Normalization: Data scaling and normalization are techniques used to ensure that data is in a consistent format and that the differences in scale and magnitude across features are accounted for. Outlier Detection and Treatment: Outliers are extreme values that can skew the analysis and results of a model. Detecting and treating them appropriately is important for accurate modeling. By applying these techniques, a data scientist can ensure that the data is in the best possible condition for analysis and modeling.
  • 8.
    MACHINE LEARNING Machine learningis a critical part of data science and involves using algorithms to learn patterns and make predictions from data. There are three main types of machine learning: supervised, unsupervised, and reinforcement learning. Supervised Learning: Supervised Learning is a Machine Learning type that trains the model using labeled data to predict outcomes on unseen data. There are two main types in it. Regression and Classification. Regression, predicts a continuous output variable based on input features. Linear Regression, models the relationship between input features and output variable in a simple linear approach. Polynomial Regression, models the input-output relationship using a non-linear nth degree polynomial function. Regularization Techniques, prevent overfitting of the model by adding a penalty term to the objective function. Un-Supervised Learning: Unsupervised Learning is a type of Machine Learning where the model learns from an unlabeled dataset to find hidden patterns and relationships in the data. Clustering, is a technique that groups similar data points together. Association Rule, is a technique that identifies patterns and relationships between different items in a dataset. K-means, is a popular clustering algorithm that divides the data points into k clusters based on their similarity. DBSCAN, is a density-based clustering algorithm that groups the data points based on their density. Hierarchical Clustering, groups data points into a tree-like structure using a hierarchical approach to clustering.
  • 9.
    Dimensionality Reduction: Dimensionality Reductionis a technique that reduces the number of input features while preserving the data’s information content. Principal Component Analysis (PCA), is a linear technique that reduces the dimensionality of data while retaining its essential information. t-Distributed Stochastic Neighbor Embedding (t-SNE), is a non-linear method that maps high-dimensional data to a low-dimensional space for visualization. Linear Discriminant Analysis (LDA), uses a linear method to find the best discriminant functions that separate the different classes. Reinforcement Learning Reinforcement Learning is a type of Machine Learning where an agent learns to make decisions by interacting with an environment. The agent receives rewards or punishments based on its actions, and its goal is to maximize the rewards over the long term. Reinforcement Learning algorithms use a trial-and-error approach to learn the optimal behavior by adjusting the policy, which is a mapping from states to actions. The most common Reinforcement Learning algorithms are Q-Learning and SARSA, which are both based on the Bellman Equation. Reinforcement Learning has applications in various fields, such as robotics, game playing, and recommendation systems. However, it requires a lot of data and time to train the agent, and the reward function design can be challenging. In the context of Machine Learning, performing certain tasks is essential. These tasks include Model Evaluation and Validation, Cross-validation, Model Selection Techniques, and Evaluation Metrics. Model Evaluation and Validation, to assess the model’s performance on new, unseen data. Cross-validation, The technique used to estimate the performance of the model on new data. Model selection, techniques utilize to choose the best model from multiple models. Evaluation Metrics, are essential for measuring the performance of the model on new data. These steps help in creating an accurate and reliable machine learning model.
  • 10.
    DEEP LEARNING Deep learning,a type of machine learning, is a highly effective approach to training artificial neural networks using a vast amount of data. It has revolutionized various fields, including computer vision, natural language processing, and speech recognition. Deep learning models, such as convolutional neural networks (CNNs) and recurrent neural networks (RNNs), can autonomously learn to detect patterns and extract features from complex data types, like images, audio, and text. Neural Networks: Neural networks are a type of machine learning algorithm inspired by the human brain. The Perceptron, is the simplest form of a neural network, consisting of a single neuron that receives input and produces output. The multi-layer perceptron (MLP), is a more complex neural network that consists of multiple layers of neurons and can learn to solve more complicated problems. Convolutional Neural Networks (CNNs), CNNs excel at image-related tasks such as image classification, object detection, and image segmentation. They use convolutional layers to learn features from images, and can achieve state-of-the-art performance on a variety of computer vision tasks. Recurrent Neural Networks (RNNs) RNNs are a type of neural network that can process sequences of input data, such as text or time series data. RNNs can perform text classification and sentiment analysis, while sequence-to-sequence models can translate one sequence into another. LSTM and GRU are RNN types that address the vanishing gradient problem that arises when training traditional RNNs on lengthy sequences. They are frequently employed for tasks like language modeling and time series forecasting.
  • 11.
    Generative Adversarial Networks(GANs) GANs are a type of neural network that can generate new data that is similar to a training set. They consist of two neural networks, one that generates new data and one that tries to distinguish between real and fake data. GANs enable the accomplishment of tasks such as image synthesis, style transfer, and data augmentation. ADVANCED TOPICS Natural Language Processing (NLP), NLP is a subfield of artificial intelligence that focuses on enabling machines to understand, process, and generate natural language. Text preprocessing, plays a crucial role in cleaning, normalizing, and transforming raw text data into an analyzable format. Word embeddings, such as Word2Vec and GloVe, represent words as vectors that capture their semantic meaning. Transformer Models, TM such as BERT and GPT, are a type of neural network that have recently achieved state-of-the-art performance on a range of NLP tasks. They use self-attention mechanisms to enable the model to learn the relationships between different parts of the input text. Time Series Analysis It is a field of study that focuses on analyzing and forecasting data that varies over time. Time series decomposition involves separating a time series into its underlying trend, seasonal, and residual components. ARIMA and SARIMA are models that use auto-regression, integration, and moving average components to capture autocorrelation and seasonality in time series data for the purpose of forecasting. Exponential smoothing methods are another family of time series forecasting models that are based on the idea of smoothing past observations to make predictions for the future. Recommender systems are used to recommend items, such as movies or products, to users based on their preferences. Collaborative filtering is a common technique that analyzes a user’s past behavior and the behavior of similar users to make recommendations. Content-based filtering, on the other hand, recommends items based on their attributes and the user’s past preferences. Matrix factorization is a technique that can be used for collaborative filtering and involves decomposing a matrix of user-item interactions into low-rank matrices. Causal Inference It is a field of study that aims to identify causal relationships between variables. Experimental design involves conducting experiments where the treatment is randomly assigned to the subjects. Observational studies, on the other hand, involve analyzing data where the treatment is not randomly assigned. Propensity score matching is a method used in observational studies to reduce selection bias by matching individuals in the treatment and control groups based on their propensity score. Instrumental variable analysis is another method used in observational studies that identifies a variable that affects the treatment but is not affected by the outcome.
  • 12.
    Advanced Deep LearningTechniques It’s involve more complex architectures and models that can achieve state-of-the-art performance on a range of tasks. Advanced architectures, like Transformers and GPT models, use attention mechanisms to learn the relationships between different parts of input data. Additionally, generative models, such as VAEs and flow- based models, generate similar new data. To improve performance on specific tasks, advanced techniques for NLP and computer vision incorporate additional information. These techniques include visual attention and knowledge graphs. Are you interested in expanding your knowledge on data science roadmap? I highly recommend checking out these helpful blog posts that have been a valuable resource for me. I believe they can provide great support and guidance for you as well. Essential data science job skills every data scientist should know