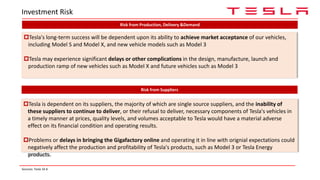
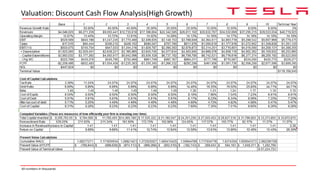
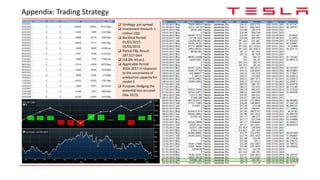
Tesla Motors Inc is pitching an investment in the company. Major catalysts for the investment are the upcoming Gigafactory battery production facility and Tesla Model 3 vehicle. The presentation recommends a buy rating for Tesla stock with a 10-year investment horizon and a target price of $545 per share based on discounted cash flow analysis and comparable company valuations. Risks include production and demand challenges.

![Company Profile
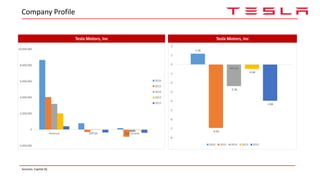
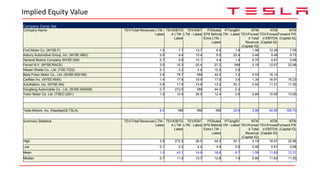
Tesla Motors, Inc Stock Performance T12M
Summary Financials
FY16E FY15A FY14A FY13A FY12A
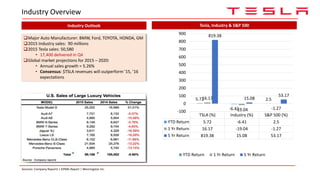
Revenue 8,658,800 4,046,000 3,198,400 2,013,500 413,300
Gross Margins 24.1% 22.8% 27.6% 22.7% 7.3%
EBITDA 791,600 -294,000 45,200 44,800 -365,500
Net Income 180,000 -888,700 -294,000 -57,600 -396,200
Free Cash Flow -835,000 -2,159,300 -1,027,000 -6,200 -505,300
EPS ($) 1.18 -6.93 -2.36 -0.48 -3.96
Ticker Symbol: TSLA [NASDAQ]
Headquarter: Palo Auto, California
Industry: Automotive
CEO: Elon Musk
Stock Price: $240.76 [4/29/16 at close]
Market Cap: $33.51B
52 Week Range: $141.05.00 - $286.65
2015 P/E: N/A
Shares Outstanding: 2845M
$TSLA Company Headlines
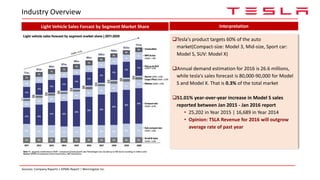
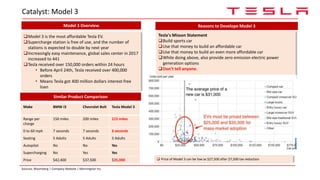
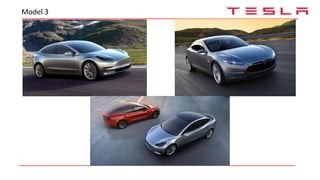
Tesla Model 3 launches: The first affordable fully electric vehicle for
Tesla is open for pre-order
Tesla has received around 400,000 orders of $35,000 worth
Model 3 so far
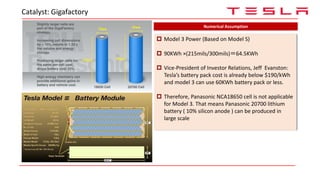
Tesla may use new Panasonic battery for Model 3: Once Gigafactory
production begins though, Tesla will be upgrading to new 20700 battery
cells, which will be physically larger, capable of holding more energy
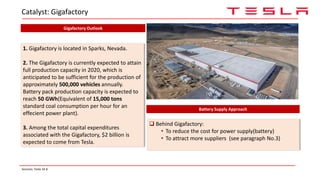
Gigafactory is planned go online in 2017: Tesla broke ground on the
Gigafactory in June 2014 outside Sparks, Nevada, and we expect to begin
cell production in 2017. By 2020, the Gigafactory will reach full capacity
and produce more lithium ion batteries annually than were produced
worldwide in 2013.
All figures in thousands of dollars [excluding EPS]Sources: Company Press Release | Yahoo Finance | Capital IQ](https://image.slidesharecdn.com/tesla-160611054433/85/Tesla-4-320.jpg)