Application of Satellite Geodesy in Environmental and Climate Changes
•Download as PPTX, PDF•
3 likes•357 views

Satellite geodesy uses satellites to measure the shape and gravity of Earth. Satellite techniques like altimetry, GPS, InSAR, and GRACE monitor environmental changes from ice sheet mass balance, coastal uplift, and ground deformation. Studies using these techniques show increases in ice melt from Greenland and Antarctica, contributing to rising sea levels. InSAR effectively monitors surface changes from fluid injection into reservoirs.

Recommended
Recommended
More Related Content
What's hot
What's hot (20)
Similar to Application of Satellite Geodesy in Environmental and Climate Changes
Similar to Application of Satellite Geodesy in Environmental and Climate Changes (20)
Recently uploaded
Recently uploaded (20)
Application of Satellite Geodesy in Environmental and Climate Changes
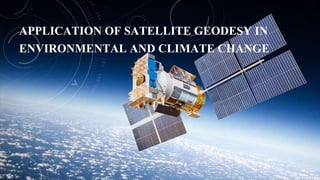
- 1. APPLICATION OF SATELLITE GEODESY IN ENVIRONMENTAL AND CLIMATE CHANGE 1
- 2. WHAT IS SATELLITE GEODESY? Satellite geodesy is the measurement of the size and shape of the earth as well as its gravity field by means of artificial satellites. Satellite geodesy is a powerful tool to monitor time variations in the Earth related to plate tectonics, post-glacial rebounds, ocean circulation, ground water extraction etc. 2
- 3. SATELLITE GEODETIC MEASUREMENT TECHNIQUES Satellite Altimetry High precision Global Positioning System (GPS) Interferometric Synthetic Aperture Radar (InSAR) Gravity Recovery and Climate Experiment (GRACE). Laser ranging 3
- 4. Satellite Altimetry Satellite altimetry measures the time taken by a radar pulse to travel from the satellite antenna to the surface and back to the satellite receiver. Global Positioning System (GPS) It is a global navigation satellite system that provides geolocation and time information to a GPS receiver anywhere on or near the Earth. 4
- 5. Interferometric Synthetic Aperture Radar (InSAR) InSAR (Interferometric Synthetic Aperture Radar) is a technique for mapping ground deformation using radar images of the Earth's surface that are collected from orbiting satellites. Unlike visible or infrared light, radio waves penetrate most weather clouds and are equally effective in darkness. So with InSAR it is possible to track ground deformation even in bad weather or at night. Gravity Recovery and Climate Experiment (GRACE). GRACE measures gravity anomalies, and shows how mass is distributed around the planet and how it varies over time. 5
- 6. ENVIRONMENTAL AND CLIMATE CHANGES Annual Variation of Coastal Uplift as an Indicator of Variable and Accelerating Ice Mass Loss. Recent increases in Arctic and Antarctic freshwater flux due to the melting of ice which in turn effects the ocean currents. Ground Deformations due to injection of fluids. 6
- 7. ICE SHEET MASS BALANCE The mass balance of an ice sheet is the difference between its total snow input and the total loss through melting. So long as an ice sheet gains an equal mass through snowfall as it loses through melt, ablation, and calving from glaciers and ice shelves, it is said to be in balance. 7
- 8. APPLICATIONS OF GPS AND InSAR FOR MEASUREMENT OF ICE SHEET MASS BALANCE 8
- 9. These images show the glacier in February 1992 (left) and October 2000 (right). Estimated flow speeds are marked by color, with purple indicating the highest rate. Black lines show 1,000-meter-per year speed intervals, and white lines show 200, 400, 600, and 800-meter-per-year speed intervals. Jakobshavn Glacier (a fast-moving glacier on the west coast of Greenland) 9
- 10. Remote sensing data from GPS and InSAR measuring the velocity of Jakobshavn Glacier (in Greenland) showed that between 1992 and 2003, the glacier exhibited a large increase in velocity. 10
- 11. These InSAR images show rates of change in elevation in Greenland and Antarctica from 2003 to 2007. Dark blue indicates an increase of 0.5 meters per year, and dark red indicates a decrease of 1.5 meters per year. Change in Ice Sheet Surface elevation of Greenland and Antarctica 11
- 12. Gravity Recovery and Climate Experiment (GRACE) has provided glaciologists with a new tool to study mass balance on both Greenland and Antarctica. GRACE measures changes in the strength of the gravitational force over the surface of the Earth, including changes driven by the accumulation or loss of ice. Applications of GRACE for measurement of Ice Sheet Mass 12
- 13. GRACE satellite gravity estimates, indicate that between April 2015 and April 2016 there was a net ice mass loss of 191 Gt. 13
- 14. InSAR MONITORING OF GROUND DEFORMATION DUE TO INJECTION OF CO2 Injection of CO2 or other fluid into a reservoir at depth increases fluid pressure in the reservoir, causing deformation in the overlying strata and inducing surface deformation. If the pressure change is large enough, the surface deformation may be measurable. Interferometric synthetic aperture radar (InSAR) technique has been successfully used to monitor surface deformation associated with CO2 injection at many oil fields. 14
- 15. This figure shows the Total LOS (line of sight) displacement from January 08, 2007 to March 06, 2011. Red star represents location of the town of Snyder, West Texas. Blue line is the approximate boundary of the oil field in the study area. 15
- 16. References: SOTC: Ice Sheets, National Snow and Ice Data Center, Cited 9 November 2015, https://nsidc.org/cryosphere/sotc/ice_sheets.html Joughin, I., B.E. Smith, I.M. Howat, T. Scambos, T. Moon. 2010. Greenland flow variability from ice-sheet-wide velocity mapping. Journal of Glaciology 56(197): 415-430. Velicogna, I., and J. Wahr. 2006. Acceleration of Greenland ice mass loss in spring 2004. Nature 443:329-331. Velicongna, I. 2009. Increasing rates of ice mass loss from the Greenland and Antarctic ice sheets revealed by GRACE. Geophysical Research Letters 36: L19503. Wikipedia: Satellite geodesy, Cited 22 May 2017, https://en.wikipedia.org/wiki/Satellite_geodesy 16
- 17. 17