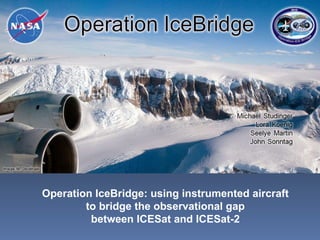
Operation IceBridge: using instrumented aircraft to bridge the observational gap between ICESat and ICESat-2
New Suborbital Mission: Operation IceBridge
IceBridge will produce a robust, cross-calibrated a 17-year time series of ice sheet and sea ice elevation data together with ICESat,  CryoSat-2, and ICESat-2  The 17-year time series will be the definitive resource for predictive models of sea ice and ice sheet behavior In addition to laser altimetry, IceBridge is using the most comprehensive and sophisticated suite of instruments ever flown in polar research to yield an unprecedented three-dimensional view of the Arctic and Antarctic ice sheets, ice shelves, and the sea ice IceBridge is the largest airborne survey of Earth's polar ice ever flown
successful collaboration of  several NASA centers run out of Goddard University Partners: University of Kansas (CReSIS) Columbia University (LDEO)
  IceBridge exploits airborne platforms when making altimetry measurements to make other critical measurements to understanding change in polar ice sheets: most comprehensive  and sophisticated suite of instruments ever flown in polar regions Instrument Operator Measurement Type ATM NASA – WFF ice surface (1,500 ft AGL) laser altimeters LVIS  NASA – GSFC ice surface (35,000 ft AGL) DMS NASA – ARC digital photography MCoRDS KU CReSIS bedrock elevation radars for snow and ice thickness snow radar KU CReSIS snow thickness Ku-band radar KU CReSIS ice surface elevation accumulation radar KU CReSIS near-surface layers gravimeter SGL/ LDEO water depth, geoid onboard data NSERC aux. data: temperature, etc.
largest external structure ever flown on a P-3 designed, built, and installed in only 3 months
 
2012 – 2015: start deploying Global Hawk over Antarctica in addition to NASA campaigns: smaller, university-led campaigns in Alaska and East Antarctica with DHC-3 and DC-3s two campaigns per year to monitor temporal and spatial changes Arctic (Mar-Apr) Antarctica (Oct-Nov) P-3B:  Greenland and  Arctic Ocean DC-8: Antarctic Peninsula and West Antarctica
Total: 143 days of deployment 69 science missions 581 flight hours 350,000 km (8.6 times around the Earth) Greenland 2010 Antarctica 2009 Greenland 2009 Greenland 2010 Antarctica 2010 Jan 2009 Jan 2011 Jan 2010 Jul 2009 Jul 2010 P-3 DC-8 P-3 DC-8 planned DC-8
Antarctica 2009 Greenland/Arctic Ocean 2010 flight lines follow ICESat tracks and provide detailed mapping of critical areas
 
 
Examples of cross calibration between IceBridge and ICESat and CryoSat-2 Greenland Summit: ICESat calibration site First CryoSat-2 underflight at 88°N Pole hole flight around 86°S Antarctica
DC-8 over flight April 14, 2010  IceBridge DC-8 flying above GPS sled both measuring surface elevation Scientist measuring accumulation stacks along ICESat Track 412
Linking ICESat, CryoSat-2 and ICESat-2 with Operation IceBridge data flown at both, 35,000 ft AGL and at 1,500 ft AGL 35000 ft AGL: LVIS (laser altimeter) Digital photography 1500 ft AGL: ATM (laser altimeter) Ku-band radar  altimeter snow radar digital photography
IceBridge “pole hole” flight: 7 years of ICESat observations differenced with LVIS:  ~500,000 data points South Pole 86°S Credit : LVIS Team
This data calibrates ICESat data over the ice sheet, improving and extending the ICESat time series Uncertainties in ICESat determined dh/dt on the order of one-third to several times the GIS and AIS mass balance signal LVIS pole hole flight ICESat (Arctic Ocean) ICESat range bias determined from Credit: Michelle Hofton and Scott Luthcke
Pine Island Glacier, Antarctica Example how IceBridge exploits airborne platforms to make critical measurements to understanding change in polar ice sheets Pine Island Glacier is hard to reach and heavily crevassed critical data sets needed for models cannot be collected from space or from ground measurements = > can only be done with instrumented aircraft
ice surface velocity red = fast – blue = slow Pine Island Glacier is considered to have the greatest propensity to cause rapid sea level rise due to the massive volumes of ice that could be released rapid bottom melting near grounding line of up to 80 m/yr, potentially unstable situation sub-ice cavity geometry is needed to modeling of ice shelf decay, considered the greatest unknown in modeling of future sea level rise.
Altimeter  measurements along ICESat tracks and ATM flight lines in addition use all IceBridge instruments for comprehensive mapping of the entire catchment area and its boundary conditions for ice sheet models ATM, LVIS: ice surface elevation change radar: ice thickness and snow accumulation gravity: water depth beneath floating ice tongue
ICESat tracks ATM flight tracks 2009 ATM – 2003 ICESat 2009 ATM – 2003 ATM Ice surface velocity:  red = fast – blue = slow IceBridge ATM laser altimeter data 100 km
Right: the deep channel (blue) mapped by IceBridge is a new discovery.  The channel lies about 1 km below sea level, and provides a path for the above-freezing sea water to reach the glacier front.  Data is critical for ocean/ice sheet models to predict dynamic response of Pine Island Glacier to warming ocean waters. water depth beneath floating glacier:  blue = deep – red = shallow
Tweets: “ International collaboration lead to numerous "firsts" during the April 20 sea ice flight” “ DC-8 ... the depth sounder instrument is telling us that we're flying over 1.2 km of ice right now.” Social Networks Twitter Twitpic Blog YouTube
IceBridge will produce a robust, cross-calibrated a 17-year time series of ice sheet and sea ice elevation data together with ICESat,  CryoSat-2, and ICESat-2  The 17-year time series will be the definitive resource for predictive models of sea ice and ice sheet behavior In addition to laser altimetry, IceBridge is using the most comprehensive and sophisticated suite of instruments ever flown in polar research to yield an unprecedented three-dimensional view of the Arctic and Antarctic ice sheets, ice shelves, and the sea ice IceBridge is the largest airborne survey of Earth's polar ice ever flown Summary
Multichannel coherent radar depth sounder for NASA Operation IceBridge  Lei Shi, Christopher Allen, John Ledford, Fernando Rodriguez-Morales, William Blake, Ben Panzer, Stephen Prokopiack, Carlton Leuschen, Sivaprasad Gogineni Operation IceBridge: Using instrumented aircraft to bridge the observational gap between ICESat and ICESat-2 Michael Studinger, Lora Koenig, Seelye Martin, John Sonntag Airborne high-altitude, 25m footprint, waveform LiDAR mapping of Greenland and Antarctica  Michelle Hofton, Scott Luthcke, Bryan Blair, David Rabine Airborne 3D basal DEM and ice thickness map of Pine Island Glacier   William Blake, Lei Shi, Joshua Meisel, Christopher Allen, Prasad Gogineni Operation IceBridge overview and results from aircraft laser altimetry over Greenland and Antarctica William Krabill, John Sonntag, Serdar Manizade, Earl Fredrick, James Yungel 3D Imaging of ice sheets John Paden, Christopher Allen, Prasad Gogineni Ultra-wideband radar measurements of snow thickness over sea ice Ben Panzer, Carl Leuschen, Aqsa Patel, Thorsten Markus, Prasad Gogineni

WE2.L10.4: OPERATION ICEBRIDGE: USING INSTRUMENTED AIRCRAFT TO BRIDGE THE OBSERVATIONAL GAP BETWEEN ICESAT AND ICESAT-2

  • 1.
    Operation IceBridge: usinginstrumented aircraft to bridge the observational gap between ICESat and ICESat-2
  • 2.
    New Suborbital Mission:Operation IceBridge
  • 3.
    IceBridge will producea robust, cross-calibrated a 17-year time series of ice sheet and sea ice elevation data together with ICESat, CryoSat-2, and ICESat-2 The 17-year time series will be the definitive resource for predictive models of sea ice and ice sheet behavior In addition to laser altimetry, IceBridge is using the most comprehensive and sophisticated suite of instruments ever flown in polar research to yield an unprecedented three-dimensional view of the Arctic and Antarctic ice sheets, ice shelves, and the sea ice IceBridge is the largest airborne survey of Earth's polar ice ever flown
  • 4.
    successful collaboration of several NASA centers run out of Goddard University Partners: University of Kansas (CReSIS) Columbia University (LDEO)
  • 5.
    IceBridgeexploits airborne platforms when making altimetry measurements to make other critical measurements to understanding change in polar ice sheets: most comprehensive and sophisticated suite of instruments ever flown in polar regions Instrument Operator Measurement Type ATM NASA – WFF ice surface (1,500 ft AGL) laser altimeters LVIS NASA – GSFC ice surface (35,000 ft AGL) DMS NASA – ARC digital photography MCoRDS KU CReSIS bedrock elevation radars for snow and ice thickness snow radar KU CReSIS snow thickness Ku-band radar KU CReSIS ice surface elevation accumulation radar KU CReSIS near-surface layers gravimeter SGL/ LDEO water depth, geoid onboard data NSERC aux. data: temperature, etc.
  • 6.
    largest external structureever flown on a P-3 designed, built, and installed in only 3 months
  • 7.
  • 8.
    2012 – 2015:start deploying Global Hawk over Antarctica in addition to NASA campaigns: smaller, university-led campaigns in Alaska and East Antarctica with DHC-3 and DC-3s two campaigns per year to monitor temporal and spatial changes Arctic (Mar-Apr) Antarctica (Oct-Nov) P-3B: Greenland and Arctic Ocean DC-8: Antarctic Peninsula and West Antarctica
  • 9.
    Total: 143 daysof deployment 69 science missions 581 flight hours 350,000 km (8.6 times around the Earth) Greenland 2010 Antarctica 2009 Greenland 2009 Greenland 2010 Antarctica 2010 Jan 2009 Jan 2011 Jan 2010 Jul 2009 Jul 2010 P-3 DC-8 P-3 DC-8 planned DC-8
  • 10.
    Antarctica 2009 Greenland/ArcticOcean 2010 flight lines follow ICESat tracks and provide detailed mapping of critical areas
  • 11.
  • 12.
  • 13.
    Examples of crosscalibration between IceBridge and ICESat and CryoSat-2 Greenland Summit: ICESat calibration site First CryoSat-2 underflight at 88°N Pole hole flight around 86°S Antarctica
  • 14.
    DC-8 over flightApril 14, 2010 IceBridge DC-8 flying above GPS sled both measuring surface elevation Scientist measuring accumulation stacks along ICESat Track 412
  • 15.
    Linking ICESat, CryoSat-2and ICESat-2 with Operation IceBridge data flown at both, 35,000 ft AGL and at 1,500 ft AGL 35000 ft AGL: LVIS (laser altimeter) Digital photography 1500 ft AGL: ATM (laser altimeter) Ku-band radar altimeter snow radar digital photography
  • 16.
    IceBridge “pole hole”flight: 7 years of ICESat observations differenced with LVIS: ~500,000 data points South Pole 86°S Credit : LVIS Team
  • 17.
    This data calibratesICESat data over the ice sheet, improving and extending the ICESat time series Uncertainties in ICESat determined dh/dt on the order of one-third to several times the GIS and AIS mass balance signal LVIS pole hole flight ICESat (Arctic Ocean) ICESat range bias determined from Credit: Michelle Hofton and Scott Luthcke
  • 18.
    Pine Island Glacier,Antarctica Example how IceBridge exploits airborne platforms to make critical measurements to understanding change in polar ice sheets Pine Island Glacier is hard to reach and heavily crevassed critical data sets needed for models cannot be collected from space or from ground measurements = > can only be done with instrumented aircraft
  • 19.
    ice surface velocityred = fast – blue = slow Pine Island Glacier is considered to have the greatest propensity to cause rapid sea level rise due to the massive volumes of ice that could be released rapid bottom melting near grounding line of up to 80 m/yr, potentially unstable situation sub-ice cavity geometry is needed to modeling of ice shelf decay, considered the greatest unknown in modeling of future sea level rise.
  • 20.
    Altimeter measurementsalong ICESat tracks and ATM flight lines in addition use all IceBridge instruments for comprehensive mapping of the entire catchment area and its boundary conditions for ice sheet models ATM, LVIS: ice surface elevation change radar: ice thickness and snow accumulation gravity: water depth beneath floating ice tongue
  • 21.
    ICESat tracks ATMflight tracks 2009 ATM – 2003 ICESat 2009 ATM – 2003 ATM Ice surface velocity: red = fast – blue = slow IceBridge ATM laser altimeter data 100 km
  • 22.
    Right: the deepchannel (blue) mapped by IceBridge is a new discovery. The channel lies about 1 km below sea level, and provides a path for the above-freezing sea water to reach the glacier front. Data is critical for ocean/ice sheet models to predict dynamic response of Pine Island Glacier to warming ocean waters. water depth beneath floating glacier: blue = deep – red = shallow
  • 23.
    Tweets: “ Internationalcollaboration lead to numerous "firsts" during the April 20 sea ice flight” “ DC-8 ... the depth sounder instrument is telling us that we're flying over 1.2 km of ice right now.” Social Networks Twitter Twitpic Blog YouTube
  • 24.
    IceBridge will producea robust, cross-calibrated a 17-year time series of ice sheet and sea ice elevation data together with ICESat, CryoSat-2, and ICESat-2 The 17-year time series will be the definitive resource for predictive models of sea ice and ice sheet behavior In addition to laser altimetry, IceBridge is using the most comprehensive and sophisticated suite of instruments ever flown in polar research to yield an unprecedented three-dimensional view of the Arctic and Antarctic ice sheets, ice shelves, and the sea ice IceBridge is the largest airborne survey of Earth's polar ice ever flown Summary
  • 25.
    Multichannel coherent radardepth sounder for NASA Operation IceBridge Lei Shi, Christopher Allen, John Ledford, Fernando Rodriguez-Morales, William Blake, Ben Panzer, Stephen Prokopiack, Carlton Leuschen, Sivaprasad Gogineni Operation IceBridge: Using instrumented aircraft to bridge the observational gap between ICESat and ICESat-2 Michael Studinger, Lora Koenig, Seelye Martin, John Sonntag Airborne high-altitude, 25m footprint, waveform LiDAR mapping of Greenland and Antarctica Michelle Hofton, Scott Luthcke, Bryan Blair, David Rabine Airborne 3D basal DEM and ice thickness map of Pine Island Glacier William Blake, Lei Shi, Joshua Meisel, Christopher Allen, Prasad Gogineni Operation IceBridge overview and results from aircraft laser altimetry over Greenland and Antarctica William Krabill, John Sonntag, Serdar Manizade, Earl Fredrick, James Yungel 3D Imaging of ice sheets John Paden, Christopher Allen, Prasad Gogineni Ultra-wideband radar measurements of snow thickness over sea ice Ben Panzer, Carl Leuschen, Aqsa Patel, Thorsten Markus, Prasad Gogineni