TEM provides high resolution imaging of materials through transmission of electrons. It can form images of microstructure features and also collect diffraction data from specimen areas. Different imaging modes like bright field and dark field are used depending on whether the main beam or diffracted beams are selected. Precise specimen preparation and instrument alignment are needed for high resolution lattice imaging. TEM allows visualization and characterization of microstructure features at nanometer scales.
The document provides information about scanning electron microscopes (SEMs), including:
- A brief history of the development of SEMs from the 1930s to modern commercial versions.
- An overview of the basic components and working principles of SEMs, such as using an electron beam to scan samples and detect signals to form images.
- Descriptions and diagrams of key parts like the electron gun, electromagnetic lenses, detectors, and vacuum system.
- Explanations of imaging modes and how SEMs can be used for chemical analysis of samples.
- Advantages and limitations of SEM technology.
2018 HM-Transmission electron microscopeHarsh Mohan
The document discusses transmission electron microscopy (TEM). It begins by explaining that TEM uses a beam of electrons to produce high resolution images of specimens. TEM provides higher resolution than optical microscopes because electrons have shorter wavelengths than visible light. The document then describes the basic components and functioning of TEM, including how electromagnetic lenses are used to focus the electron beam onto thin specimen samples and form magnified images. Specimen preparation methods for TEM like chemical fixation and staining are also covered.
The document discusses the scanning tunneling microscope (STM), which uses quantum tunneling to produce atomic-scale images of surfaces. Key points:
- The STM was invented in 1981 and won the Nobel Prize in Physics in 1986. It allows visualization of individual atoms and manipulation of single atoms.
- The STM works by scanning a sharp conductive tip very close to a sample surface. A bias voltage causes electrons to tunnel between tip and surface, producing a current that varies with atomic topography.
- STM can image in various environments, with resolutions down to 0.1 nm laterally and 0.01 nm vertically. It has found many uses including atomic manipulation and etching.
The transmission electron microscope is a very powerful tool for material science. A high energy beam of electrons is shone through a very thin sample, and the interactions between the electrons and the atoms can be used to observe features such as the crystal structure and features in the structure like dislocations and grain boundaries. Chemical analysis can also be performed. TEM can be used to study the growth of layers, their composition and defects in semiconductors. High resolution can be used to analyze the quality, shape, size and density of quantum wells, wires and dots.
Energy dispersive spectrometry (EDS) is a technique used to determine the elemental composition of materials. EDS relies on detecting X-rays emitted from a sample when it is exposed to an electron beam. The X-ray energies are characteristic of elements present in the sample. EDS systems consist of a detector that converts X-ray energies to voltage pulses, a pulse processor that amplifies the signals, and a multi-channel analyzer that sorts the pulses by energy and displays the results as an X-ray spectrum or elemental maps. EDS allows elemental analysis of micrometer-scale sample volumes and provides both qualitative and quantitative chemical information.
The document summarizes the key components and operating principles of a scanning electron microscope (SEM). It describes the electron gun that generates the electron beam, the condenser lenses that focus the beam, the scan coils that scan the beam across the sample, and various detectors that detect signals from the sample. It outlines applications in fields like biology, materials science, and forensics. Advantages include detailed imaging and versatile information from detectors, while disadvantages include high costs and specialized training required.
Secondary ion mass spectrometry (SIMS) is an analytical technique that bombards a sample surface with a primary ion beam, causing charged secondary ions to emit. These secondary ions are then analyzed using mass spectrometry to determine their mass-to-charge ratios. SIMS has high sensitivity and can detect elements down to parts-per-million or parts-per-billion levels. It provides both elemental and molecular composition of solid surfaces with good depth resolution and lateral resolution in the 2-5 nm and 20 nm to 1 μm range, respectively. SIMS finds applications in composition analysis, depth profiling, trace detection in semiconductors, and imaging of surfaces.
This document provides an overview of transmission electron microscopy (TEM). It discusses the history and development of TEM, the theoretical background explaining why electron microscopes were needed, an explanation of TEM instrumentation including the electron gun, condenser lens, objective lens and screen. It also covers TEM sample preparation techniques and the types of information that can be obtained from TEM such as thickness, orientation, composition and bonding states. Finally, it notes some limitations of TEM including small sample size, challenges of interpreting 2D images of 3D samples, potential radiation hazards, and the need for very thin electron transparent samples.
Photoacoustic spectroscopy is a technique that detects the acoustic waves generated through the absorption of modulated electromagnetic radiation in a sample. It can be used to measure the absorption spectrum of both gases and condensed matter. The absorbed radiation is converted to heat, causing temperature and pressure fluctuations that can be detected by a microphone or piezoelectric transducer. This allows for highly sensitive detection of small absorbers. While it can analyze all phases of matter, photoacoustic spectroscopy has limitations for non-gaseous samples and requires the analyte to absorb the laser light used. It has applications in areas like trace gas analysis, textile dyes, and biomedical samples.
This document provides an overview of scanning electron microscopy (SEM). It discusses how SEM works by using a beam of electrons to examine objects at a very fine scale, with greater resolving power than light microscopes. The first SEM debuted in 1938. SEM can provide information about a sample's topography, morphology, composition, and crystal structure. Diagrams show the major components of an SEM, including the electron gun and various detectors. Imaging modes like secondary electron and backscattered electron are described. Applications and limitations of SEM are also summarized.
X-ray photoelectron spectroscopy (XPS) or Electron spectroscopy for chemical analysis (ESCA) is used to investigate the chemistry at the surface of the samples. The basic mechanism behind an XPS instrument is that the photons of a specific energy are used to excite the electronic states of atoms at and just below the surface of the sample.
There are several areas suited to measurement by XPS:
1. Elemental composition
2. Empirical formula determination
3. Chemical state
4. Electronic state
5. Binding energy
6. Layer thickness in the upper portion of surfaces
XPS has many advantages, such as it is is good for identifying all but two elements, identifying the chemical state on surfaces, and is good with quantitative analysis. XPS is capable of detecting the difference in the chemical state between samples. XPS is also able to differentiate between oxidations states of molecules.
XPS has also some limitations, for instance, samples for XPS must be compatible with the ultra high vacuum environment. XPS is limited to measurements of elements having atomic numbers of 3 or greater, making it unable to detect hydrogen or helium. XPS spectra also take a long time to obtain. The use of a monochromator can also reduce the time per experiment.
superparamagnetism and its biological applicationsudhay roopavath
- Superparamagnetism occurs in small ferromagnetic or ferrimagnetic nanoparticles and implies single-domain particle sizes of a few nanometers. The magnetic moments of individual atoms combine to form a giant magnetic moment for the nanoparticle as a whole.
- Below the blocking temperature, nanoparticles behave superparamagnetically, with spontaneous fluctuations of the magnetization direction between θ=00 and θ=1800. Above the blocking temperature, nanoparticles behave paramagnetically.
- Superparamagnetism allows applications in areas like drug delivery, hyperthermia cancer treatment, magnetic resonance imaging, and gene therapy by exploiting the magnetic properties at the nanoscale.
The document discusses scanning probe microscopy (SPM) techniques. It defines local density of states (LDOS) and artifacts. It then discusses the motivation for surface research in electrical engineering due to modern devices' dominance of surface properties. It provides overviews of SPM, atomic force microscopy (AFM), and SPM software. Modes of AFM including contact, friction, tapping, and phase are summarized.
The document discusses methods for determining particle size from SEM micrographs and XRD data. It provides background on SEM, describing how it can be used to obtain particle morphology, size, and other information from micrographs. It also discusses how to measure particle size manually from micrographs and using ImageJ software. For XRD, it describes how the Scherrer equation can be used to calculate crystallite size from peak broadening in XRD patterns. Examples of SEM micrographs and XRD patterns are provided to illustrate these techniques.
The document provides information about scanning electron microscopes (SEMs). It describes that SEMs produce images of samples by scanning them with a focused beam of electrons, and electrons interact with atoms in the sample providing information about surface topography and composition. Key components of SEMs are electron guns, condenser lenses, objective apertures, scan coils, detectors, and vacuum chambers. SEMs have various applications in science and industry for examining surface features, fractures, and compositions at high magnifications.
Atomic force microscopy (AFM) is a scanning probe microscopy technique capable of producing high-resolution topographical images of a sample surface. AFM works by scanning a sharp tip over a surface and measuring the force between the tip and sample using a laser beam and photodetector. This force is characterized by Hooke's law and depends on the tip deflection and spring constant. AFM can operate in contact, non-contact, or tapping mode and is used across many fields due to its ability to image both hard and soft materials with nanoscale resolution.
The document discusses the transmission electron microscope (TEM). It begins by providing a brief history and overview, explaining that TEM uses electrons rather than light to image specimens. It then describes the key components and working principles of TEM, including how it produces higher resolution images than light microscopes due to electrons' lower wavelength. Finally, it outlines some common applications of TEM in fields like materials science, biology, and manufacturing, and notes advantages like powerful magnification but also disadvantages like high costs and specialized training needs.
Scanning tunneling microscopy (STM) is a technique used to image surfaces at the atomic level. It was developed in 1981 by Gerd Binnig and Heinrich Rohrer at IBM, based on the concept of quantum tunneling. The STM works by using a scanning tip, typically made of tungsten, which is brought very close to the sample surface. A bias is applied between the tip and sample, allowing electrons to tunnel through the vacuum gap. The tunneling current depends on factors like the voltage and position of the tip relative to the sample, enabling atomic resolution images to be produced. Piezoelectric materials are crucial for providing precise movement of the tip in the angstrom scale needed. STM opened
TEM is a type of electron microscope that uses electron beams to produce magnified images of samples. TEMs can magnify up to 1 million times, allowing observation of ultrafine cell structures. Sample preparation is required to make specimens thin enough for electrons to pass through. TEMs are very expensive, ranging from $95,000 to over $100,000, but provide high resolution imaging useful for fields like nanotechnology, biology and materials science.
Optical microscopy was invented by Robert Hooke in 1665 and uses optical light to magnify samples for examination. Key definitions are resolution, the ability to see two adjacent objects separately, and magnification, the ratio of the image produced to the actual sample dimensions. Optical microscopy is used to examine cervical smears, breast cancer imprints, frozen and paraffin sections, and culture cover slips. Stains or fluorescent labels are required to visualize transparent cells and tissues. Confocal microscopes focus and detect light for very sharp 3D images, while live cell imaging uses green fluorescent protein.
Focused ion beam (FIB) systems use a finely focused beam of gallium ions to image and mill samples at the micrometer and nanometer scale. FIB works similarly to scanning electron microscopy but uses ions instead of electrons. Gallium liquid metal ion sources are most common and produce beams with nanometer spot sizes. FIB allows for high resolution imaging as well as precise site-specific milling or deposition through ion beam induced deposition of materials like tungsten.
The document discusses the scanning electron microscope (SEM), including its history, principle of operation, key components, and applications. The SEM works by using an electron beam to scan the surface of a sample. Electrons emitted from the sample are detected to form an image. Key components include the electron gun, condenser lenses, objective aperture, scan coils, chamber, detectors, and vacuum system. SEMs provide 3D imaging and compositional analysis of samples and are used across various scientific and industrial fields.
TEM transmission electron microscopy in depthneeraj952329
Transmission electron microscopy (TEM) uses electrons instead of light to image materials at the nanoscale. Key components of a TEM include an electron gun, condenser lenses, a specimen holder, an objective lens that forms the image, and projector lenses that magnify the image. TEMs can form images of a specimen's internal structure or collect diffraction patterns from which the specimen's crystal structure can be determined. Specimen preparation often involves thinning to less than 100 nm thickness. TEM provides several contrast mechanisms and imaging modes for revealing details about a material's microstructure, defects, and composition.
TEM uses electron beams to image materials at high magnifications and resolutions. It works by transmitting electrons through a thin sample and forming an image from the electrons. Different imaging modes like bright field and dark field are used by selecting certain electron signals using an aperture. Electron diffraction is also possible, allowing analysis of crystal structures and orientations. Sample preparation into thin foils is important. TEM can reveal details of microstructures like defects, phases, and interfaces.
Transmission Electron Microscope_Lecture1.pptxBagraBay
The transmission electron microscope can be used to image microstructural features at high magnifications, perform elemental analysis, and determine crystal structures. Samples must be thinly sectioned or ion milled to be electron transparent. Imaging techniques like bright field and dark field are used to reveal structural features based on diffraction contrast. Selected area diffraction patterns can be indexed to identify crystal structures and orientations. The transmission electron microscope thus provides valuable microscopic and crystallographic information about materials at high resolution.
The document provides information about various electron microscopy techniques, including transmission electron microscopy (TEM), scanning transmission electron microscopy (STEM), and analytical electron microscopy (AEM). It discusses the development of TEM since its invention in the 1930s. It describes various imaging modes in TEM and STEM such as bright field, dark field, high-resolution, and techniques that provide elemental composition like energy-dispersive X-ray spectroscopy (EDXS) and electron energy loss spectroscopy (EELS). The document is an introduction to electron microscopy methods.
Tunneling electron Microscopy, Scanning electron microscopyelminehtsegahun2
- The document discusses transmission electron microscopy (TEM), providing details about its essential parts, operation principles, imaging modes, diffraction techniques, and applications.
- TEM uses electron beams to image nanoscale structures, with key components including an electron gun, condenser lenses, specimen holder, objective lens, and viewing screen. Specimens must be very thin to transmit electrons.
- Imaging modes include bright field, dark field, and high resolution, which produce different image contrasts. Diffraction techniques like selected area diffraction are also described.
- Applications involve characterizing materials structures, layers, interfaces, and chemical composition at the nanoscale. TEM provides both imaging and diffraction/crystallographic information
Transmission electron microscope, high resolution tem and selected area elect...Nano Encryption
The document provides an overview of the transmission electron microscope (TEM). It discusses key components of the TEM including the electron gun, condenser lenses, objective lens, and vacuum system. The document explains that TEM uses electromagnetic lenses to focus a beam of electrons onto a thin specimen, and forms an image from the interaction of electrons transmitted through the specimen. TEM allows much higher magnifications than light microscopes, with the ability to image at the atomic scale.
The document provides an overview of the transmission electron microscope (TEM). It discusses key components of the TEM including the electron gun, condenser lenses, objective lens, and vacuum system. The document explains that TEM uses electromagnetic lenses to focus a beam of electrons onto a thin specimen, and forms an image from the interaction of electrons transmitted through the specimen. TEM allows higher magnification and resolution than light microscopes, and can be used to investigate the morphology, structure, and composition of materials down to the atomic scale.
This document provides information about light propagation through optical fibers. It begins by defining an optical fiber as a cylindrical waveguide made of glass that uses total internal reflection to transmit light. It then discusses the fiber's core and cladding layers and the conditions needed for total internal reflection. The key points covered include:
- Light propagation is guided through the fiber core by total internal reflection at the core-cladding interface.
- Only rays entering the fiber core within the acceptance angle will continue propagating through total internal reflection.
- Electromagnetic mode theory is needed to fully understand light propagation in fibers. Discrete modes exist that are solutions to Maxwell's equations.
- The evanescent field that penetrates the cl
This document provides an introduction to electron microscopy. It begins with fundamental concepts and then discusses the construction of transmission and scanning electron microscopes. It explains key differences between electron microscopes and optical microscopes, such as electrons having no visible wavelength. The document compares the similarities and differences between EM and LM, such as both having illumination, specimen, and imaging systems, but EM using magnetic lenses. It discusses electron-specimen interactions that EM can detect such as backscattered electrons, secondary electrons, Auger electrons, X-rays, and diffraction patterns. Finally, it covers high resolution EM and examples of discoveries it enabled.
Transmission electron microscopy has evolved significantly since its invention in the 1930s. Some key milestones include:
- 1931: Max Knoll and Ernst Ruska built the first TEM.
- 1986: Ruska received the Nobel Prize for his invention of the TEM.
- Developments since have led to higher resolution microscopes, new imaging modes like scanning TEM, and integration of analytical techniques like electron diffraction and spectroscopy. Today TEMs can image structures as small as single atoms.
This document discusses different types of electron microscopy techniques. It begins by explaining the need for high resolution in electron microscopy due to the small scale of samples. Different electron microscopy techniques are then described, including transmission electron microscopy (TEM), scanning electron microscopy (SEM), and scanning tunneling microscopy (STM). The document focuses on SEM, explaining how it works by scanning a sample with a beam of electrons to produce signals containing information about the sample's surface topography and composition. Sample preparation methods and interactions between the electron beam and sample are also outlined.
Electron microprobe analysis (EMPA) is a technique that uses a focused electron beam to determine the elemental composition of materials at the micrometer scale. It works by generating characteristic x-rays from sample atoms when bombarded by electrons. These x-rays can then be analyzed using either wavelength dispersive spectrometry (WDS) or energy dispersive spectrometry (EDS) to identify and quantify elemental composition. EMPA provides highly accurate micrometer-scale compositional data but requires standards for quantification and corrections due to factors like excitation volume.
This document discusses various characterization techniques for nanoparticles. It describes microscopy methods like scanning electron microscopy (SEM), transmission electron microscopy (TEM), and scanning tunneling microscopy (STM) that can be used to determine nanoparticle size, shape, composition and crystalline structure at high resolution. Spectroscopy methods like X-ray diffraction (XRD), small angle X-ray scattering (SAXS), X-ray photoelectron spectroscopy (XPS), UV-vis spectroscopy, and Fourier transform infrared spectroscopy (FT-IR) are also outlined for analyzing nanoparticle properties. The key techniques of SEM, TEM, XRD and SAXS are then explained in more detail regarding their basic principles and what types of nanoparticle information can be obtained
Basics of radiation and production of x raysdbc9427
Electromagnetic radiation, including x-rays, is produced when electrons are accelerated and decelerate, such as when they collide with the target material in an x-ray tube. In an x-ray tube, a stream of electrons is emitted from a heated cathode and accelerated toward the anode. When the electrons collide with the anode, they cause the emission of x-rays. This results in a spectrum of x-rays known as bremsstrahlung radiation. Some electrons may also eject inner shell electrons from the anode atoms, producing characteristic x-ray lines. Modern x-ray tubes use a rotating anode to dissipate heat and allow higher outputs.
Optical fiber communication Part 1 Optical Fiber FundamentalsMadhumita Tamhane
Optical fiber systems grew from combination of semiconductor technology, which provided necessary light sources and photodetectors and optical waveguide technology. It has significant inherent advantages over conventional copper systems- low transmission loss, wide BW, light weight and size, immunity to interferences, signal security to name a few. One principle characteristic of optical fiber is its attenuation as a function of wavelength. Hence it is operated in two major low attenuation wavelength windows 800-900nm and 1100-1600nm . Light travels inside optical fiber waveguide on principle of total internal reflection. Fiber is available as single mode and multiple mode, step index and graded index depending on applications and expenditures. Principle of fiber can be understood by ray theory or mode theory. ...
Optical fiber communication Part 1 Optical Fiber Fundamentals
Tem
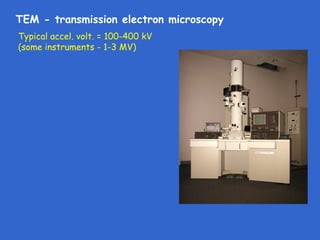
1. TEM - transmission electron microscopy
Typical accel. volt. = 100-400 kV
(some instruments - 1-3 MV)
Spread broad probe across
specimen - form image from
transmitted electrons
Diffraction data can be obtained
from image area
Many image types possible (BF, DF,
HR, ...) - use aperture to select
signal sources
Main limitation on resolution -
aberrations in main imaging lens
Basis for magnification - strength
of post- specimen lenses
2. TEM - transmission electron microscopy
Instrument components
Electron gun (described previously)
Condenser system (lenses &
apertures for controlling
illumination on specimen)
Specimen chamber assembly
Objective lens system (image-
forming lens - limits resolution;
aperture - controls imaging
conditions)
Projector lens system (magnifies
image or diffraction pattern onto
final screen)
3. TEM - transmission electron microscopy
Instrument components
Electron gun (described previously)
Condenser system (lenses &
apertures for controlling
illumination on specimen)
Specimen chamber assembly
Objective lens system (image-
forming lens - limits resolution;
aperture - controls imaging
conditions)
Projector lens system (magnifies
image or diffraction pattern onto
final screen)
4. TEM - transmission electron microscopy
Examples
Matrix - β'-Ni2AlTi
Precipitates - twinned L12 type γ'-Ni3Al
5. TEM - transmission electron microscopy
Examples
Precipitation in an
Al-Cu alloy
6. TEM - transmission electron microscopy
Examples
dislocations SiO2 precipitate
in superalloy particle in Si
7. TEM - transmission electron microscopy
Examples
lamellar Cr2N
precipitates in
stainless steel
electron
diffraction
pattern
8. TEM - transmission electron microscopy
Specimen preparation
Types
replicas
films as is, if thin enough
slices ultramicrotomy
powders, fragments crush and/or disperse on carbon film
foils
Foils
3 mm diam. disk
very thin (<0.1 - 1 micron - depends on material, voltage)
9. TEM - transmission electron microscopy
Specimen preparation
Foils
3 mm diam. disk
very thin (<0.1 - 1 micron - depends on material, voltage)
mechanical thinning (grind)
chemical thinning (etch)
ion milling (sputter)
examine region
around perforation
10. TEM - transmission electron microscopy
Diffraction
Use Bragg's law - λ = 2d sin θ
But λ much smaller
(0.0251Å at 200kV)
if d = 2.5Å, θ = 0.288°
11. TEM - transmission electron microscopy
Diffraction
2θ ≈ sin 2θ = R/L
specimen
λ = 2d sin θ ≈ d (2θ)
R/L = λ/d
Rd = λL
image plane
L is "camera length"
λL is "camera constant"
12. TEM - transmission electron microscopy
Diffraction
Get pattern of spots around transmitted beam from one grain (crystal)
13. TEM - transmission electron microscopy
Diffraction
Symmetry of diffraction pattern reflects
symmetry of crystal around beam direction
Example:
6-fold in hexagonal, 3-fold in cubic
[111] in cubic [001] in hexagonal
Why does 3-fold diffraction pattern look hexagonal?
14. TEM - transmission electron microscopy
Diffraction
P cubic reciprocal lattice
layers along [111] direction
Note: all diffraction
patterns are
centrosymmetric,
even if crystal structure l = +1 level
is not centrosymmetric
(Friedel's law)
Some 0-level patterns 0-level
thus exhibit higher
rotational symmetry than
structure has
l = -1 level
15. TEM - transmission electron microscopy
Diffraction
Cr23C6 - F cubic Ni2AlTi - P cubic
a = 10.659 Å a = 2.92 Å
16. TEM - transmission electron microscopy
Diffraction - Ewald construction
Remember crystallite size?
when size is small, x-ray reflection is broad
To show this using Ewald construction, reciprocal lattice points
must have a size
17. TEM - transmission electron microscopy
Diffraction - Ewald construction
Many TEM specimens are thin in one direction - thus, reciprocal
lattice points elongated in one direction to rods - "relrods"
Also, λ very small, 1/λ very large
Only zero level in
position to reflect
Ewald
sphere
18. TEM - transmission electron microscopy
Indexing electron diffraction patterns
Measure R-values for at least 3 reflections
19. TEM - transmission electron microscopy
Indexing electron diffraction patterns
20. TEM - transmission electron microscopy
Indexing electron diffraction patterns
Index other reflections by vector sums, differences
Next find zone axis from cross product of any two (hkl)s
(202) x (220) ——> [444] ——> [111]
21. TEM - transmission electron microscopy
Indexing electron diffraction patterns
Find crystal system, lattice parameters, index pattern, find zone axis
ACTF!!! Note symmetry - if cubic, what
direction has this symmetry (mm2)?
Reciprocal lattice unit cell
for cubic lattice is a cube
22. TEM - transmission electron microscopy
Why index?
Detect epitaxy
Orientation relationships at grain boundaries
Orientation relationships between matrix & precipitates
Determine directions of rapid growth
Other reasons
23. TEM - transmission electron microscopy
Polycrystalline regions
polycrystalline BaTiO3
spotty Debye rings
24. TEM - transmission electron microscopy
Indexing electron diffraction patterns - polycrystalline regions
Same as X-rays – smallest ring - lowest θ - largest d
Hafnium ( 铪 )
25. TEM - transmission electron microscopy
Indexing electron diffraction patterns - comments
Helps to have some idea what phases present
d-values not as precise as those from X-ray data
Systematic absences for lattice centering and
other translational symmetry same as for X-rays
Intensity information difficult to interpret
26. TEM - transmission electron microscopy
Sources of contrast
Diffraction contrast - some grains diffract more strongly than
others; defects may affect diffraction
Mass-thickness contrast - absorption/
scattering. Thicker areas or mat'ls w/
higher Z are dark
27. TEM - transmission electron microscopy
Bright field imaging
Only main beam is used. Aperture in back focal plane blocks
diffracted beams
Image contrast mainly due to subtraction of intensity from the
main beam by diffraction
28. TEM - transmission electron microscopy
Bright field imaging
Only main beam is used. Aperture in back focal plane blocks
diffracted beams
Image contrast mainly due to subtraction of intensity from the
main beam by diffraction
29. TEM - transmission electron microscopy
Bright field imaging
Only main beam is used. Aperture in back focal plane blocks
diffracted beams
Image contrast mainly due to subtraction of intensity from the
main beam by diffraction
30. TEM - transmission electron microscopy
Bright field imaging
Only main beam is used. Aperture in back focal plane blocks
diffracted beams
Image contrast mainly due to subtraction of intensity from the
main beam by diffraction
31. TEM - transmission electron microscopy
What else is in the image?
Many artifacts
surface films
local contamination
differential thinning
others
Also get changes in image because of
annealing due to heating by beam
32. TEM - transmission electron microscopy
Dark field imaging
Instead of main
beam, use a
diffracted beam
Move aperture to
diffracted beam
or tilt incident
beam
33. TEM - transmission electron microscopy
Dark field imaging
Instead of main beam, use a diffracted beam
Move aperture to diffracted beam or tilt incident beam
strain field contrast
34. TEM - transmission electron microscopy
Dark field imaging
Instead of main beam, use a diffracted beam
Move aperture to diffracted beam or tilt incident beam
35. TEM - transmission electron microscopy
Lattice imaging
Use many diffracted beams
Slightly off-focus
Need very thin specimen region
Need precise specimen alignment
See channels through foil
Channels may be light or dark in image
Usually do image simulation to
determine features of structure
铝 钌 铜 合金
36. TEM - transmission electron microscopy
Examples
M23X6 (figure at top
left).
L21 type β'-Ni2AlTi
(figure at top center).
L12 type twinned γ'-
Ni3Al (figure at bottom
center).
L10 type twinned NiAl
martensite (figure at
bottom right).