


![©JYRP2012 Page 19
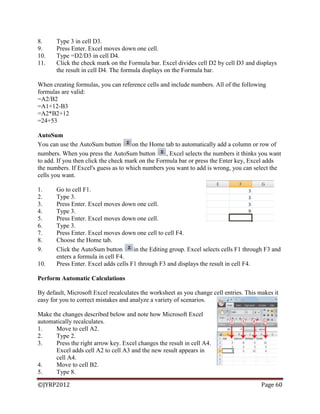
Fig. 2.1 Comparing RAM and ROM
RAM ROM
Needs power Does not need power
Data can be changed Data can‘t be changed
Data will be lost if power is turned off Data will not be lost if power is turned off
Volatile Non-volatile
Stores data currently being processed Fixed instructions is stored
[Source: Lubbe and Benson, 2010:20)
Units of Storage
The memory of all digital computers is two-state (bi-stable) devices. Computers operate using a
binary number system – and therefore use binary digits (bits). Bits have only two values by 0
and 1. A bit is the smallest unit of storage in a computer.
The amount of data and instructions that can be stored in the memory of a computer or secondary
storage is measured in bytes.
A byte is made up of a combination of eight (8) bits and has the storage power to represent one
character (a character is a letter or symbol or punctuation mark or blank space).
Units of Storage
1 byte
1 kilobyte (K)
1 megabyte (MB)
1 gigabyte (GB)
1 terabyte (TB)
8 bits
1024 bytes
1000 kilobytes (approx. 1 million bytes)
1000 megabytes (approx. 1 billion bytes)
1000 gigabytes (approx. 1 trillion bytes)
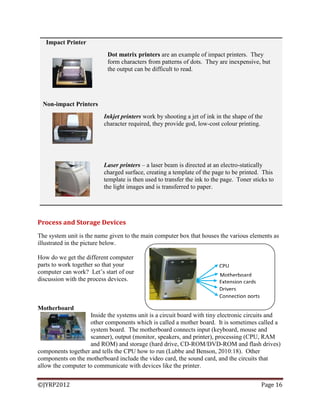
Secondary Storage devices
PCs use a simple method of designating disk drives to store data. These drives are assigned
letters of the alphabet.
A Drive Floppy drive. Still found in older computers
C Drive Internal hard drive (hard disk drive) situated inside the system case.
D Drive Usually the CD-ROM/DVD-ROM drive
E Drive Usually use for any other disks, such as CD-writer, USB flash drive, external
hard drive, etc.
[Source: Lubbe and Benson, 2010:23]
Data and information stored on a permanent basis for later use. Secondary storage is cheaper to
purchase and access. Hard disks, Zip drives, Optical disks (CD‘s and DVD‘s) are all examples
of secondary storage.](https://image.slidesharecdn.com/seminarworkbook2012-130730074853-phpapp02/85/Technology-in-Education-Workbook-19-320.jpg)


The document is a comprehensive guide on the role of technology and media in education, covering topics such as instructional media, learning theories, and the integration of various technologies like word processing, spreadsheets, and internet tools. It emphasizes the importance of adapting teaching methods to accommodate different learning styles and highlights the benefits of using technology to foster student engagement and critical thinking. Additionally, it provides practical strategies for implementing educational technology effectively in the classroom.


![Working capital [www.writekraft.com]](https://cdn.slidesharecdn.com/ss_thumbnails/workingcapital-180724074505-thumbnail.jpg?width=640&height=640&fit=bounds)


