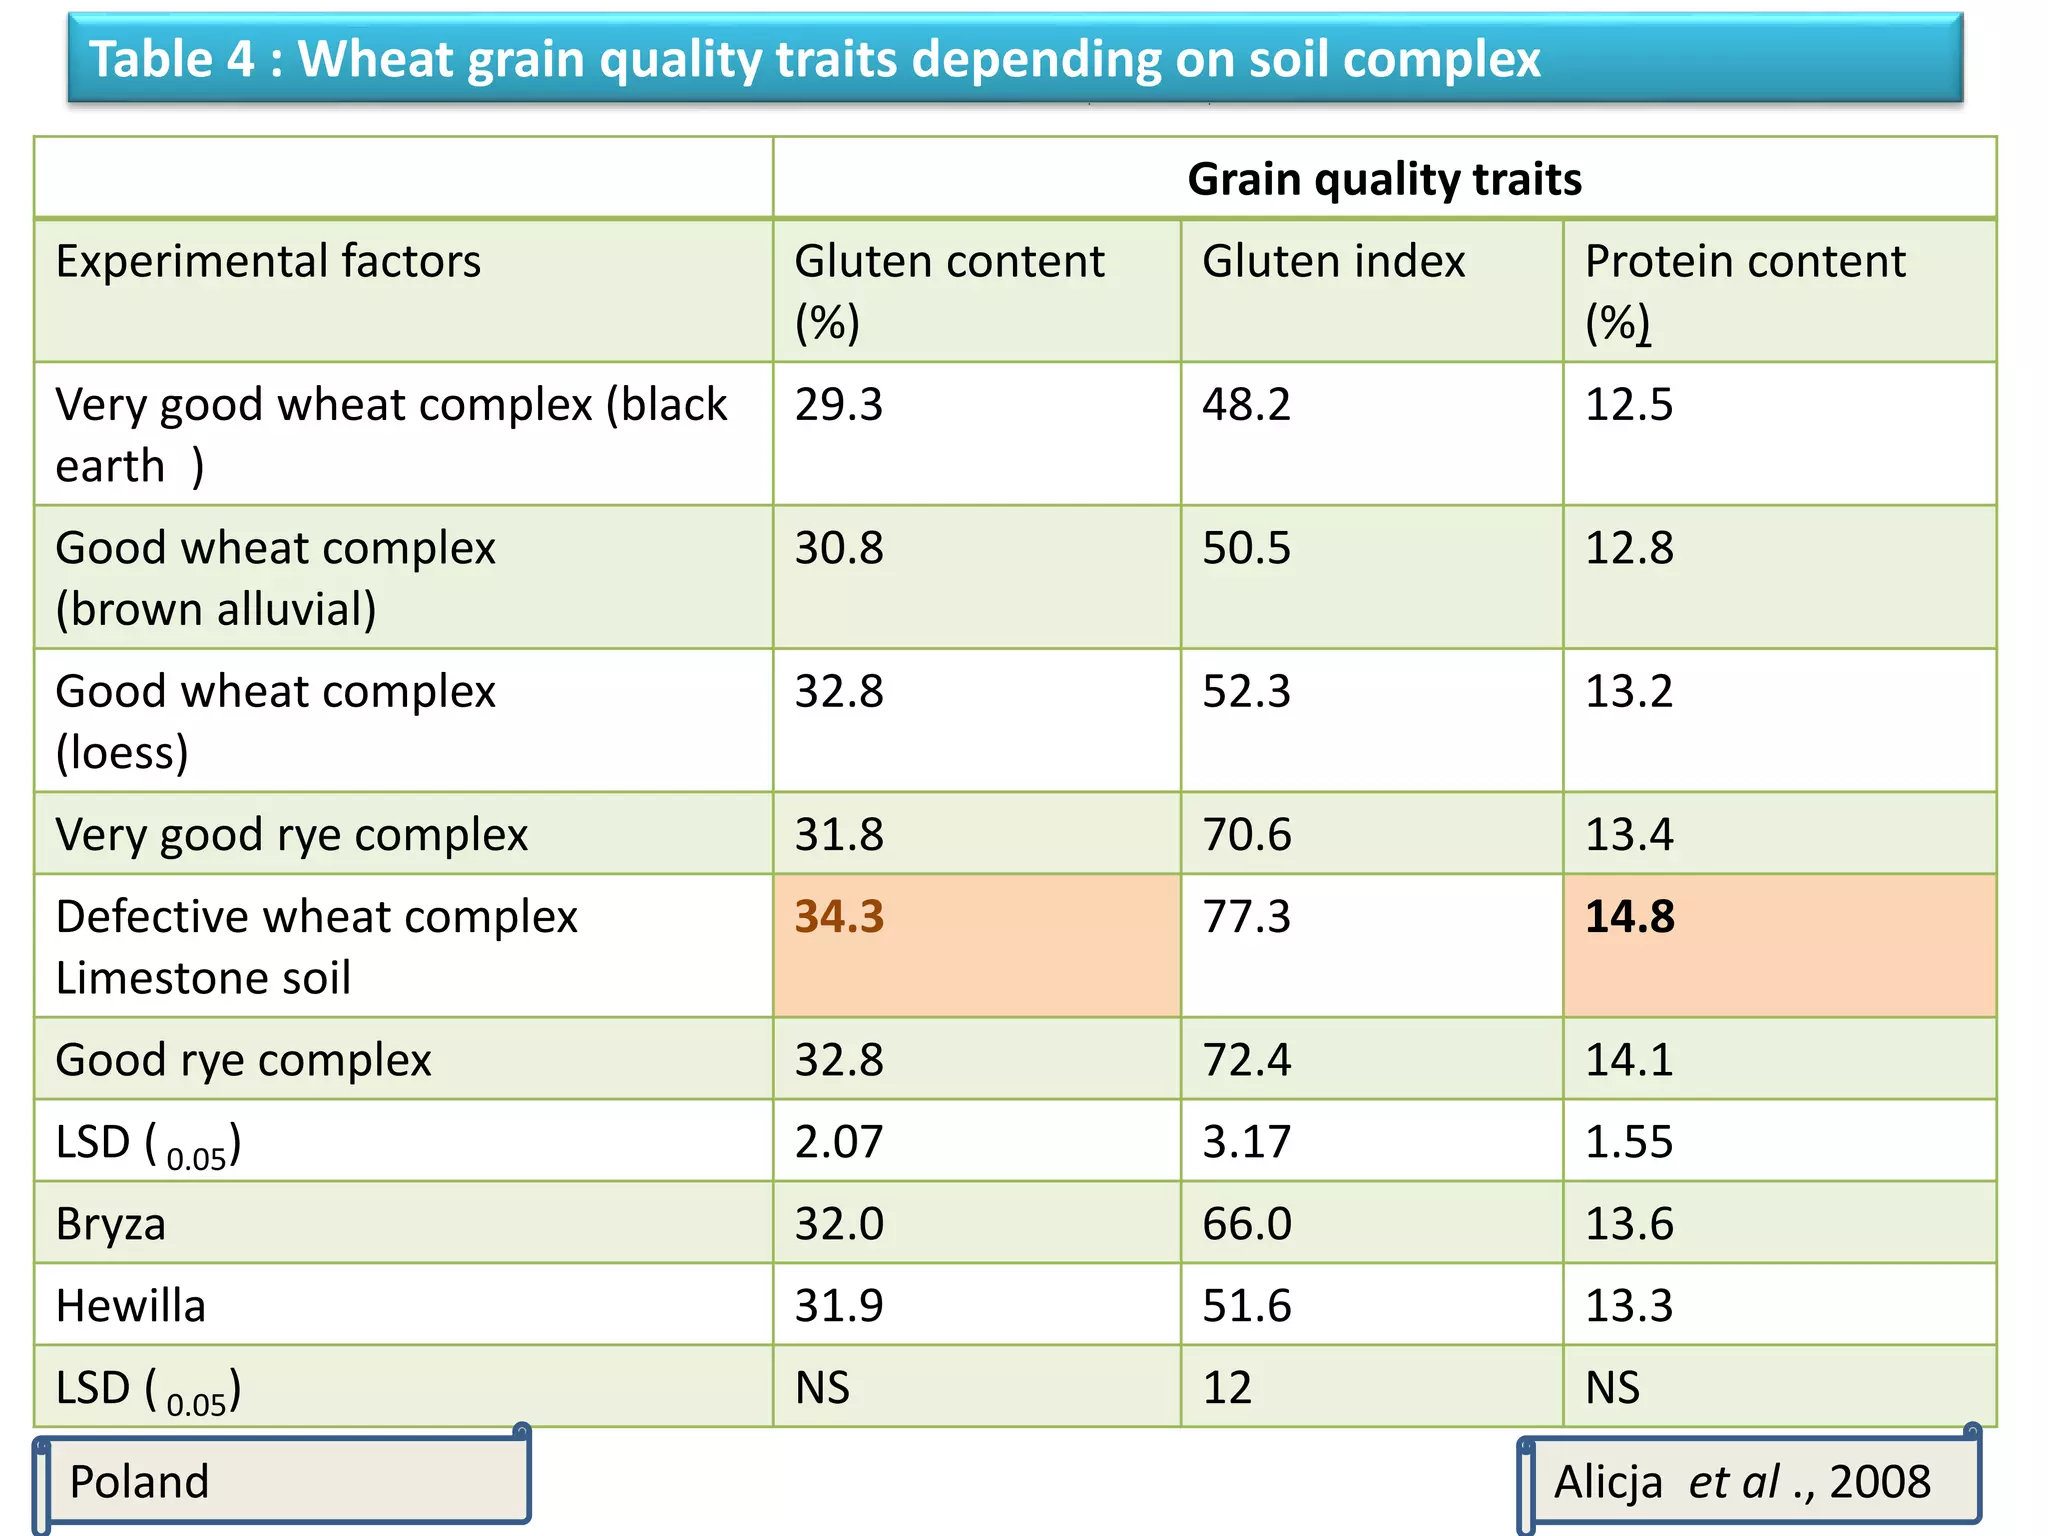
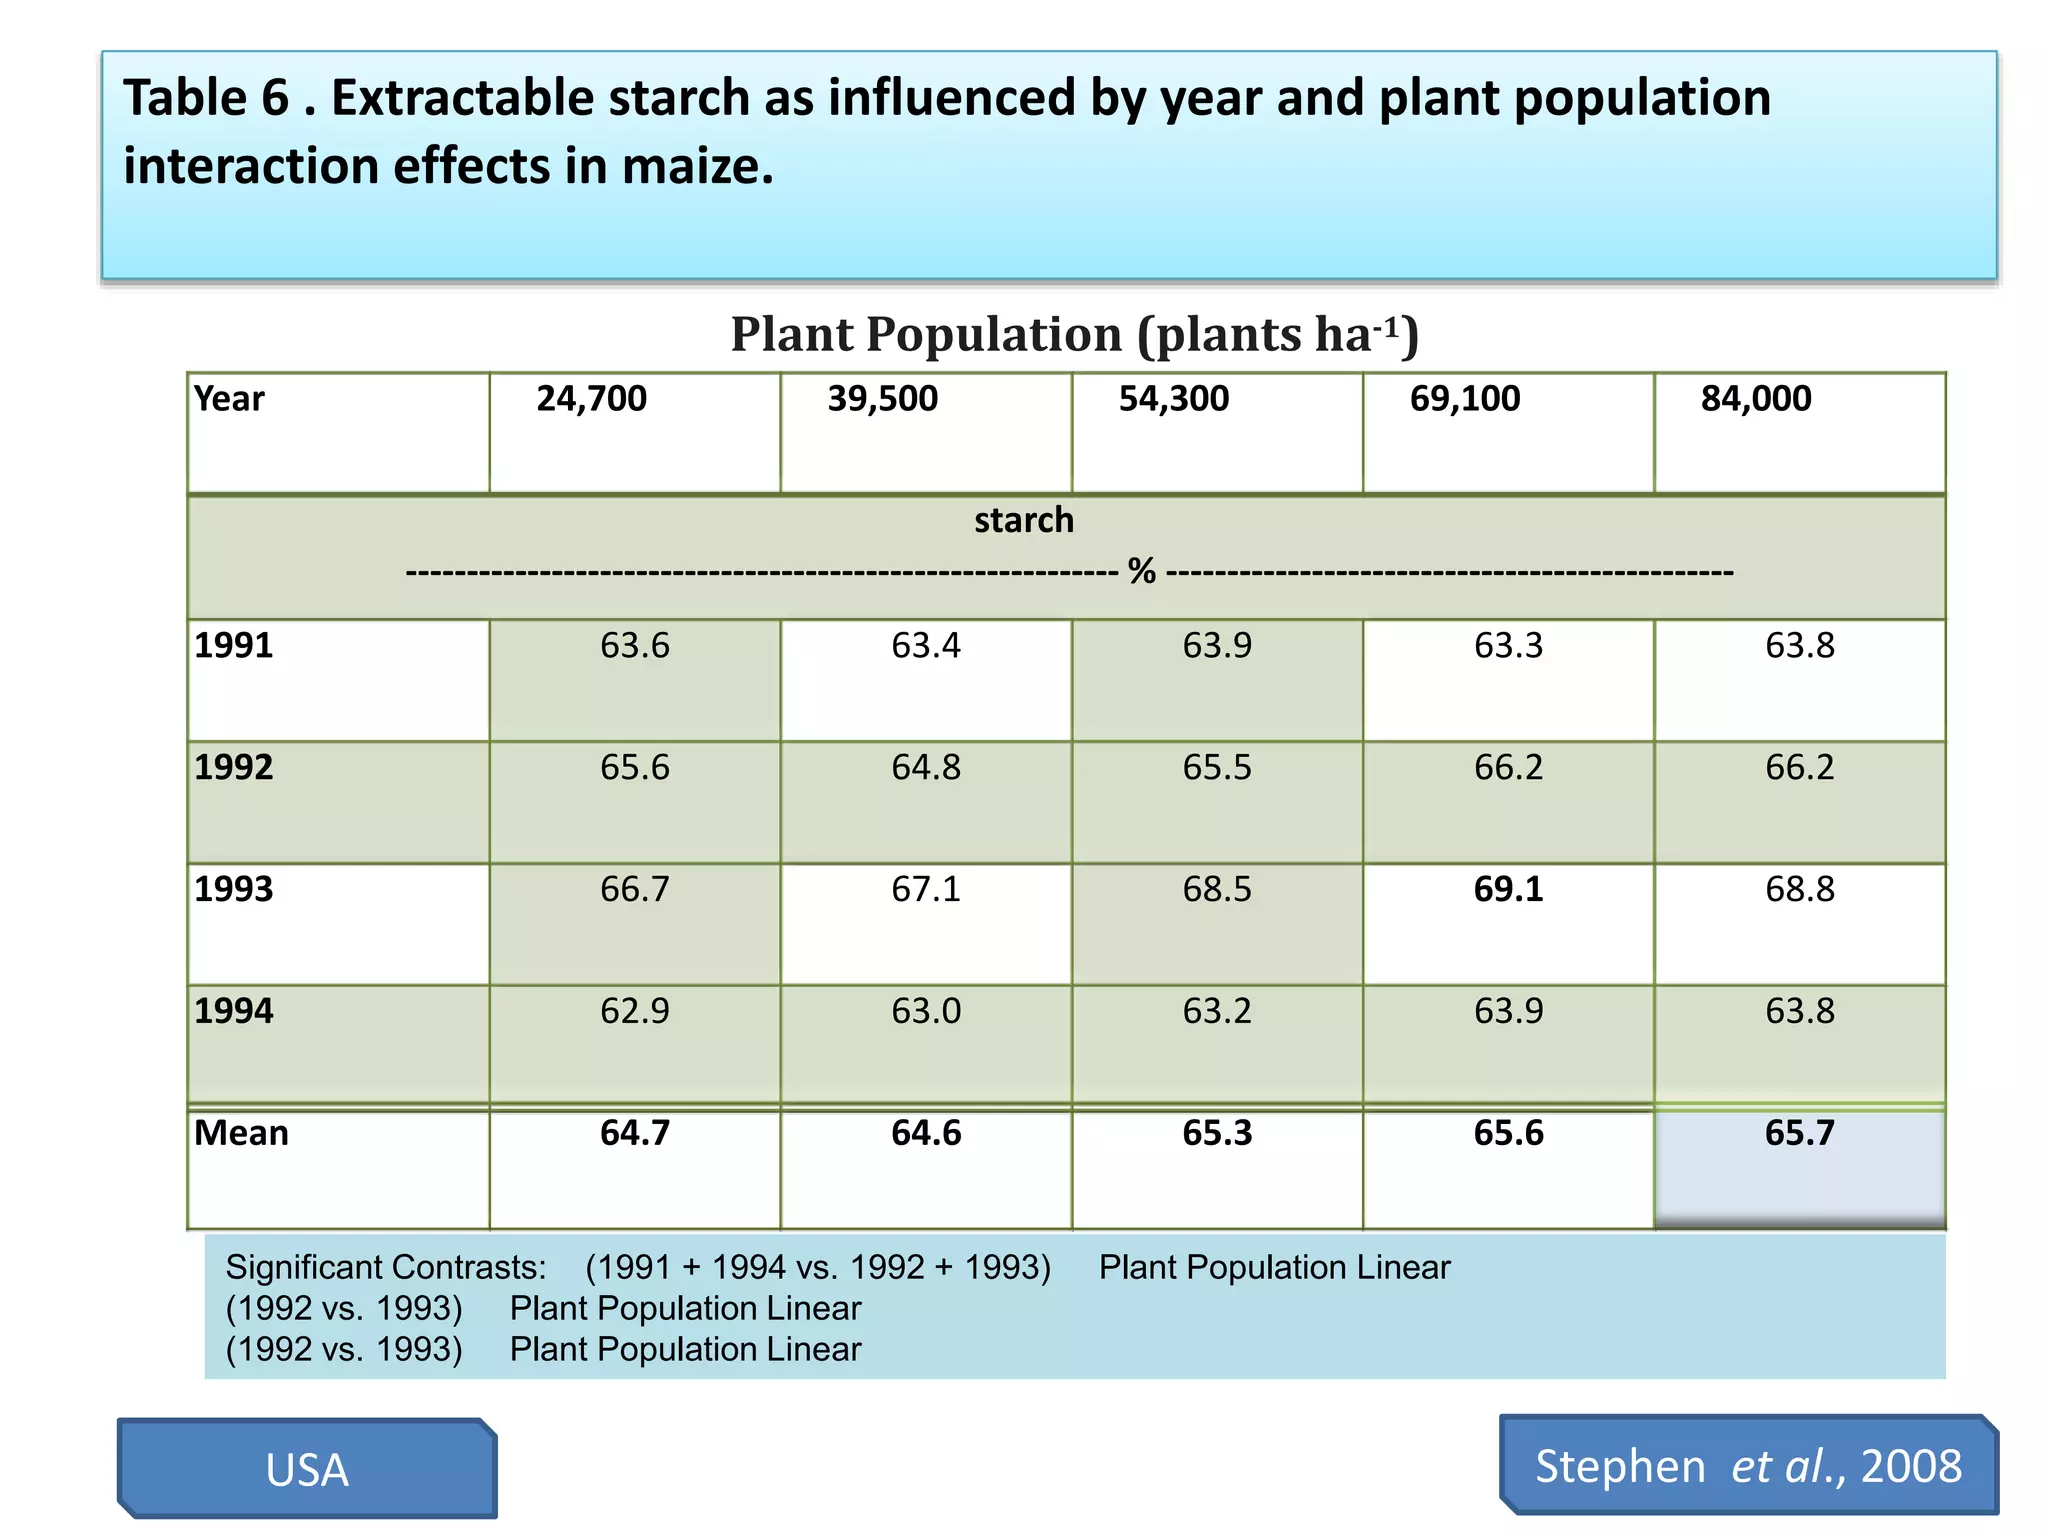
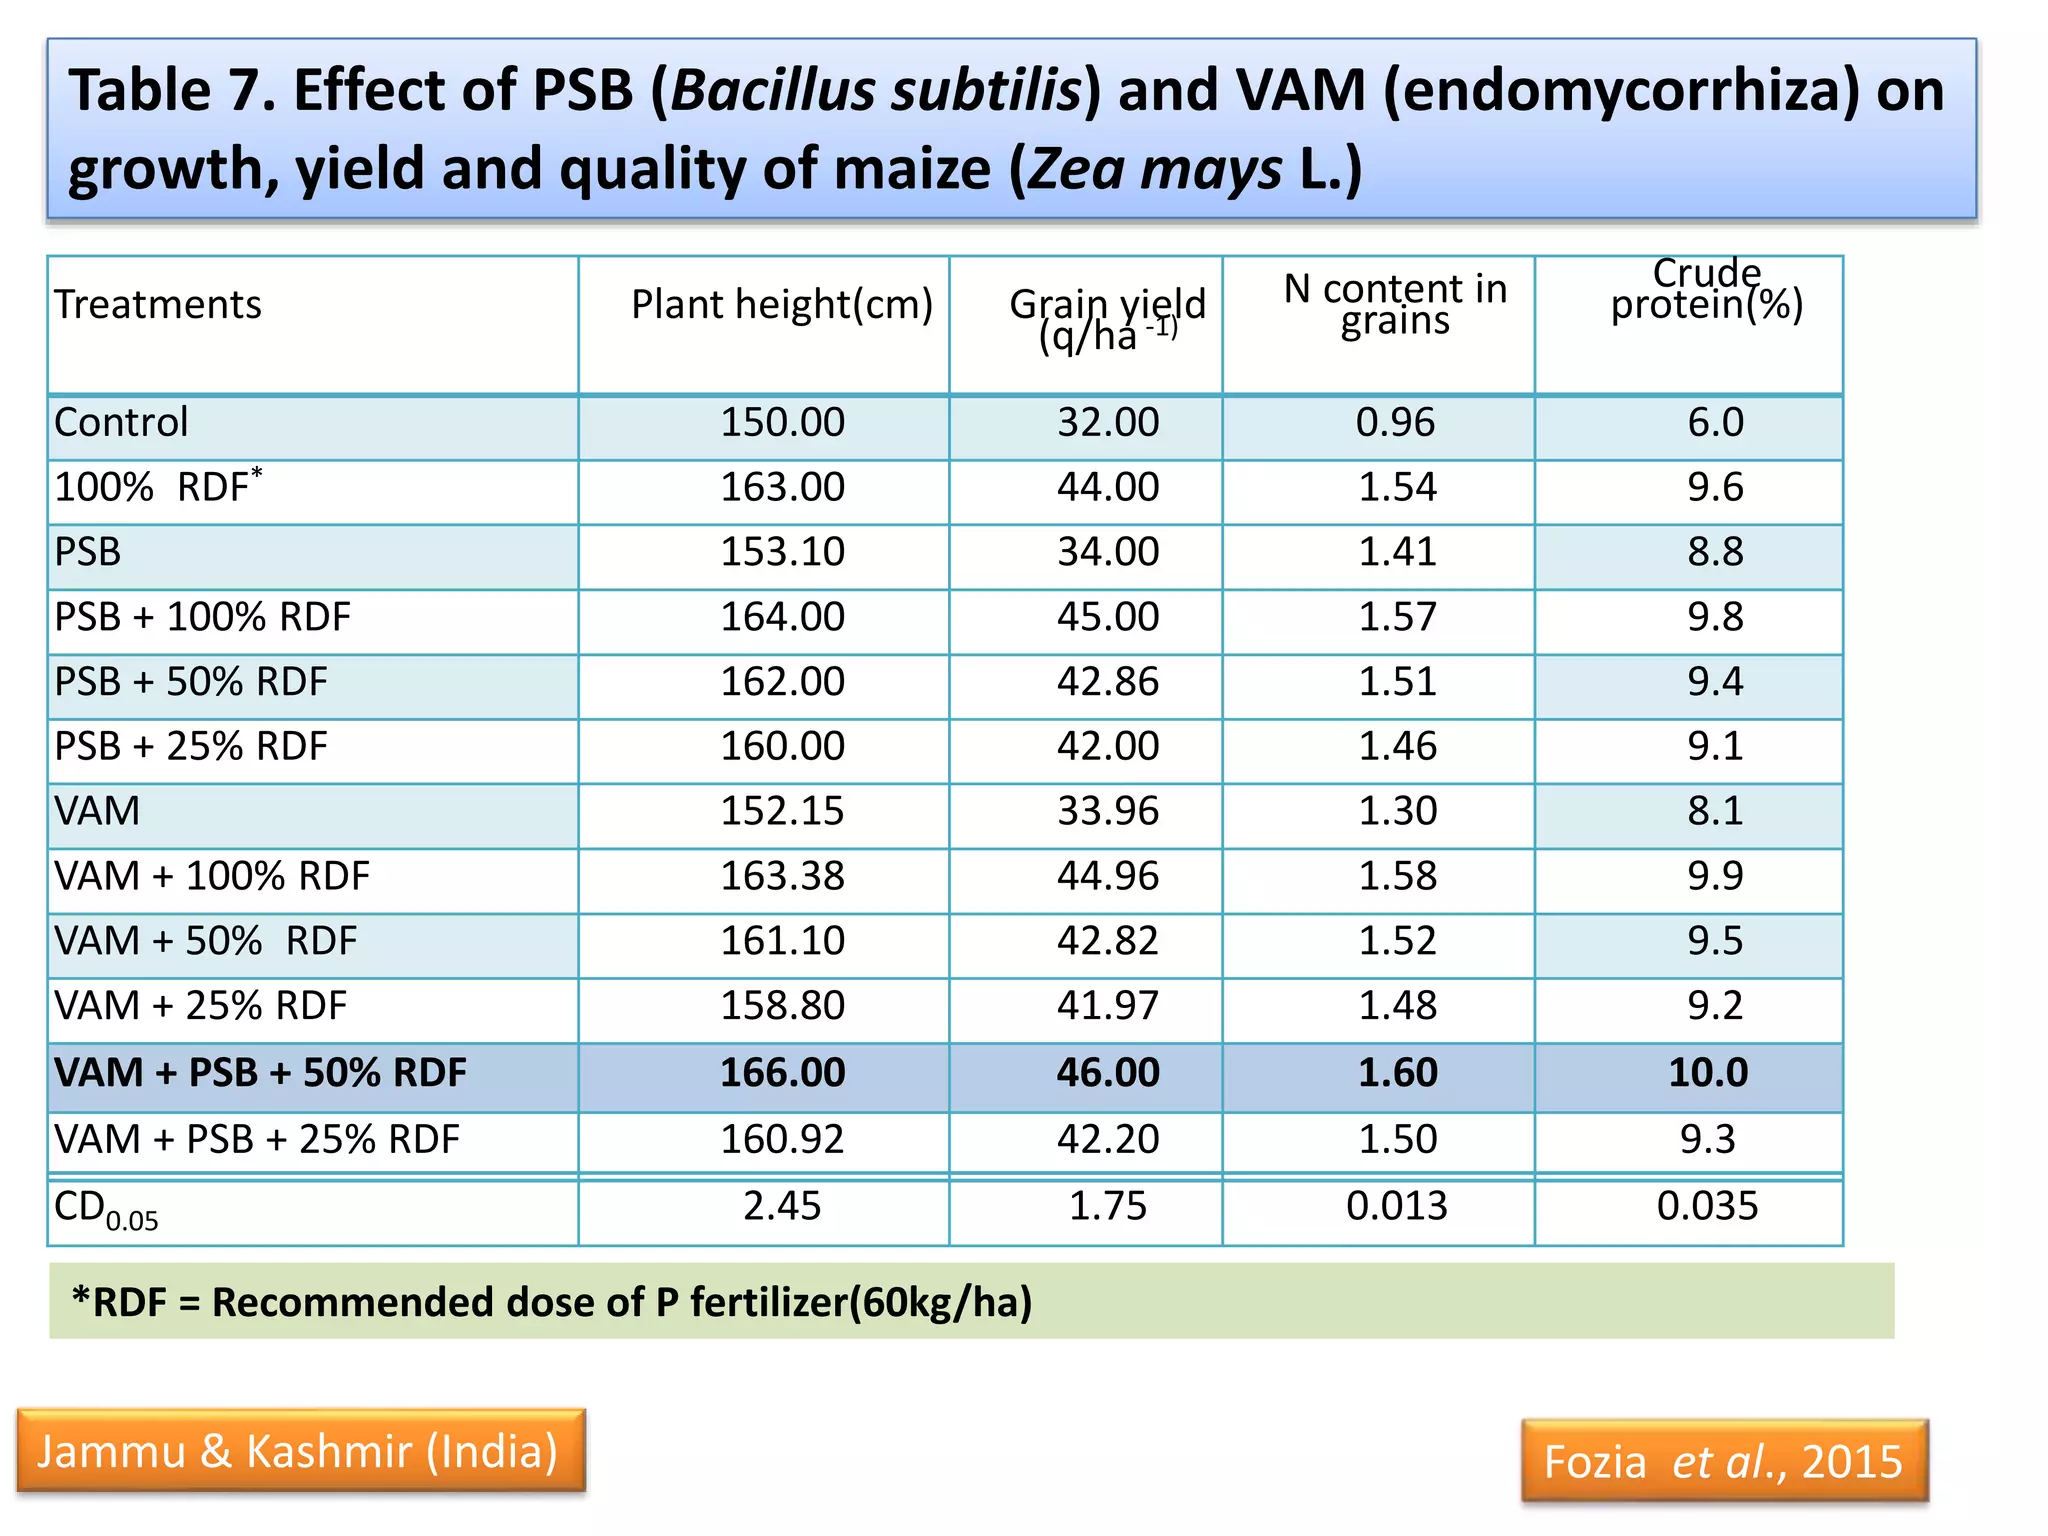
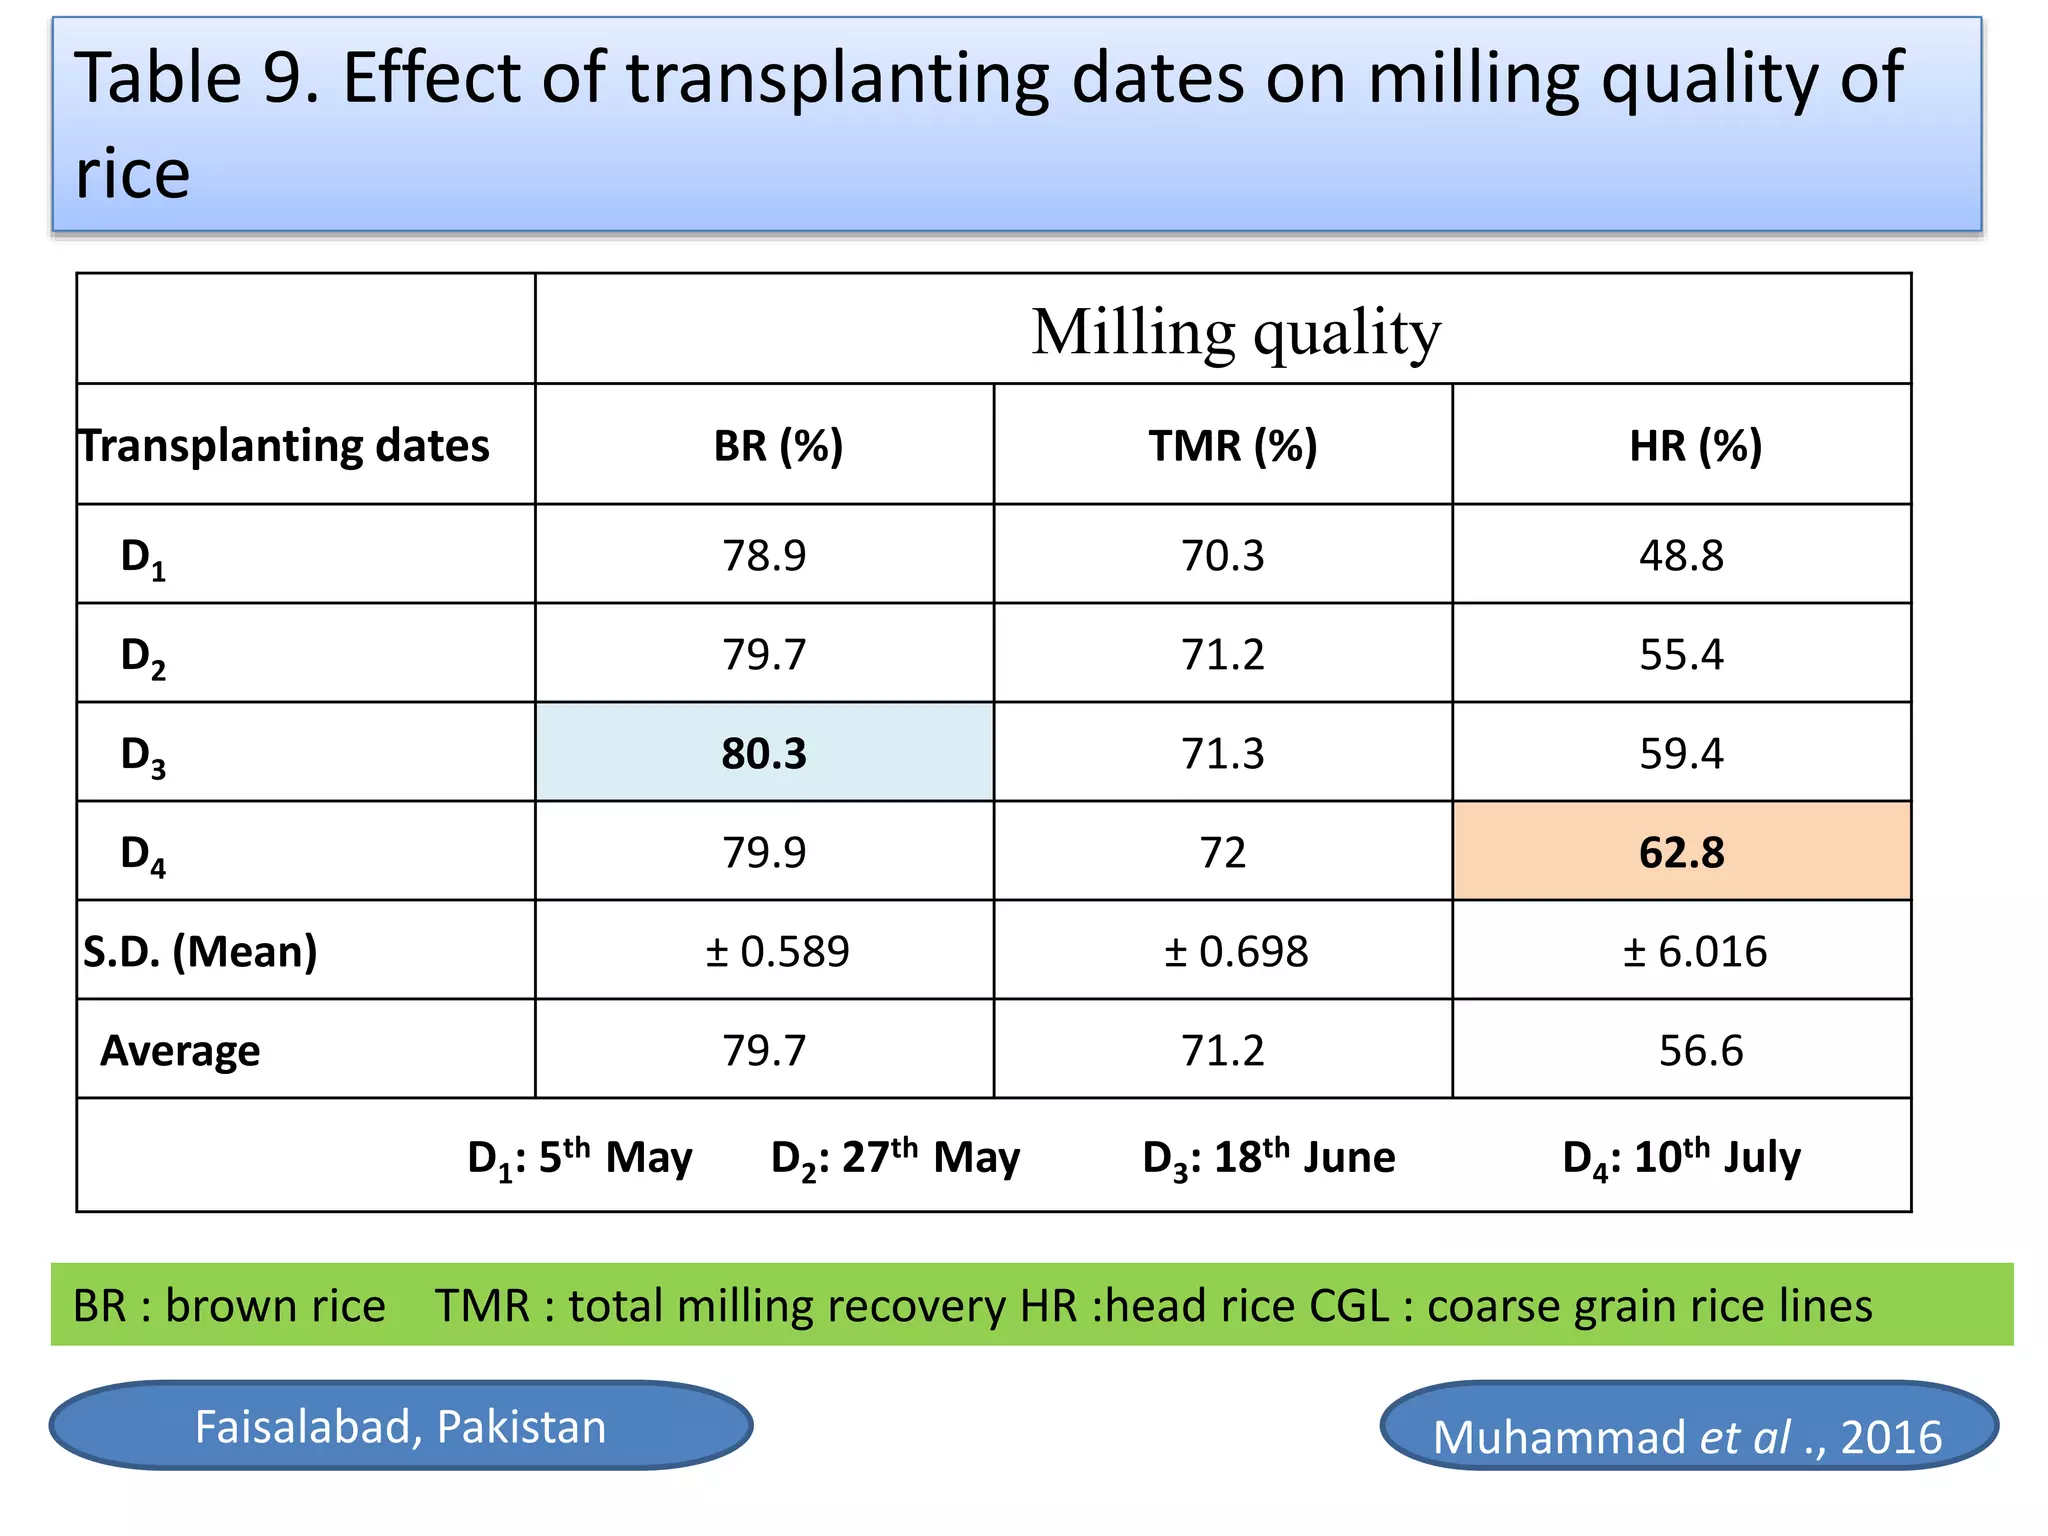
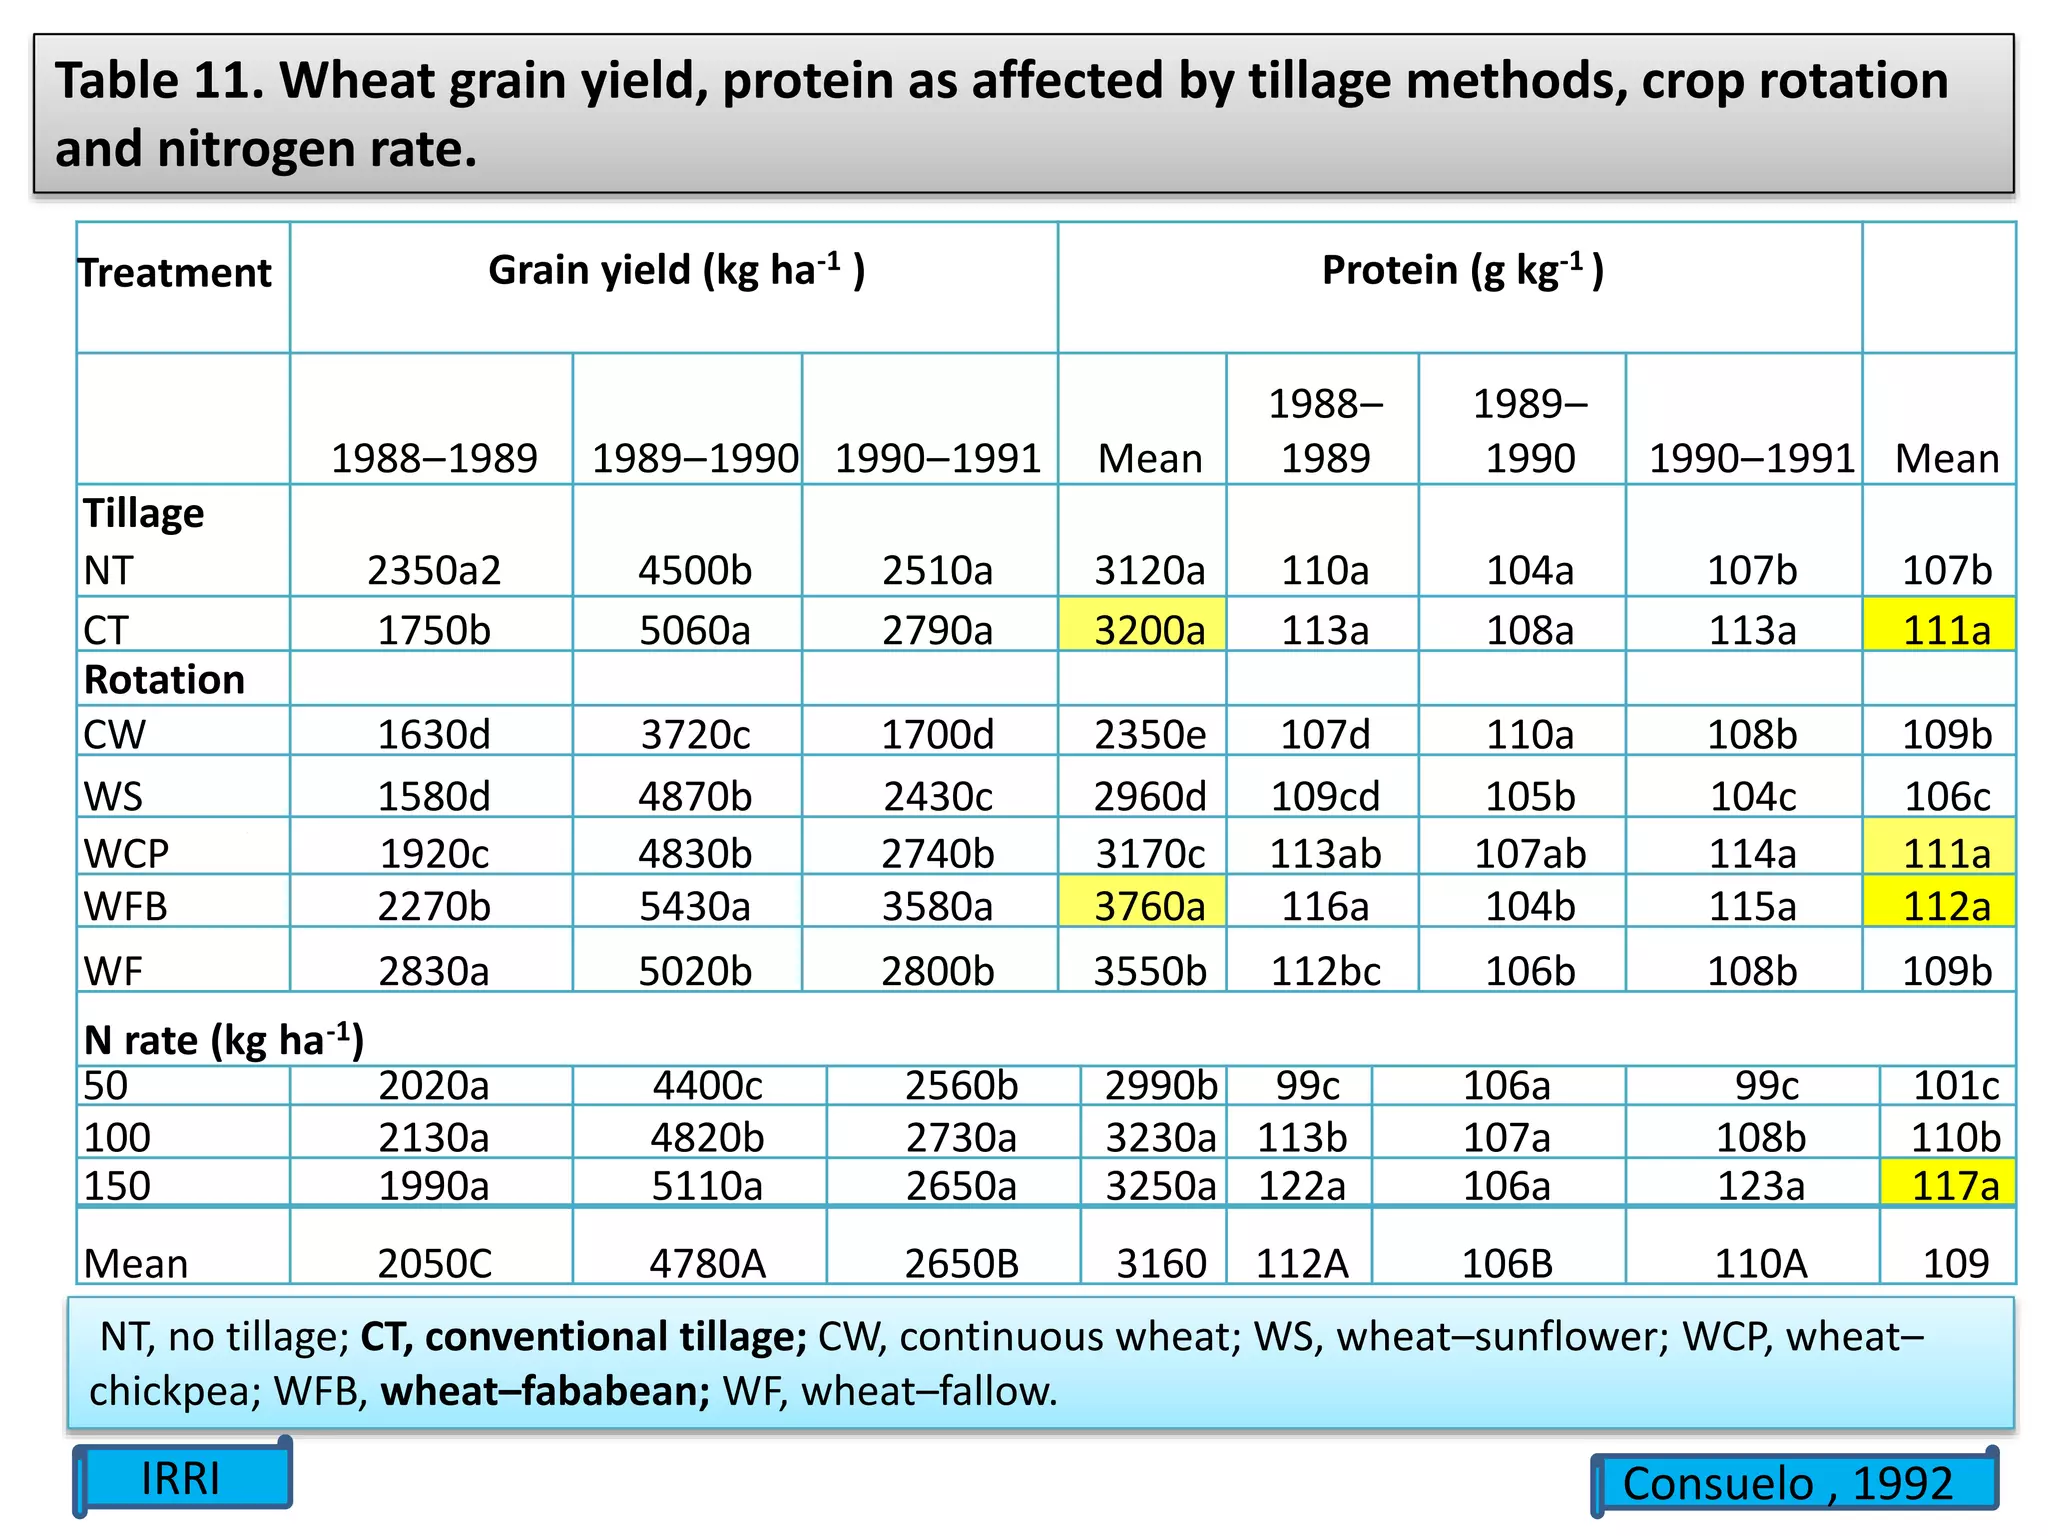
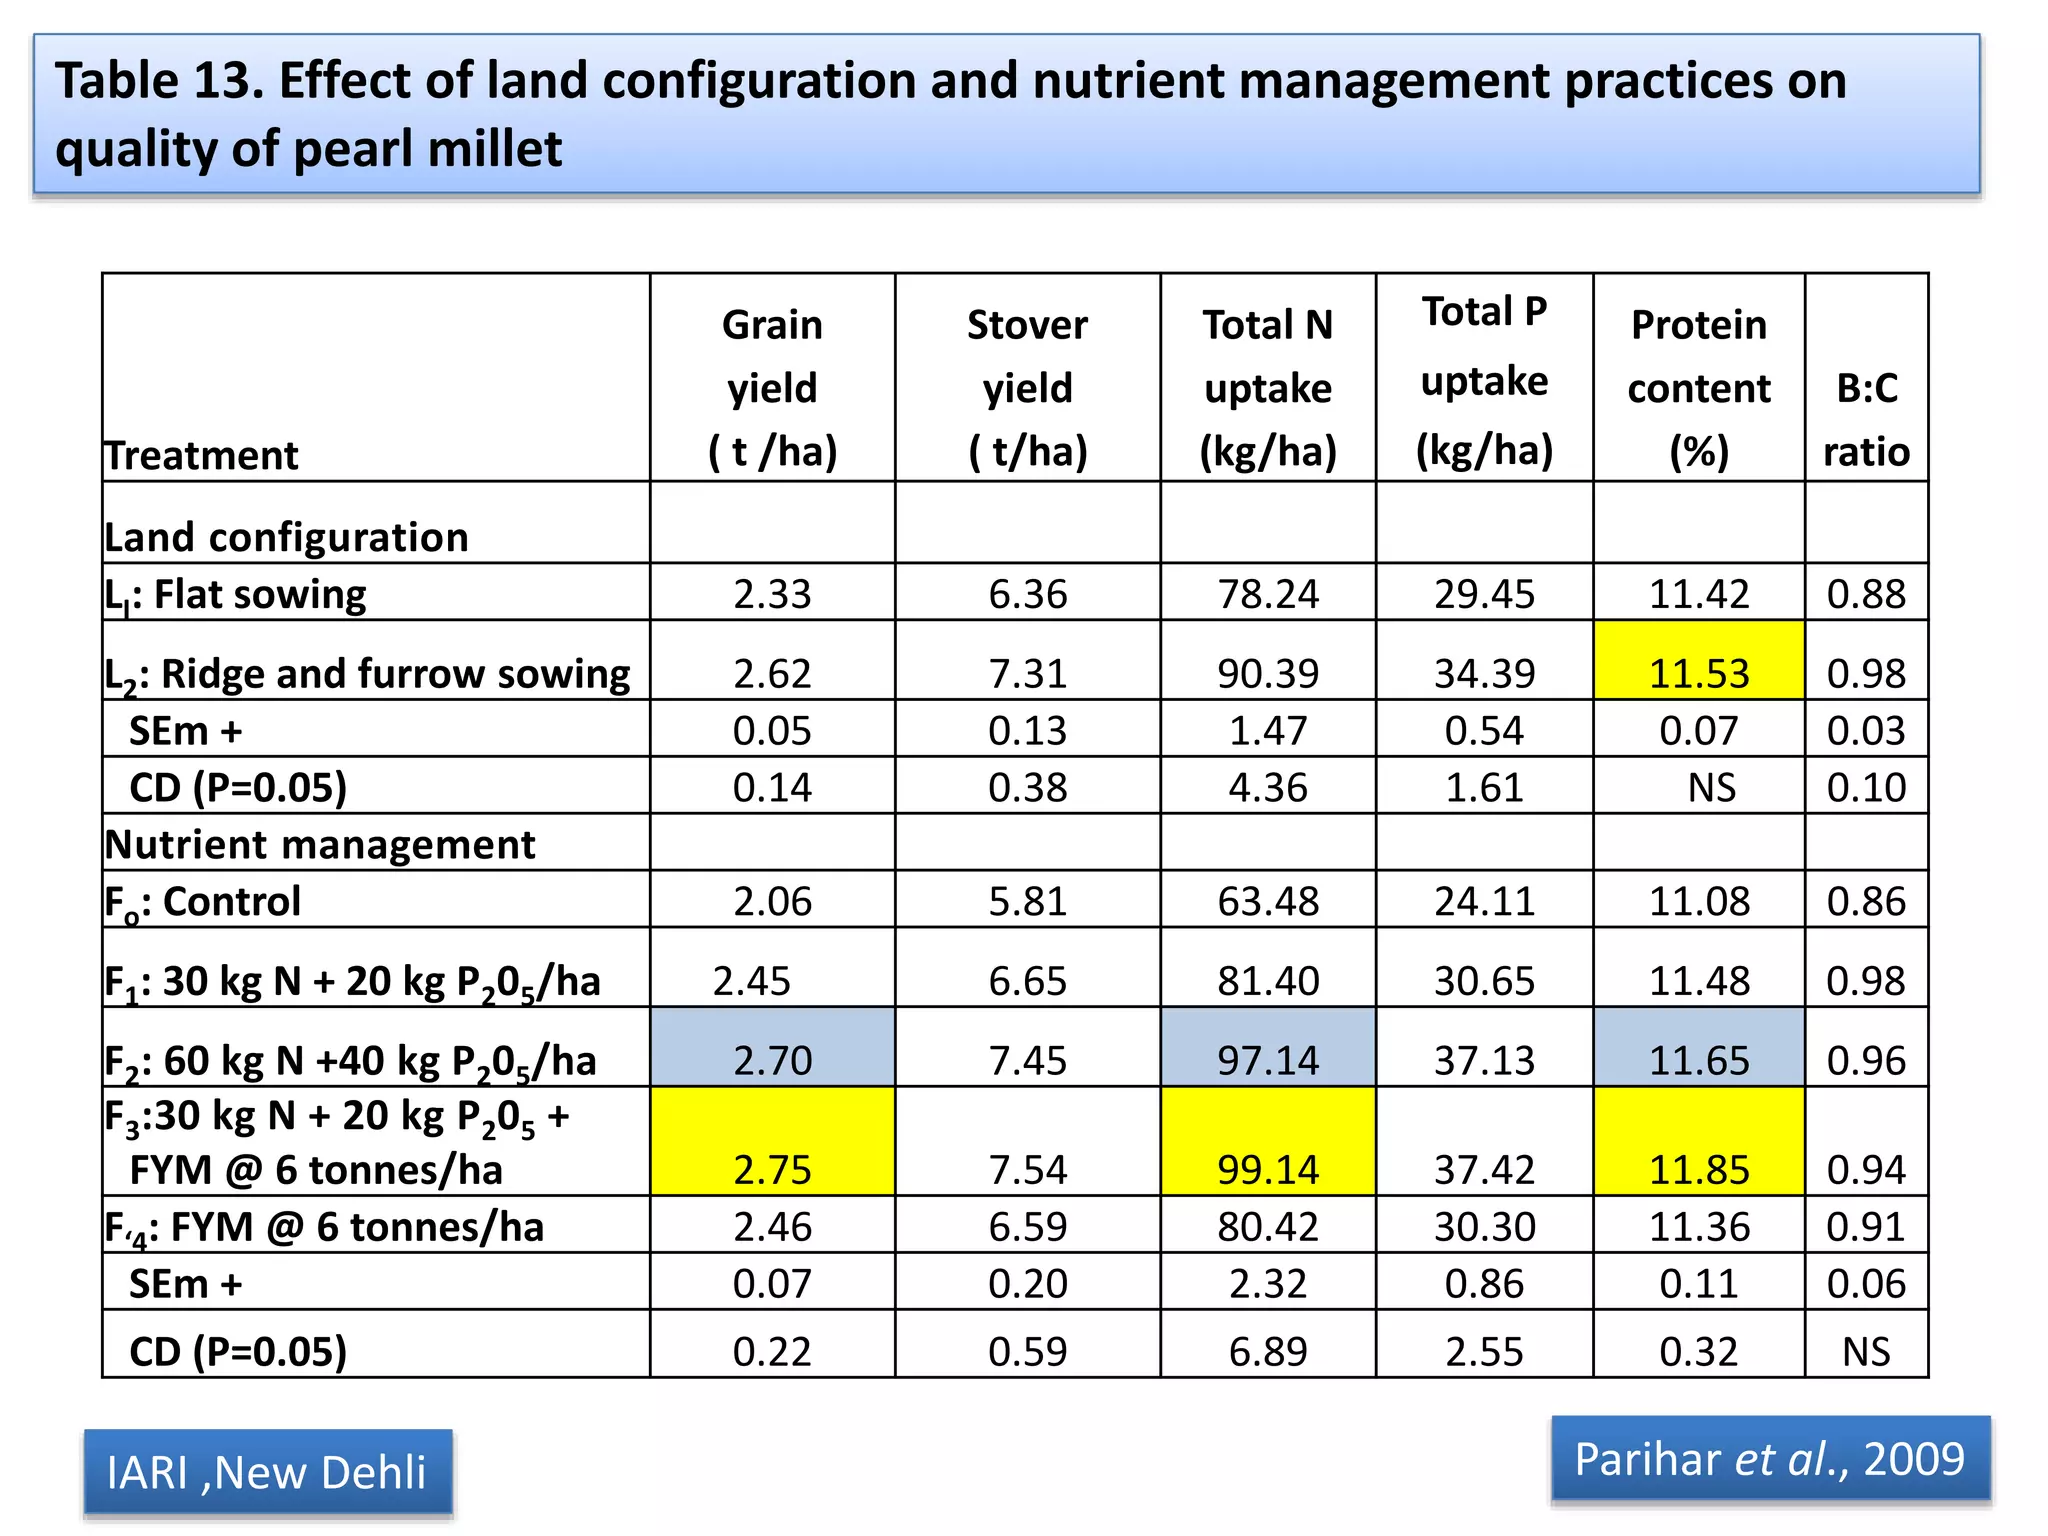
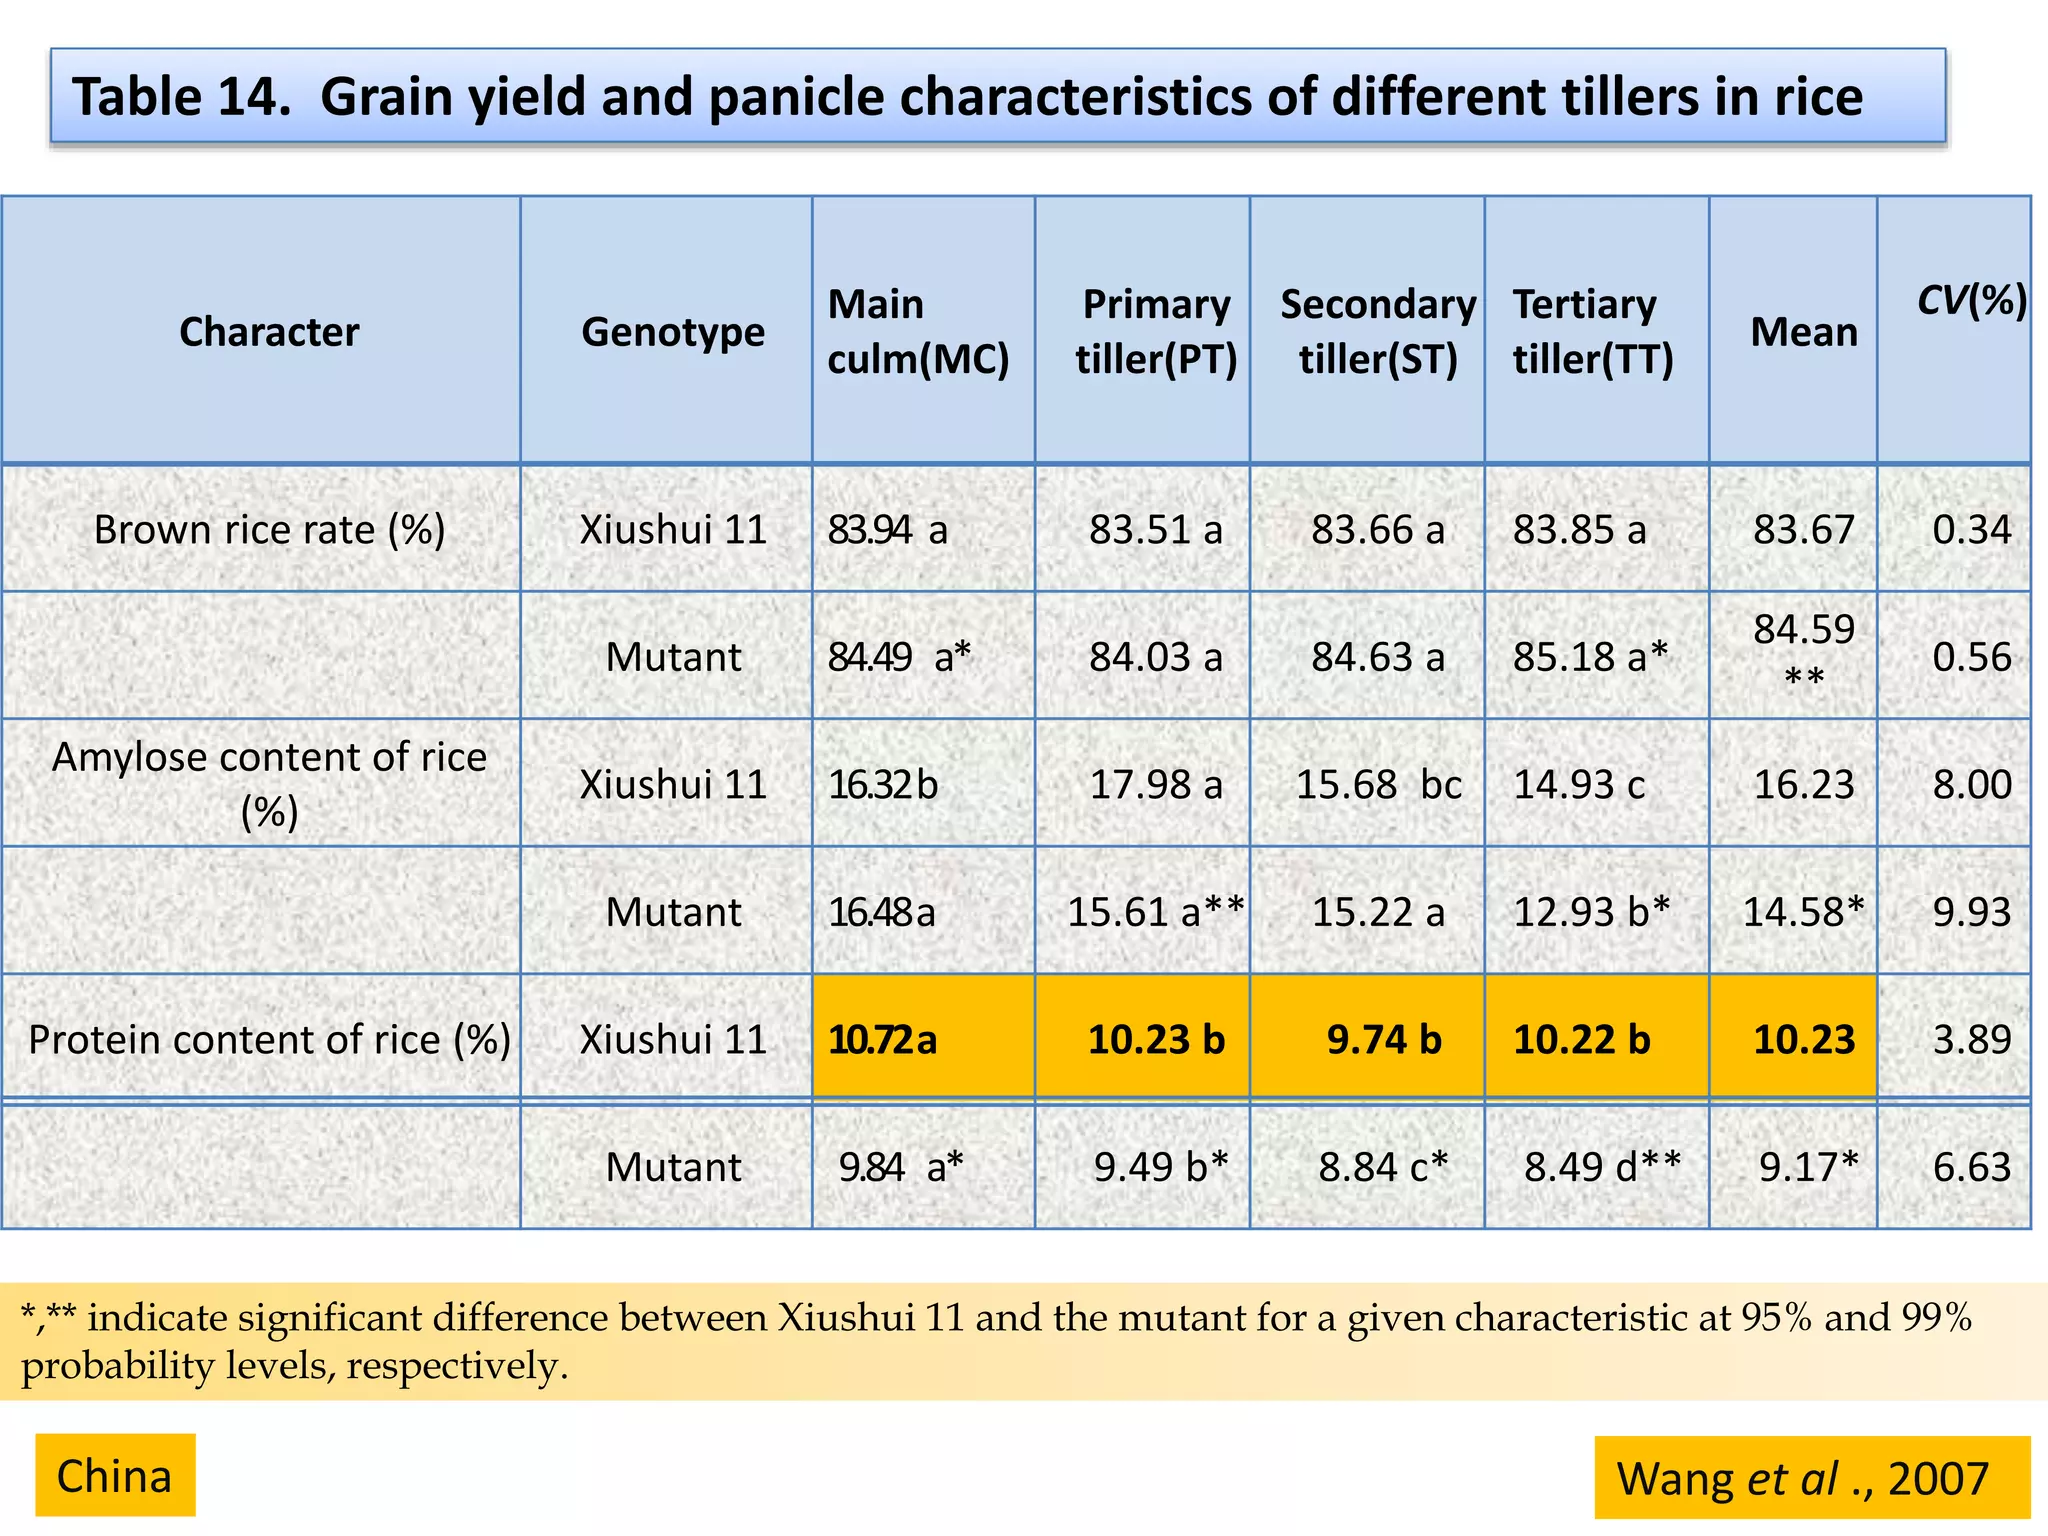
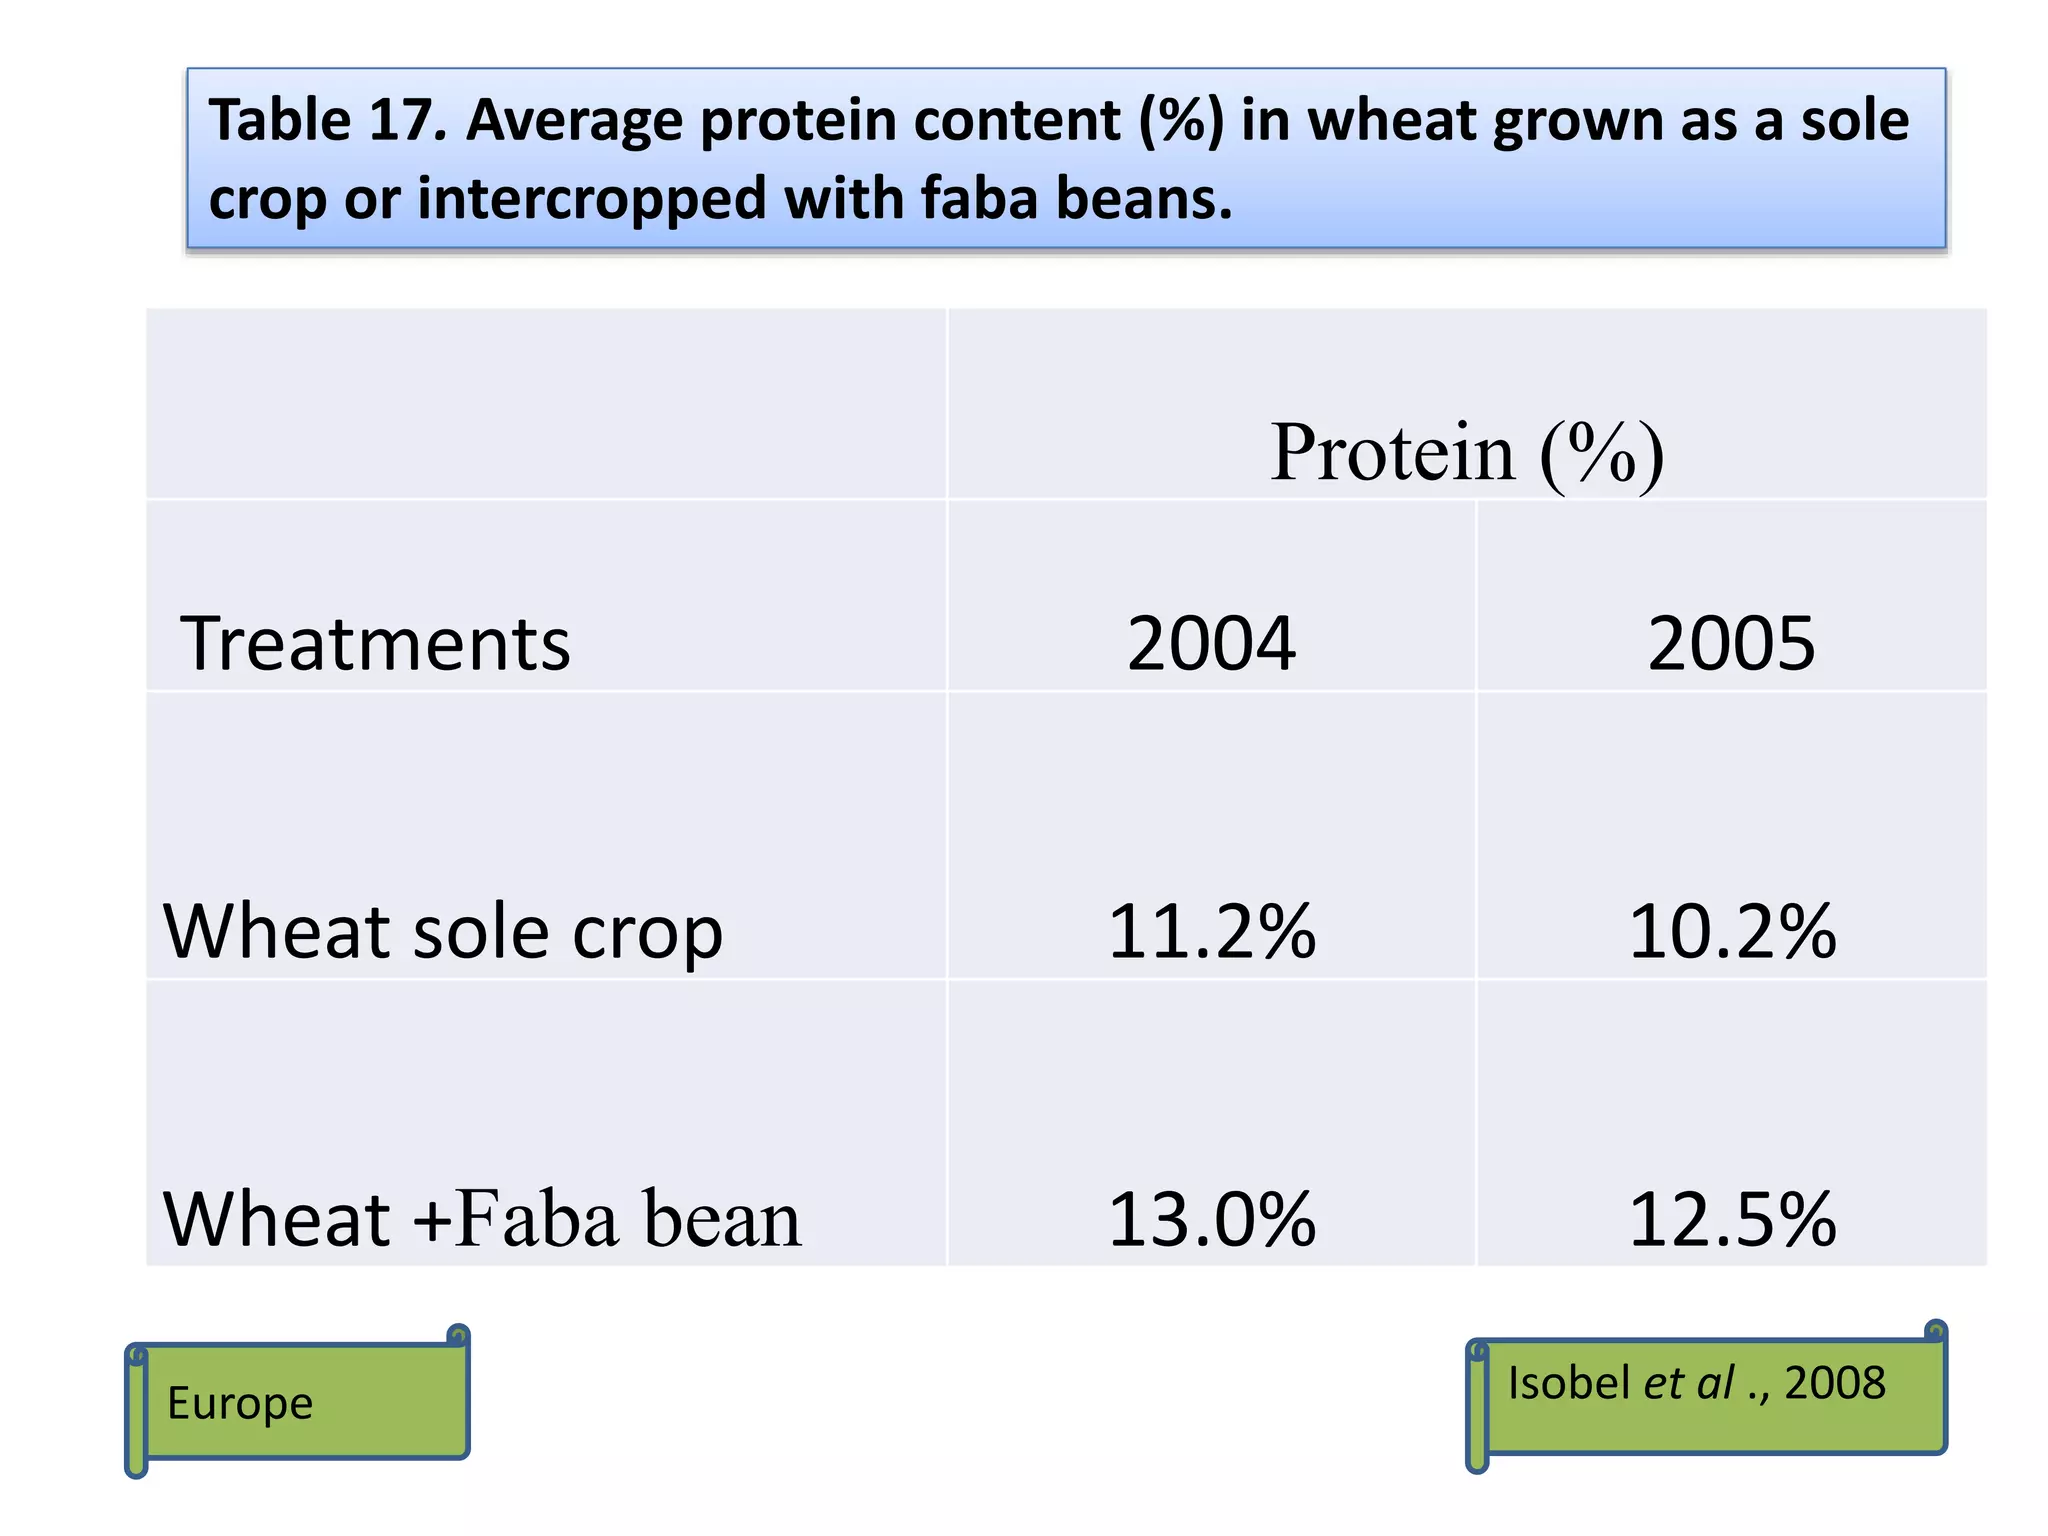
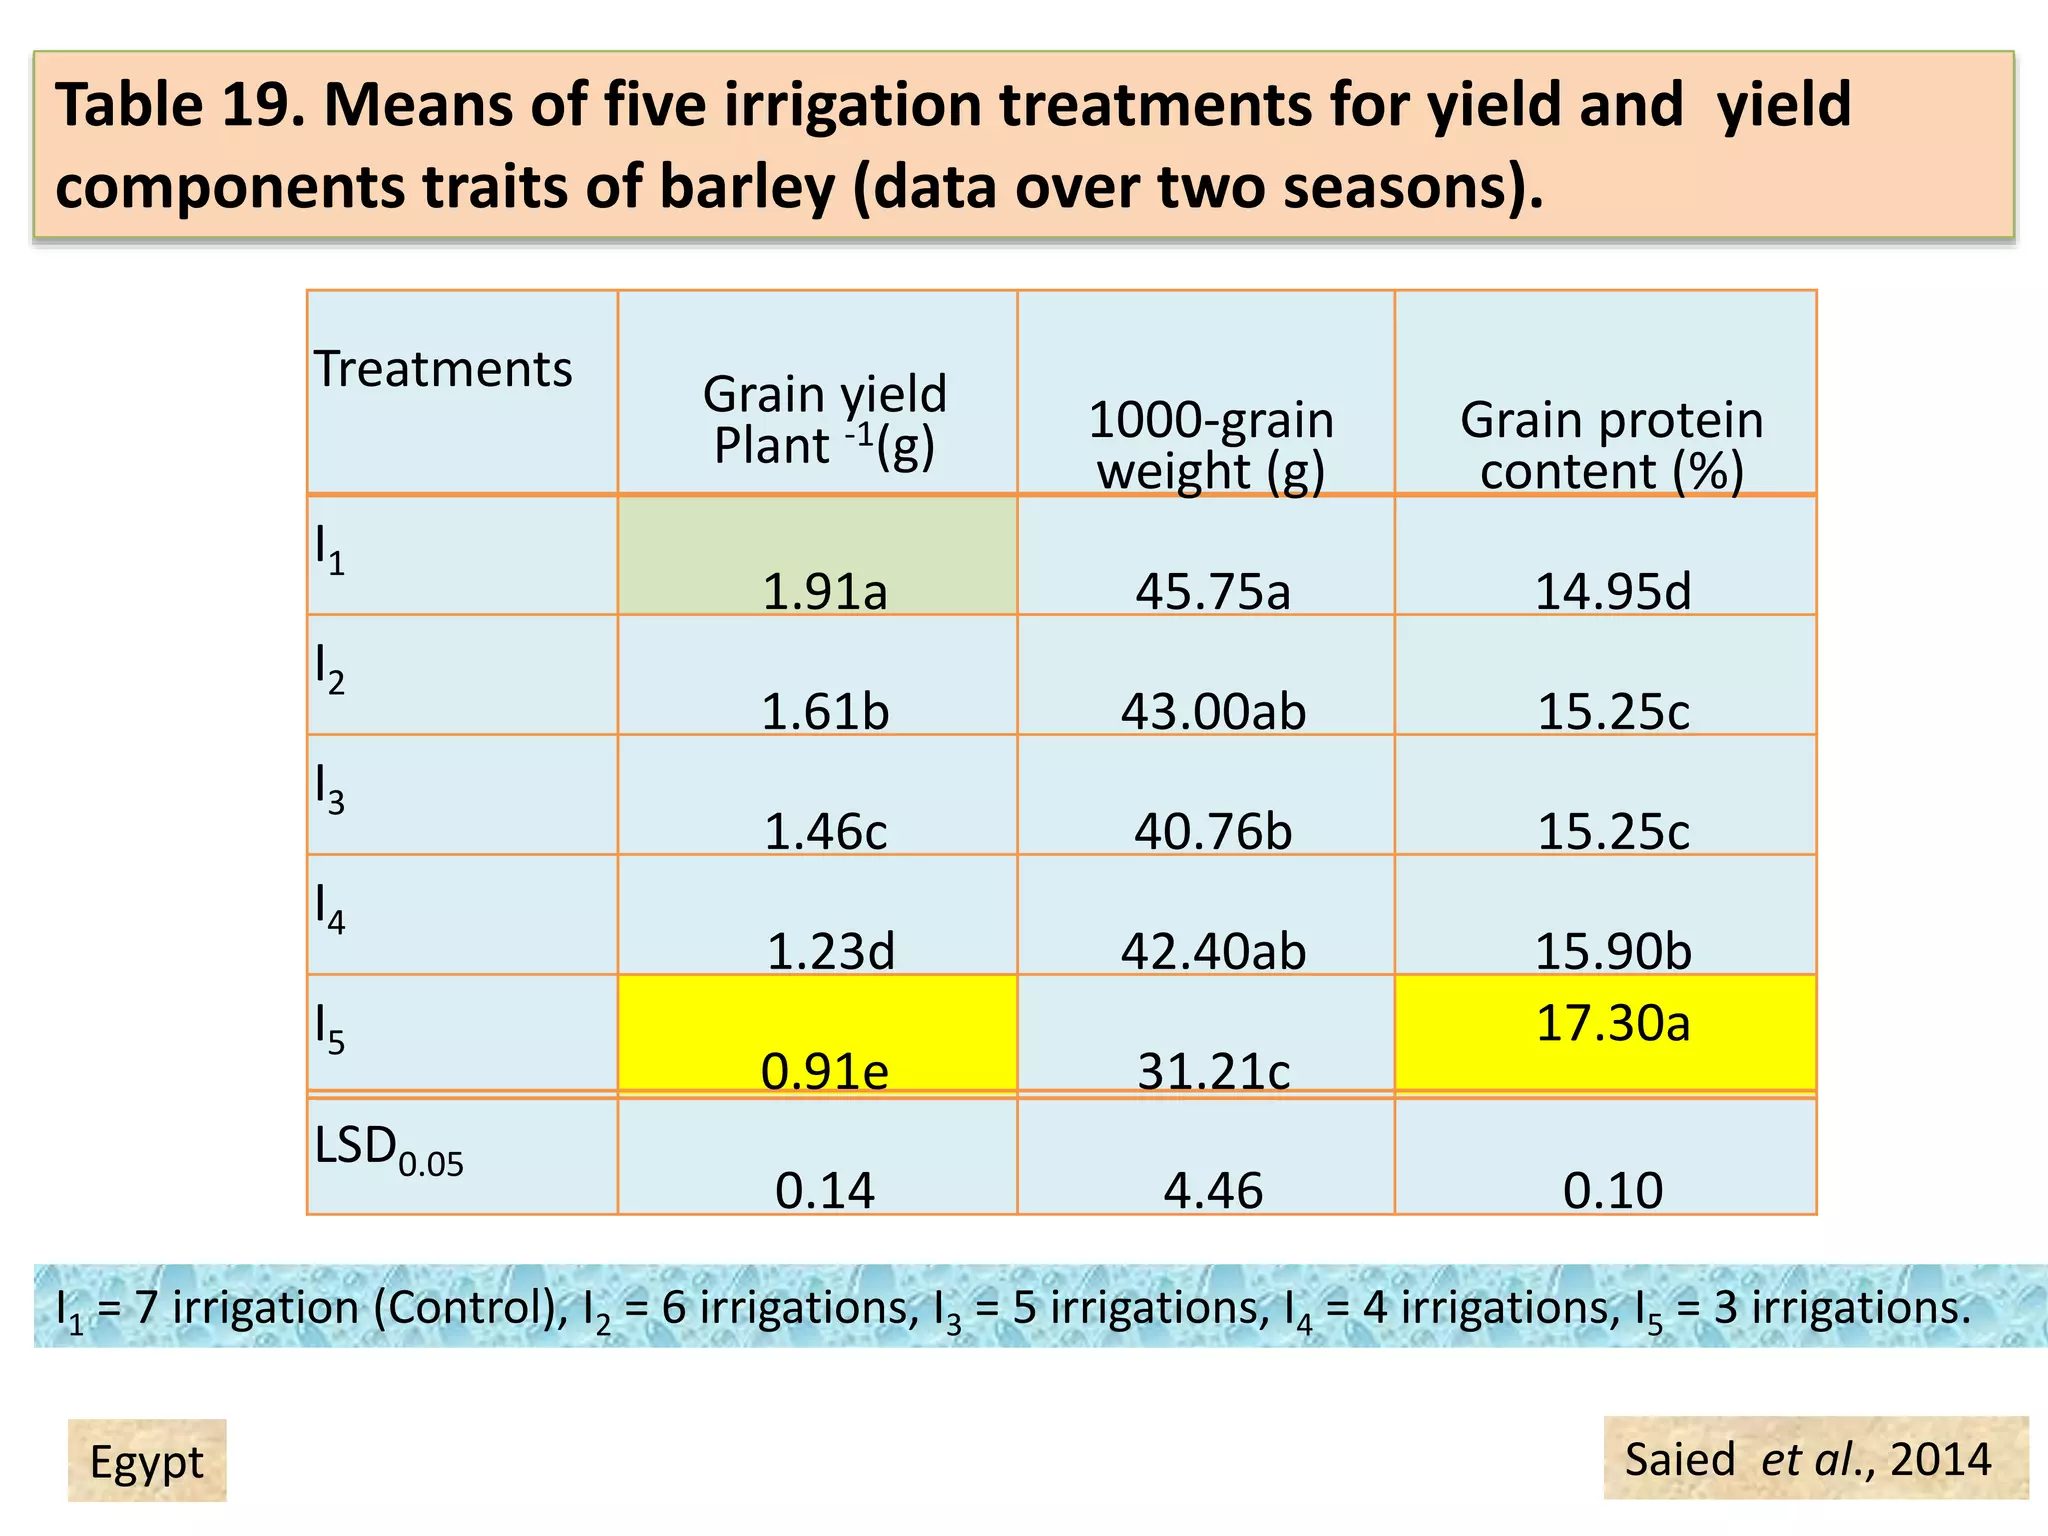
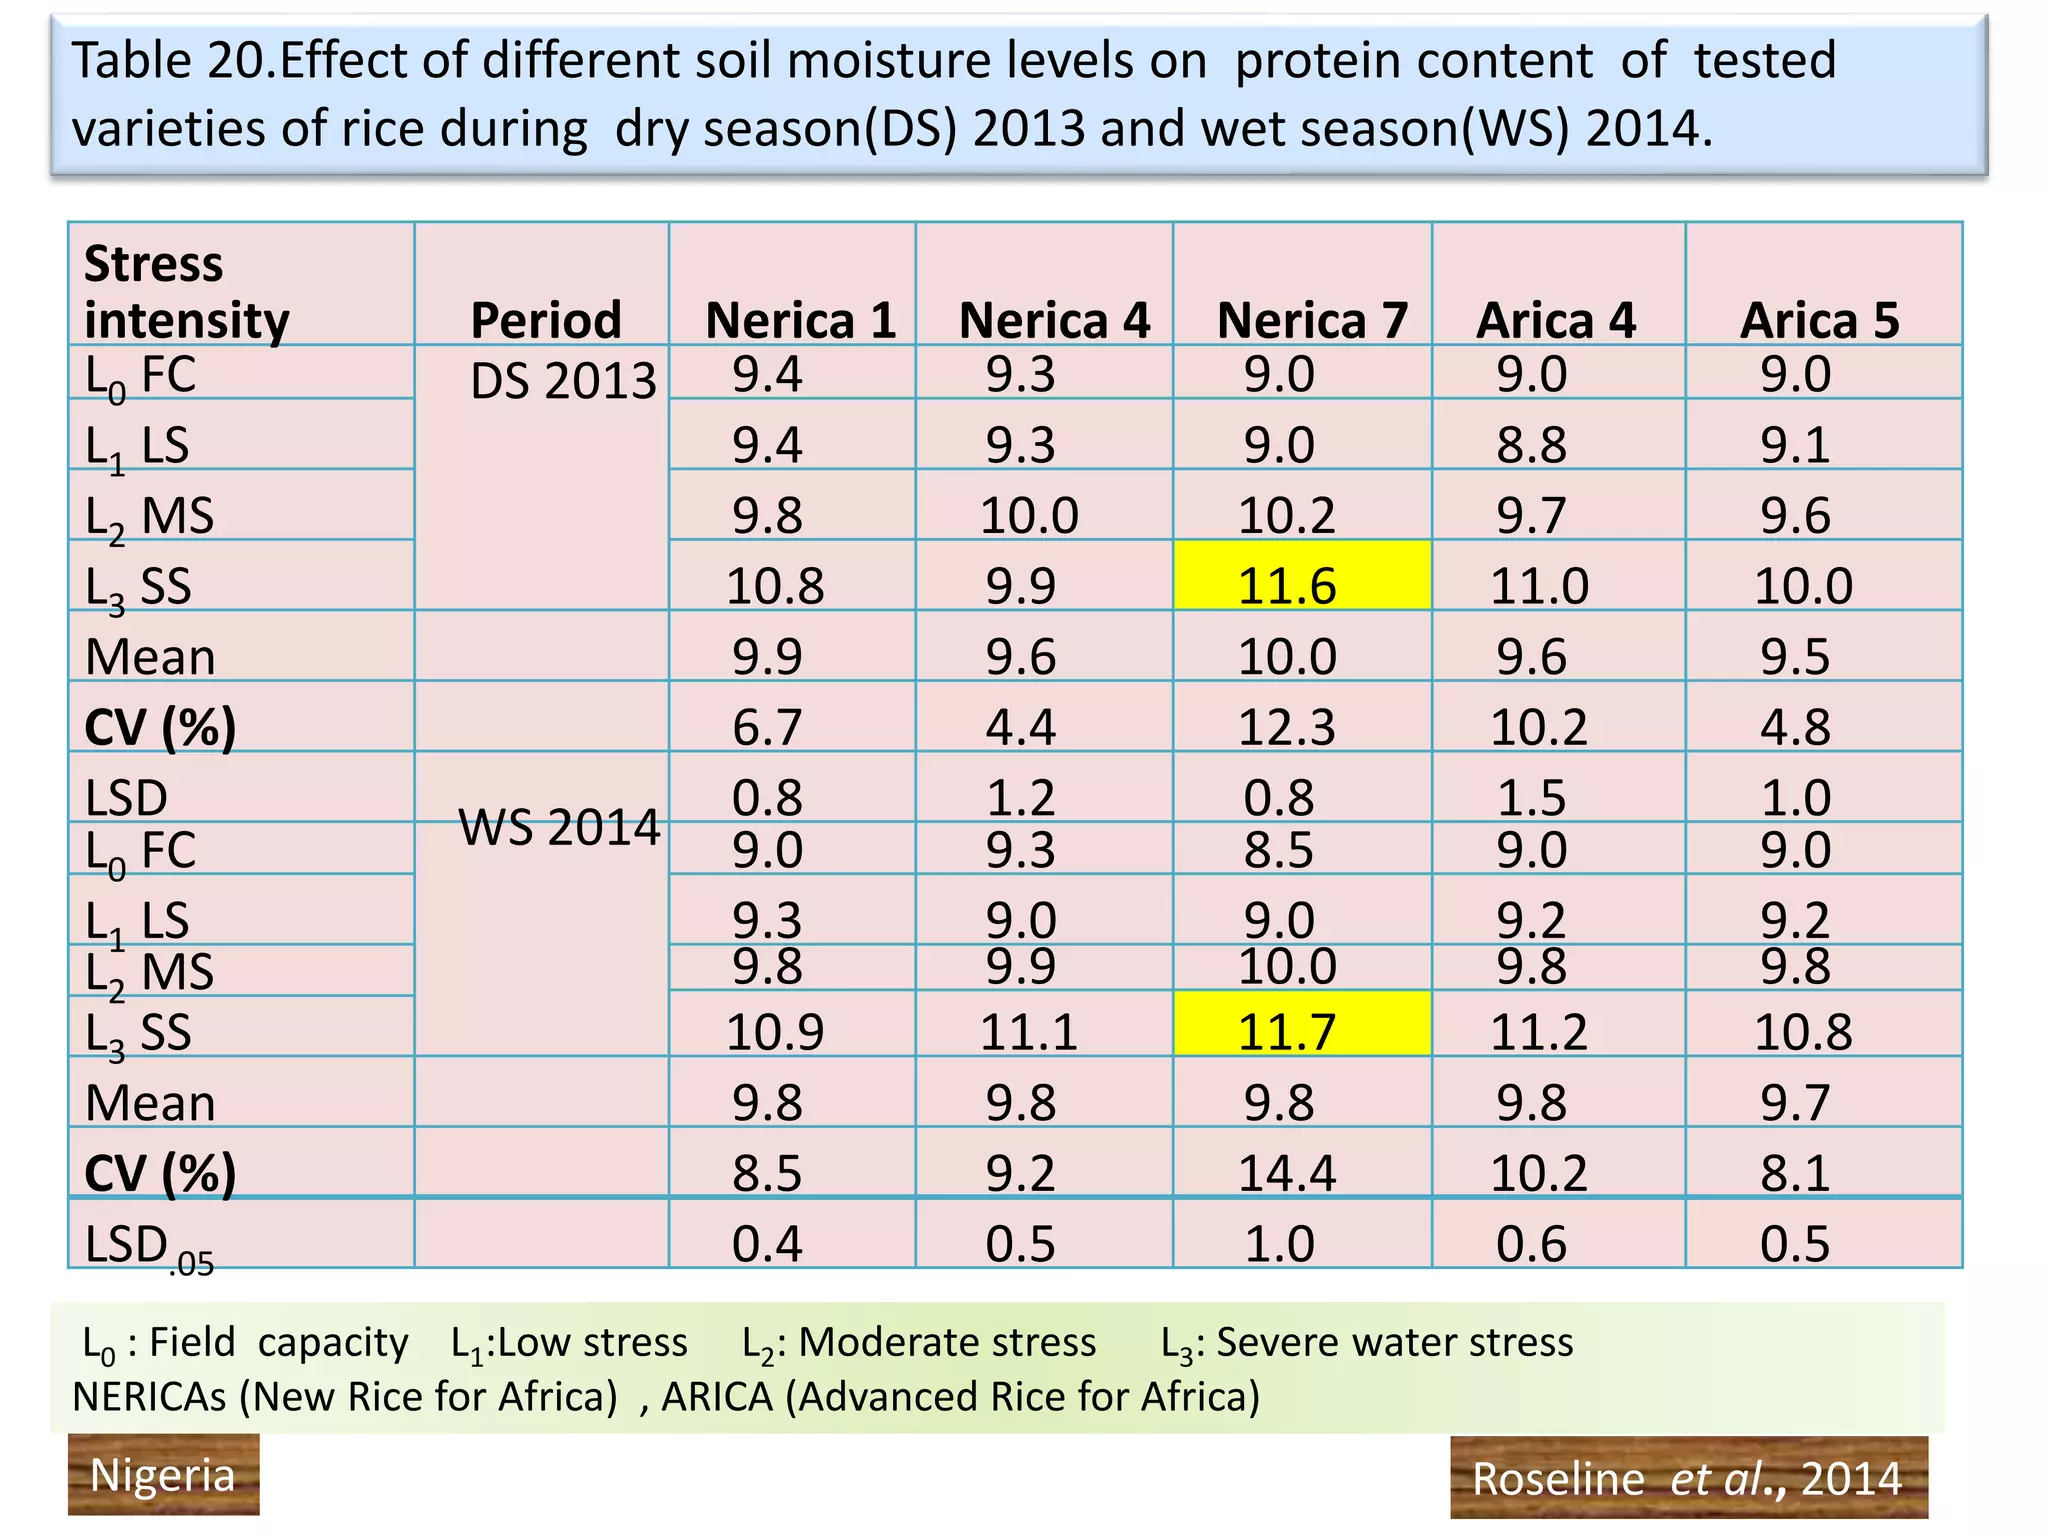
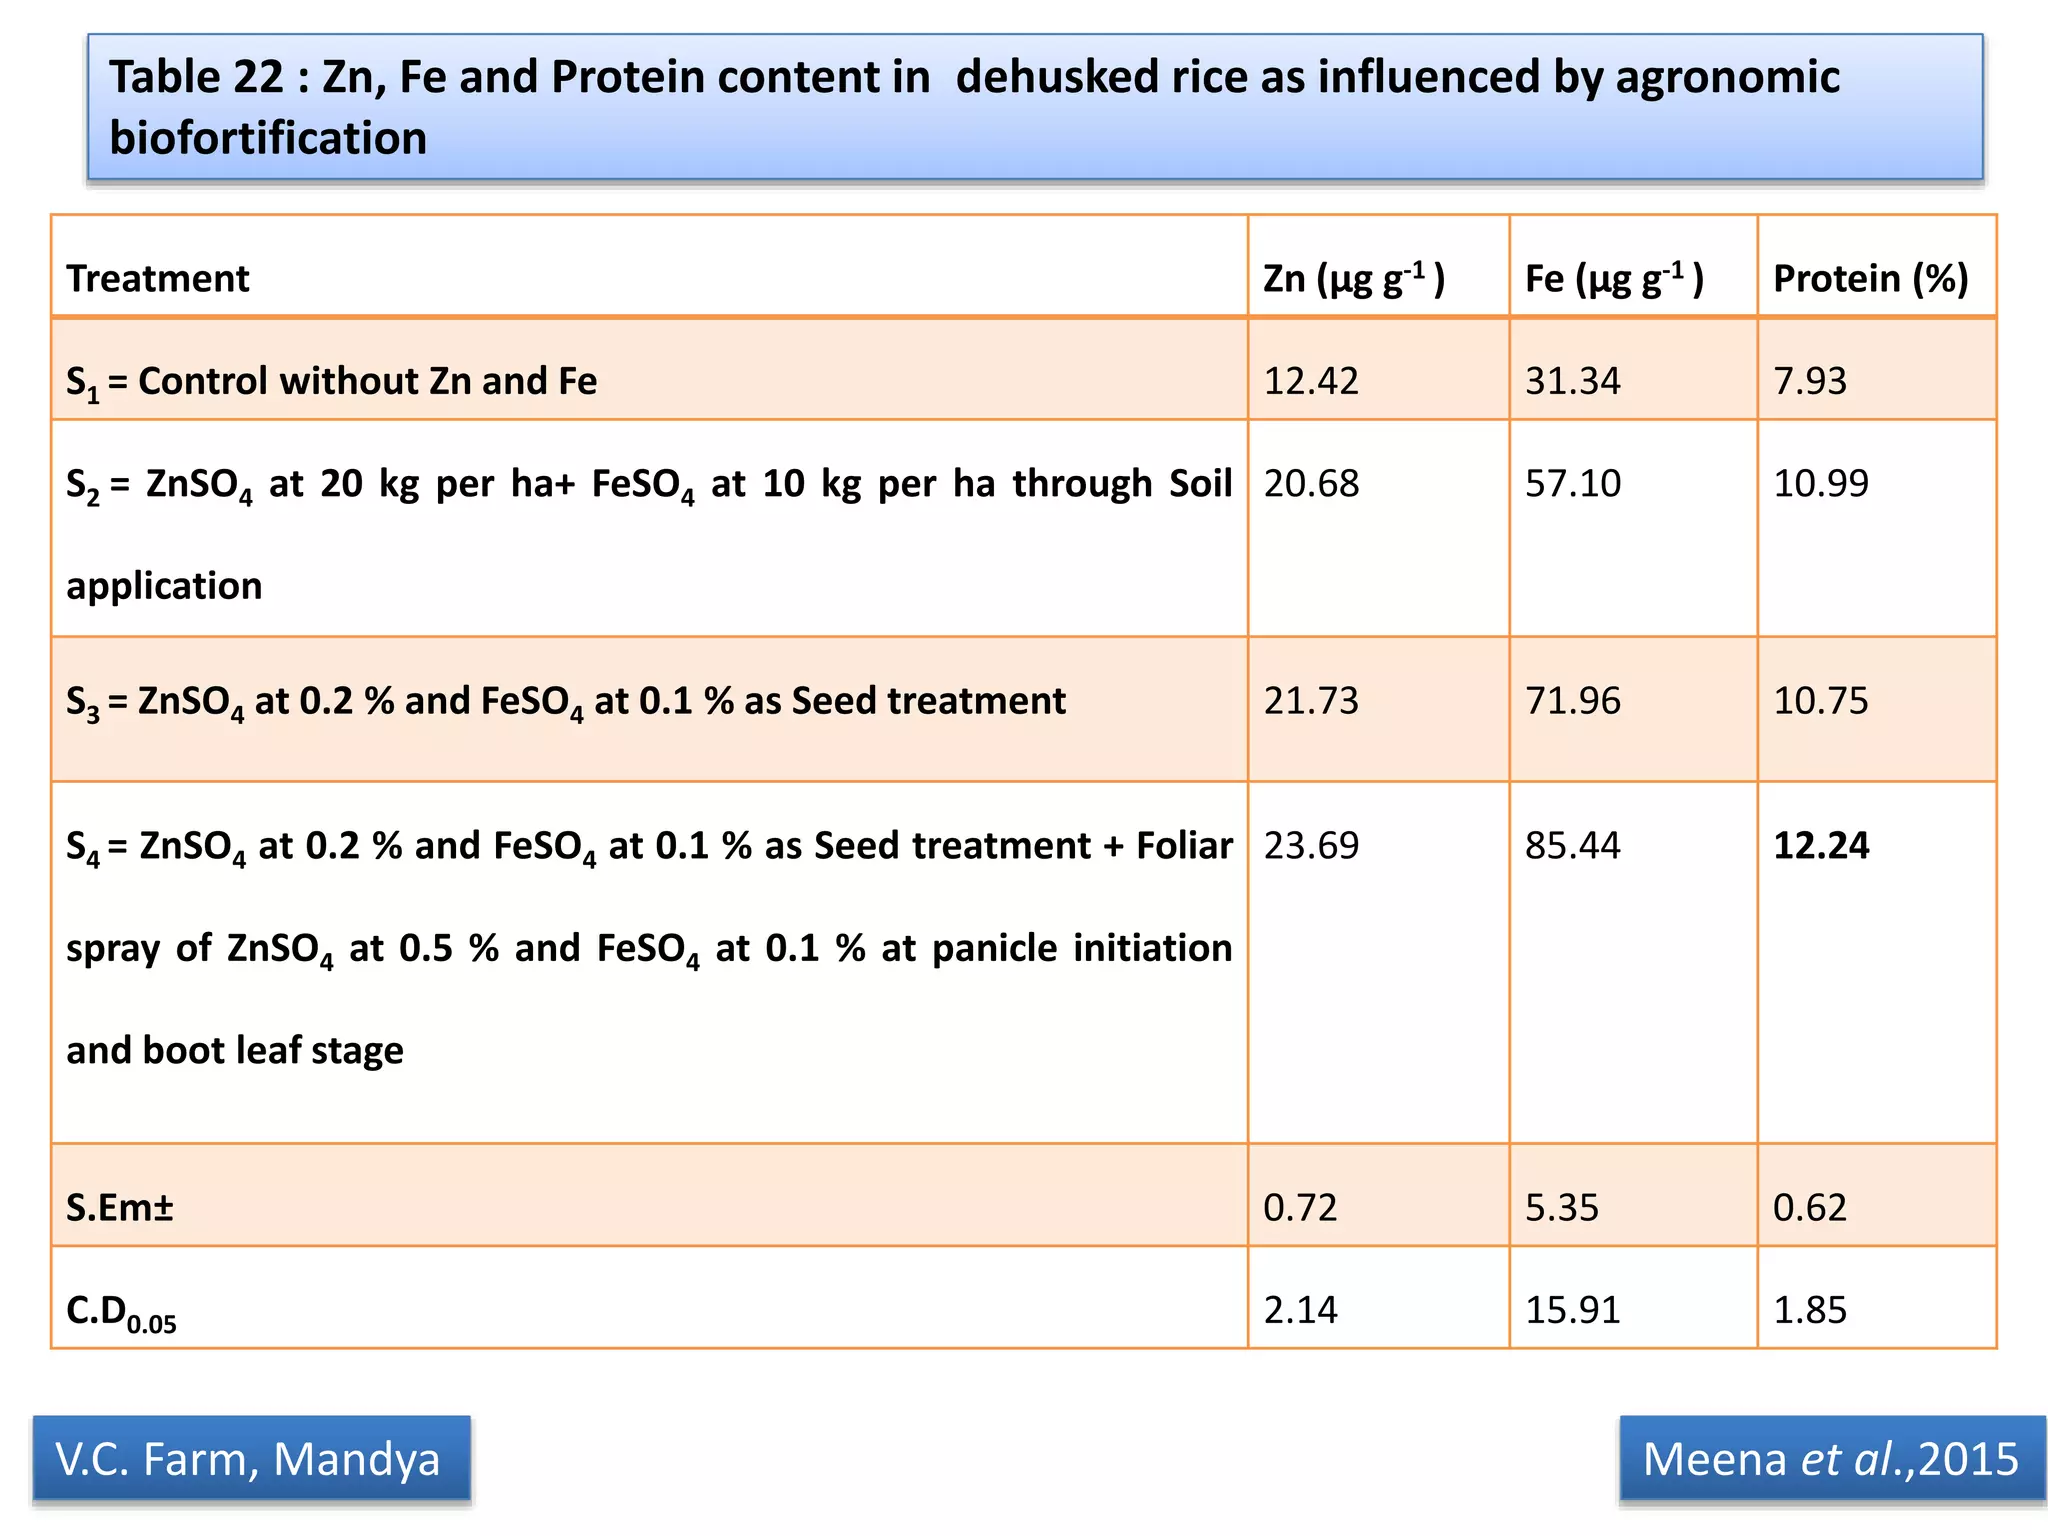
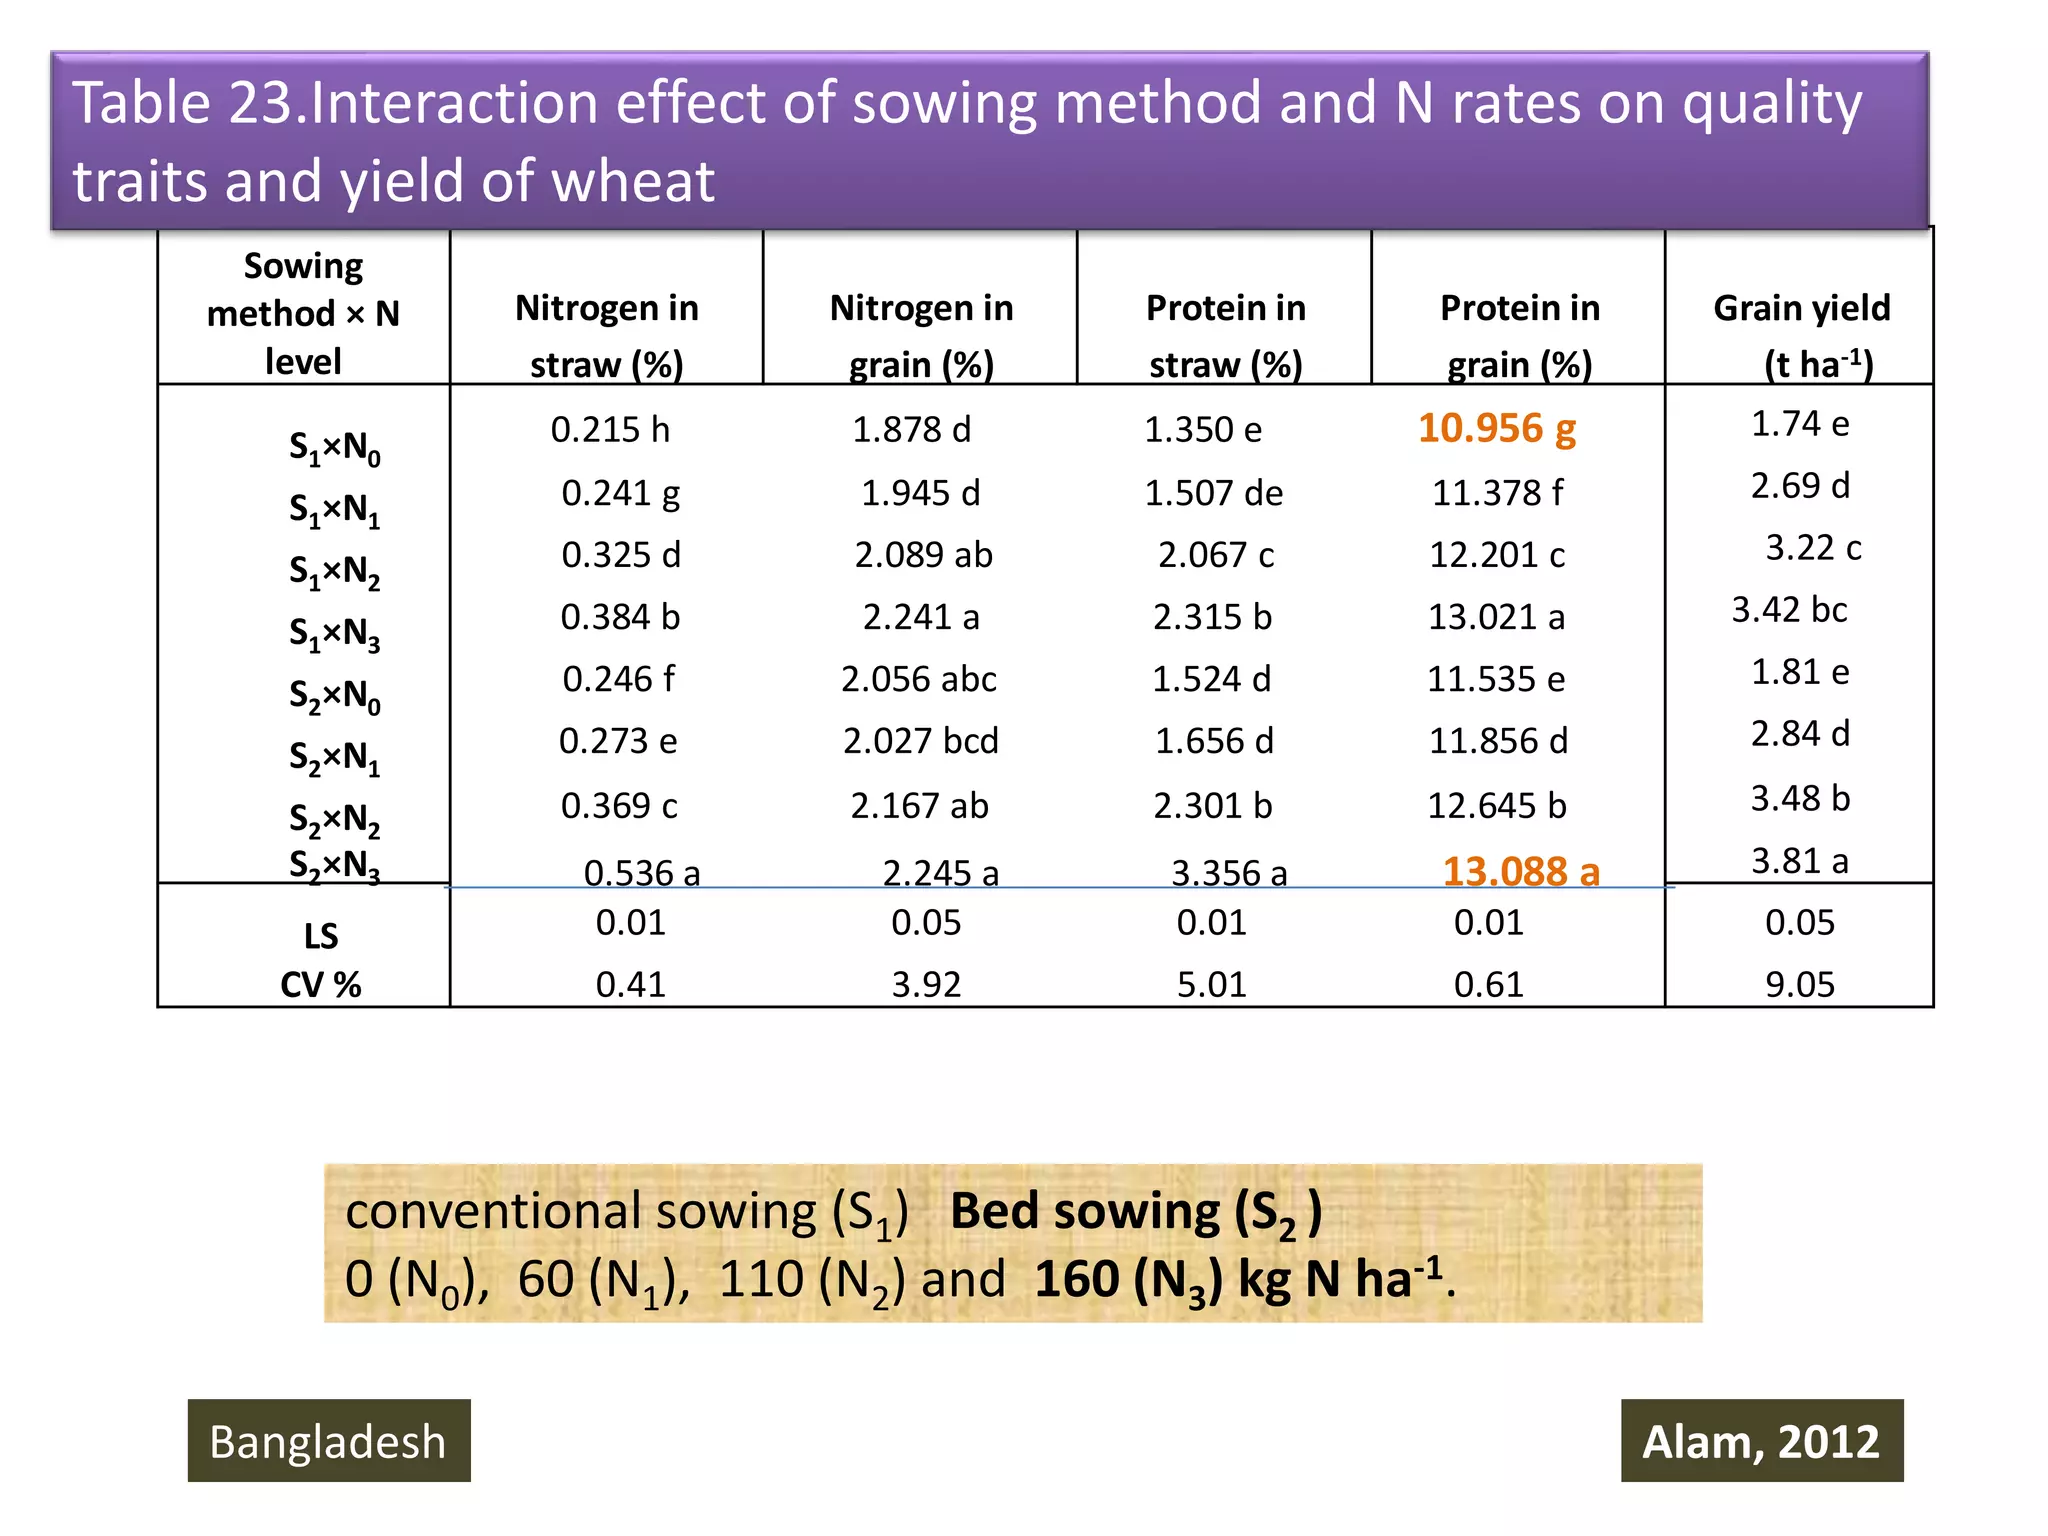
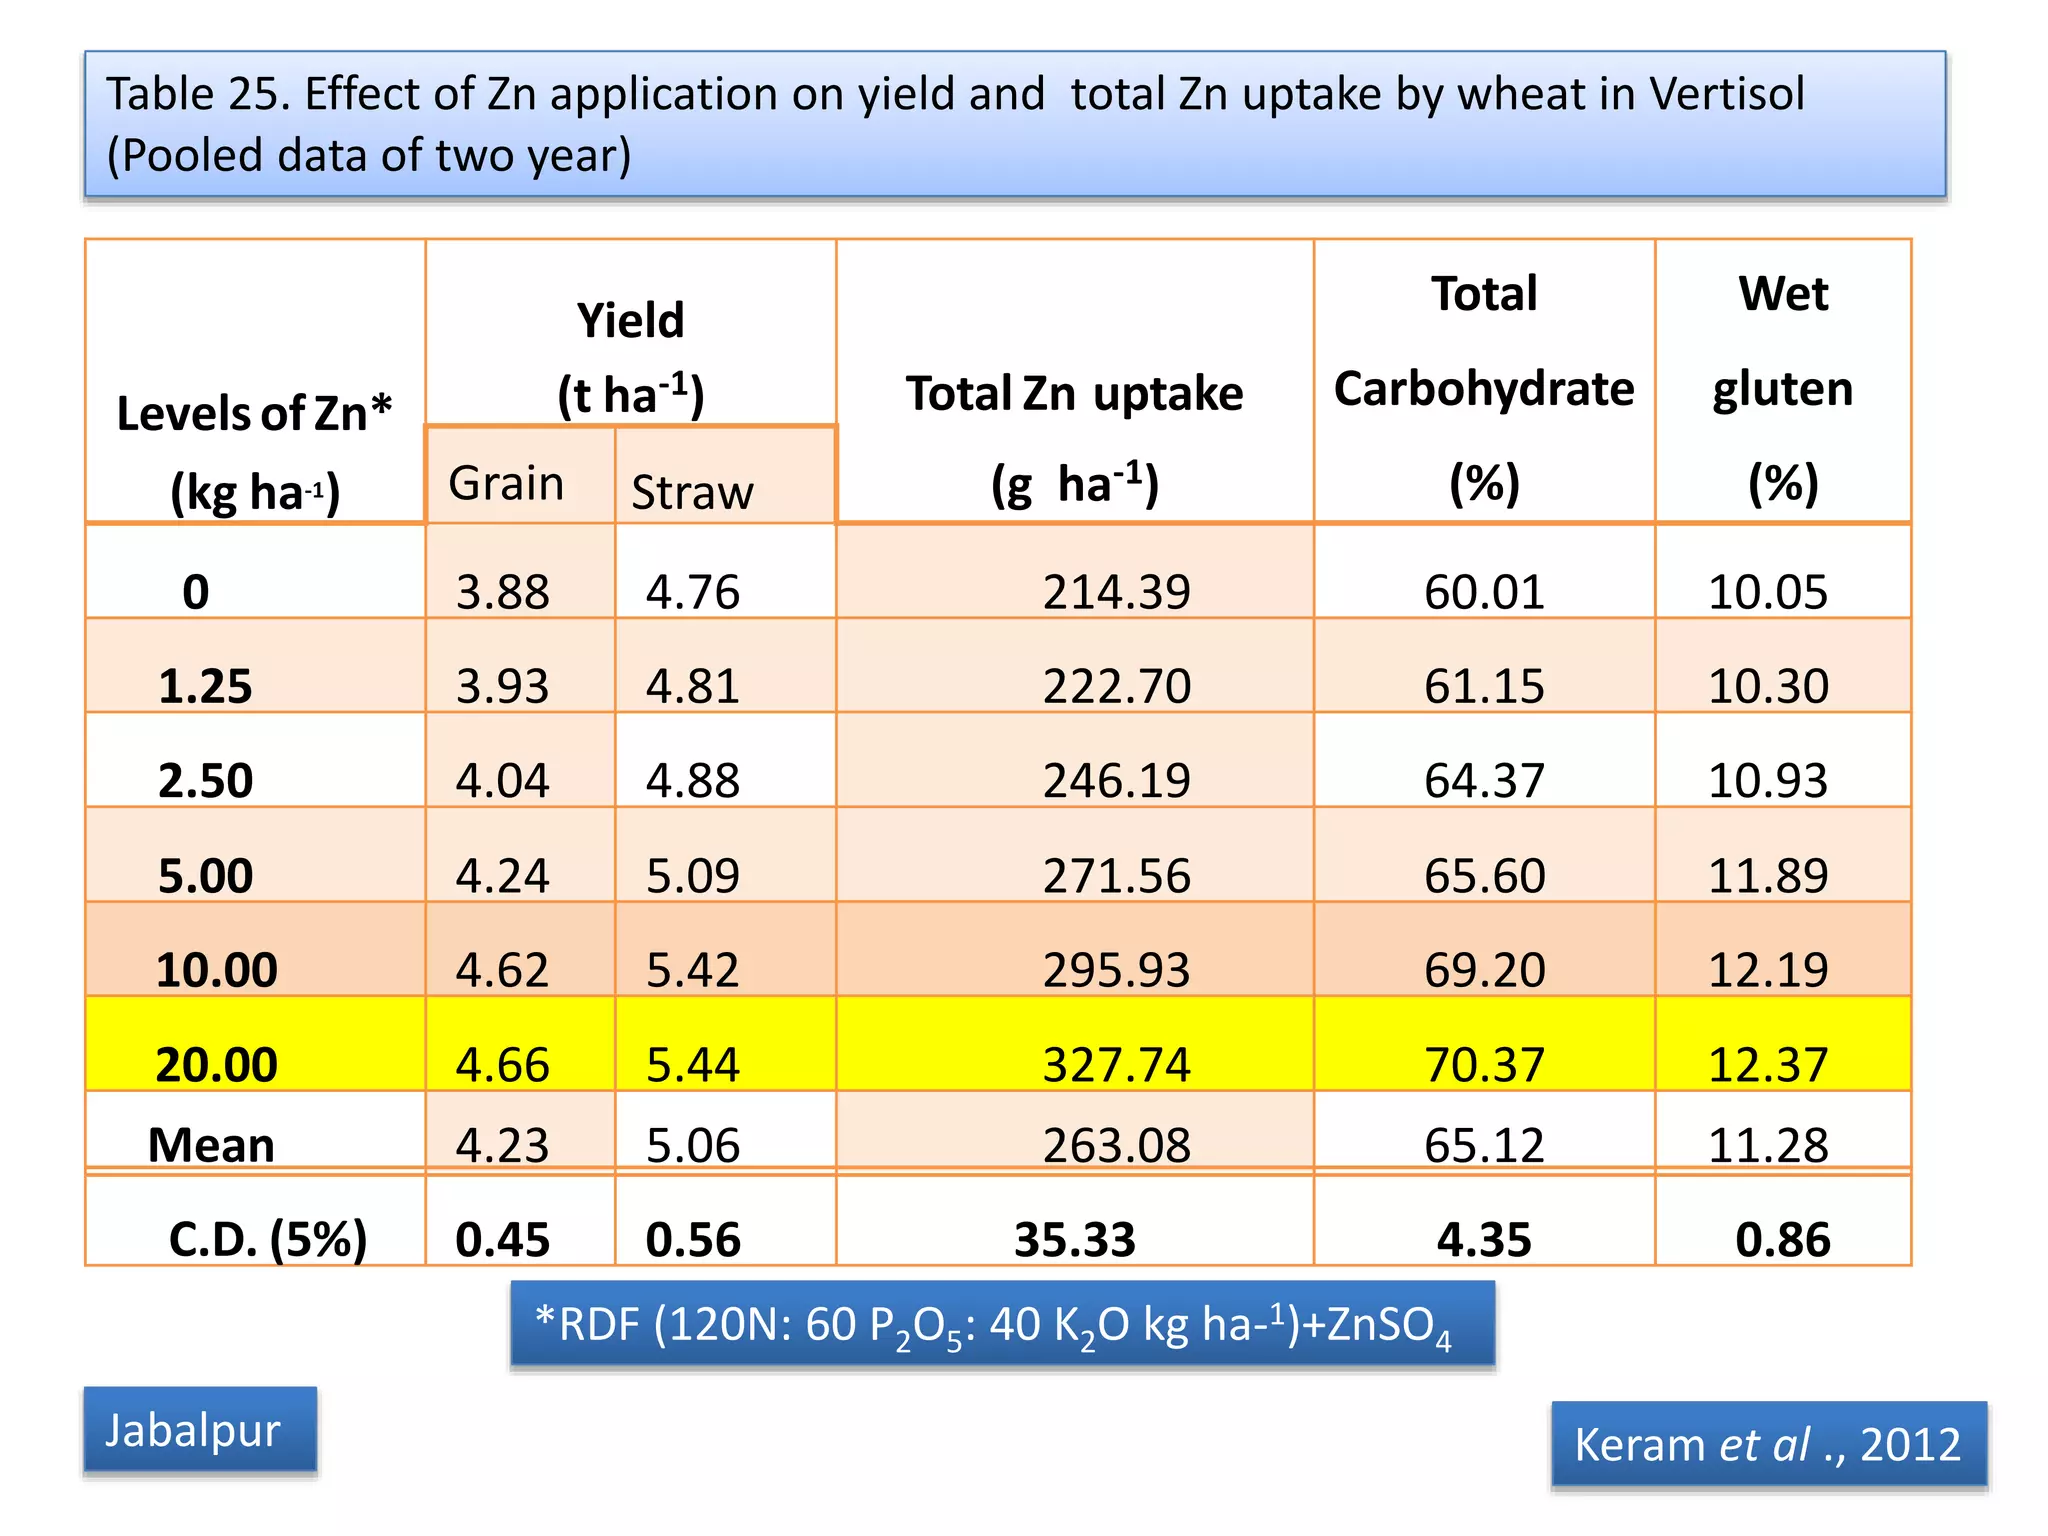
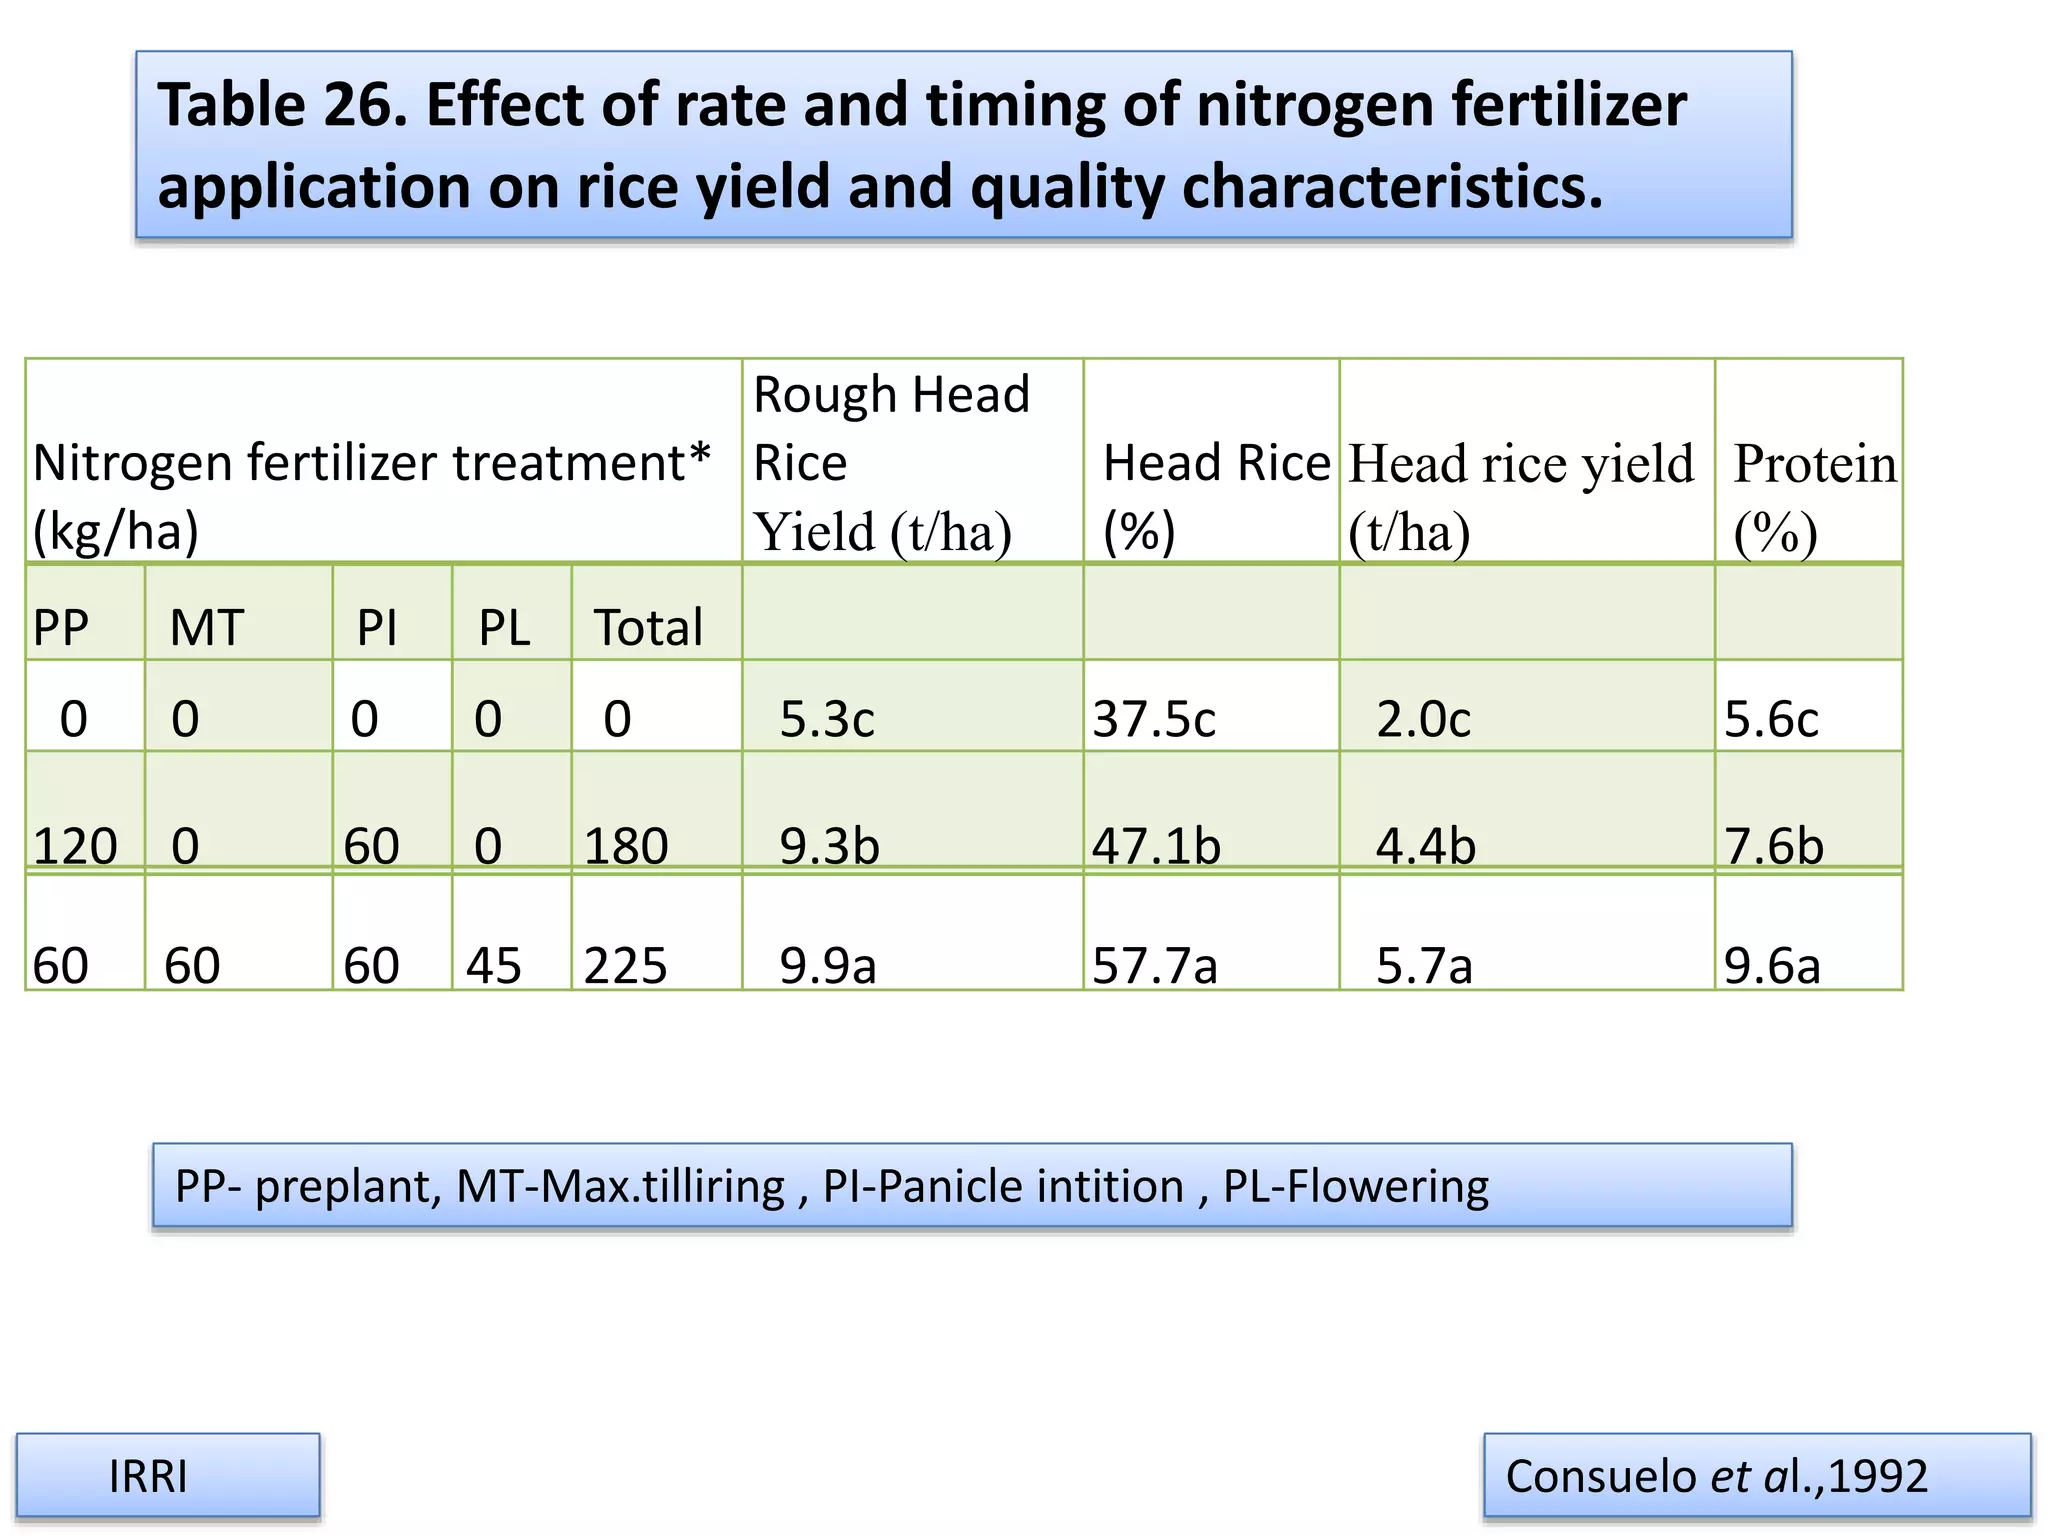
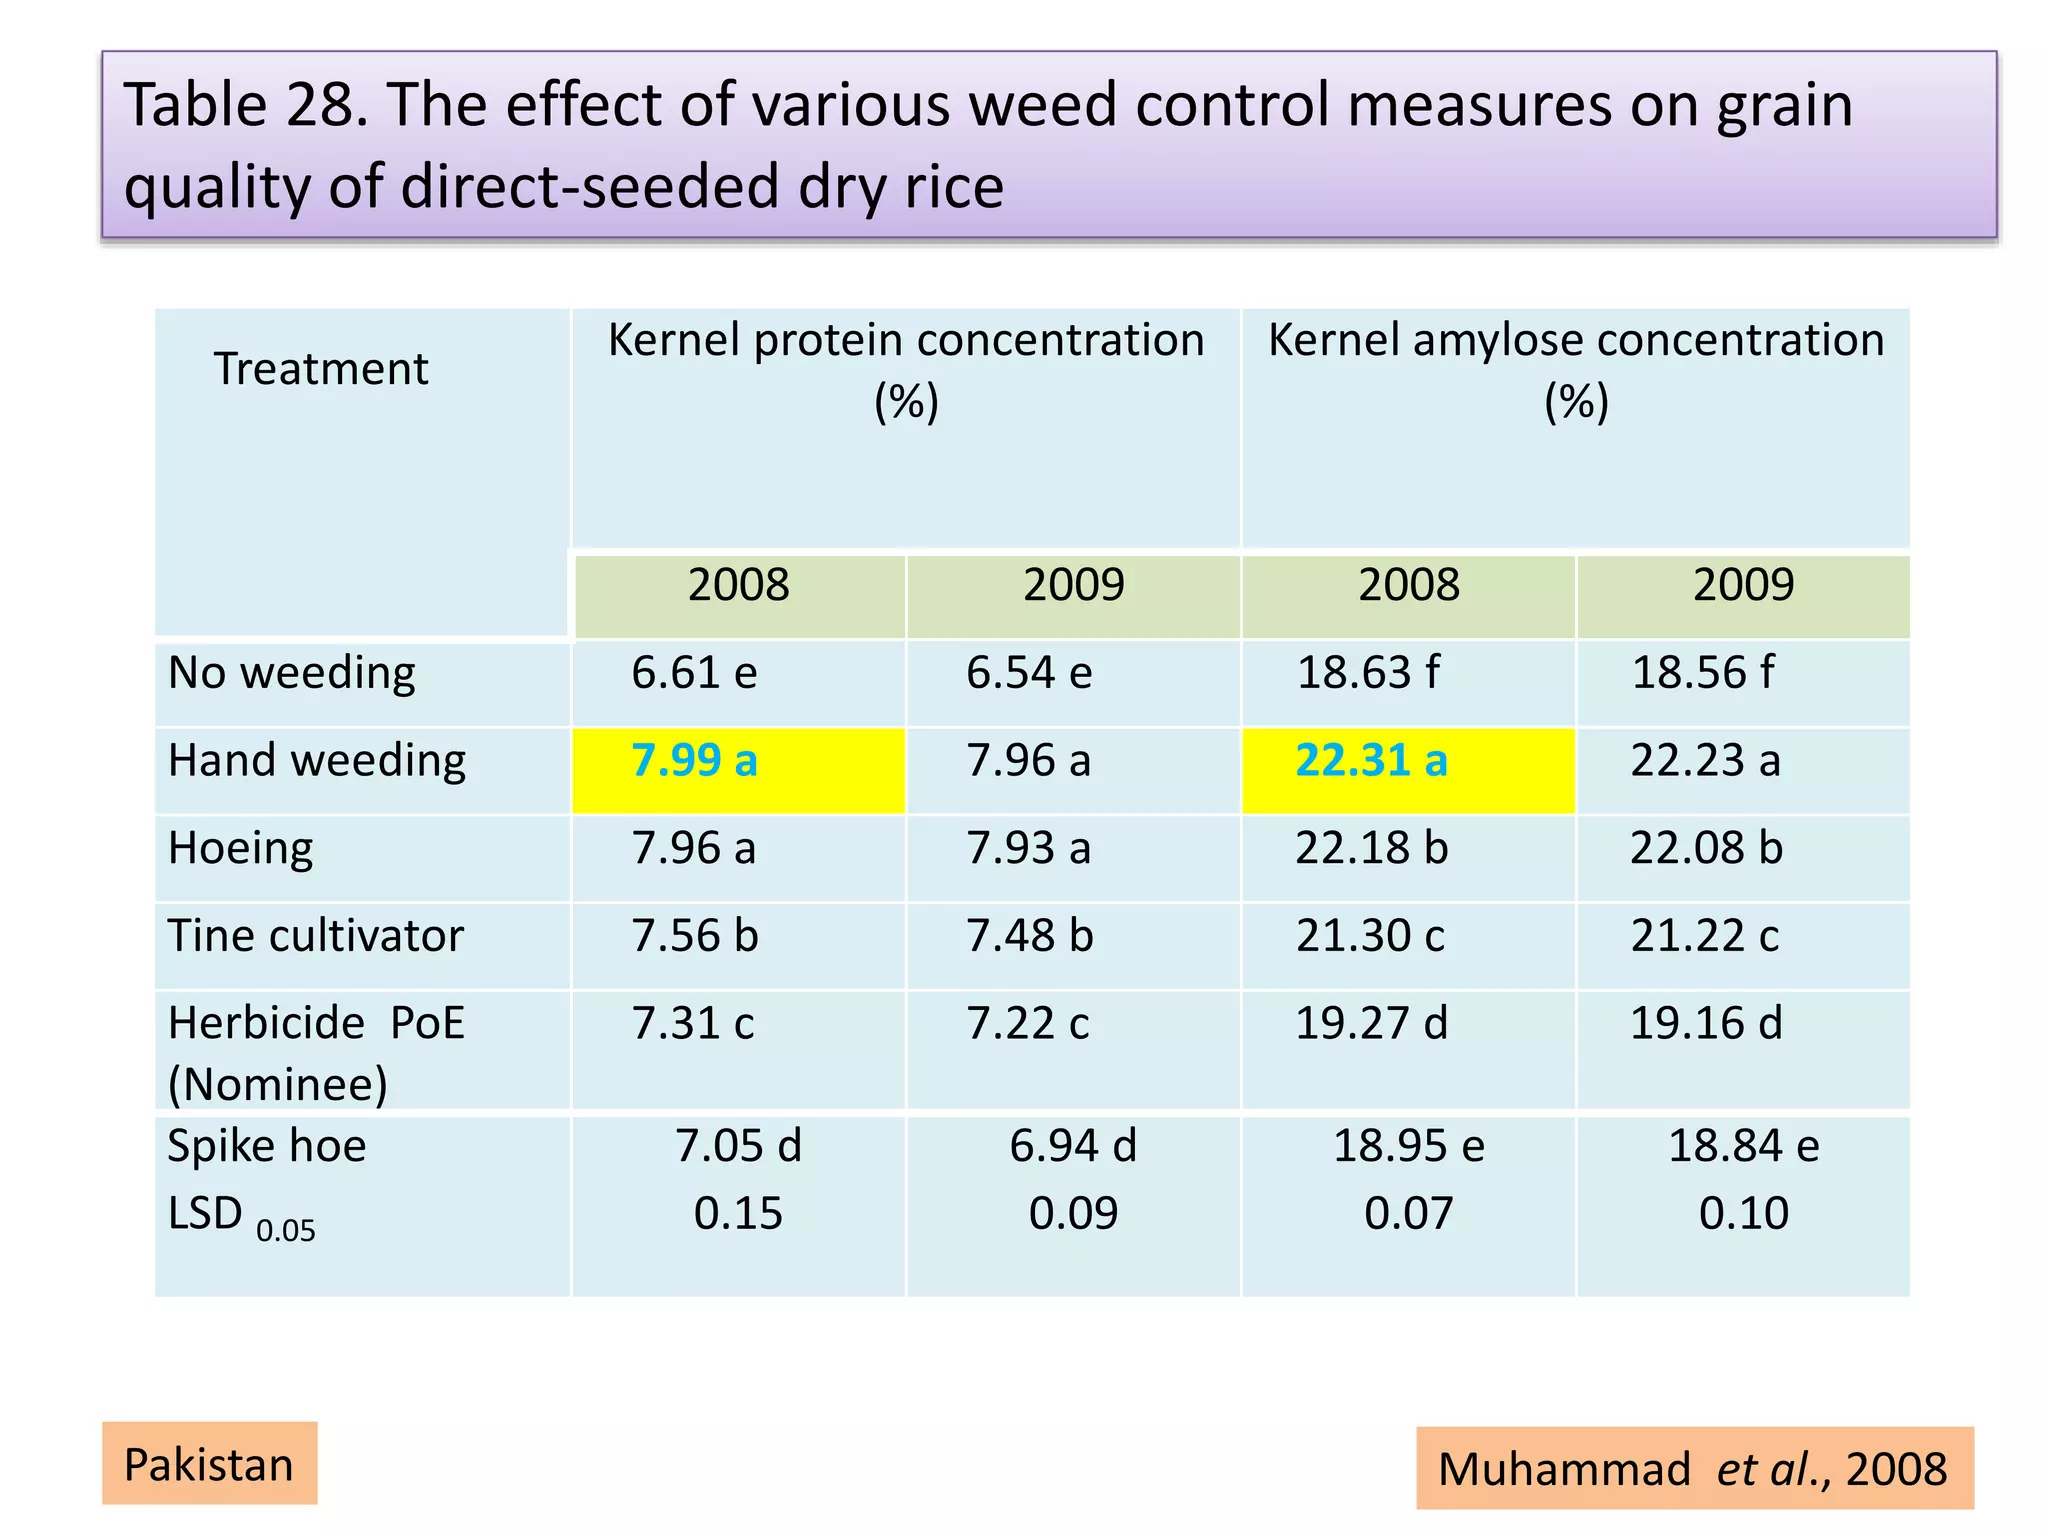
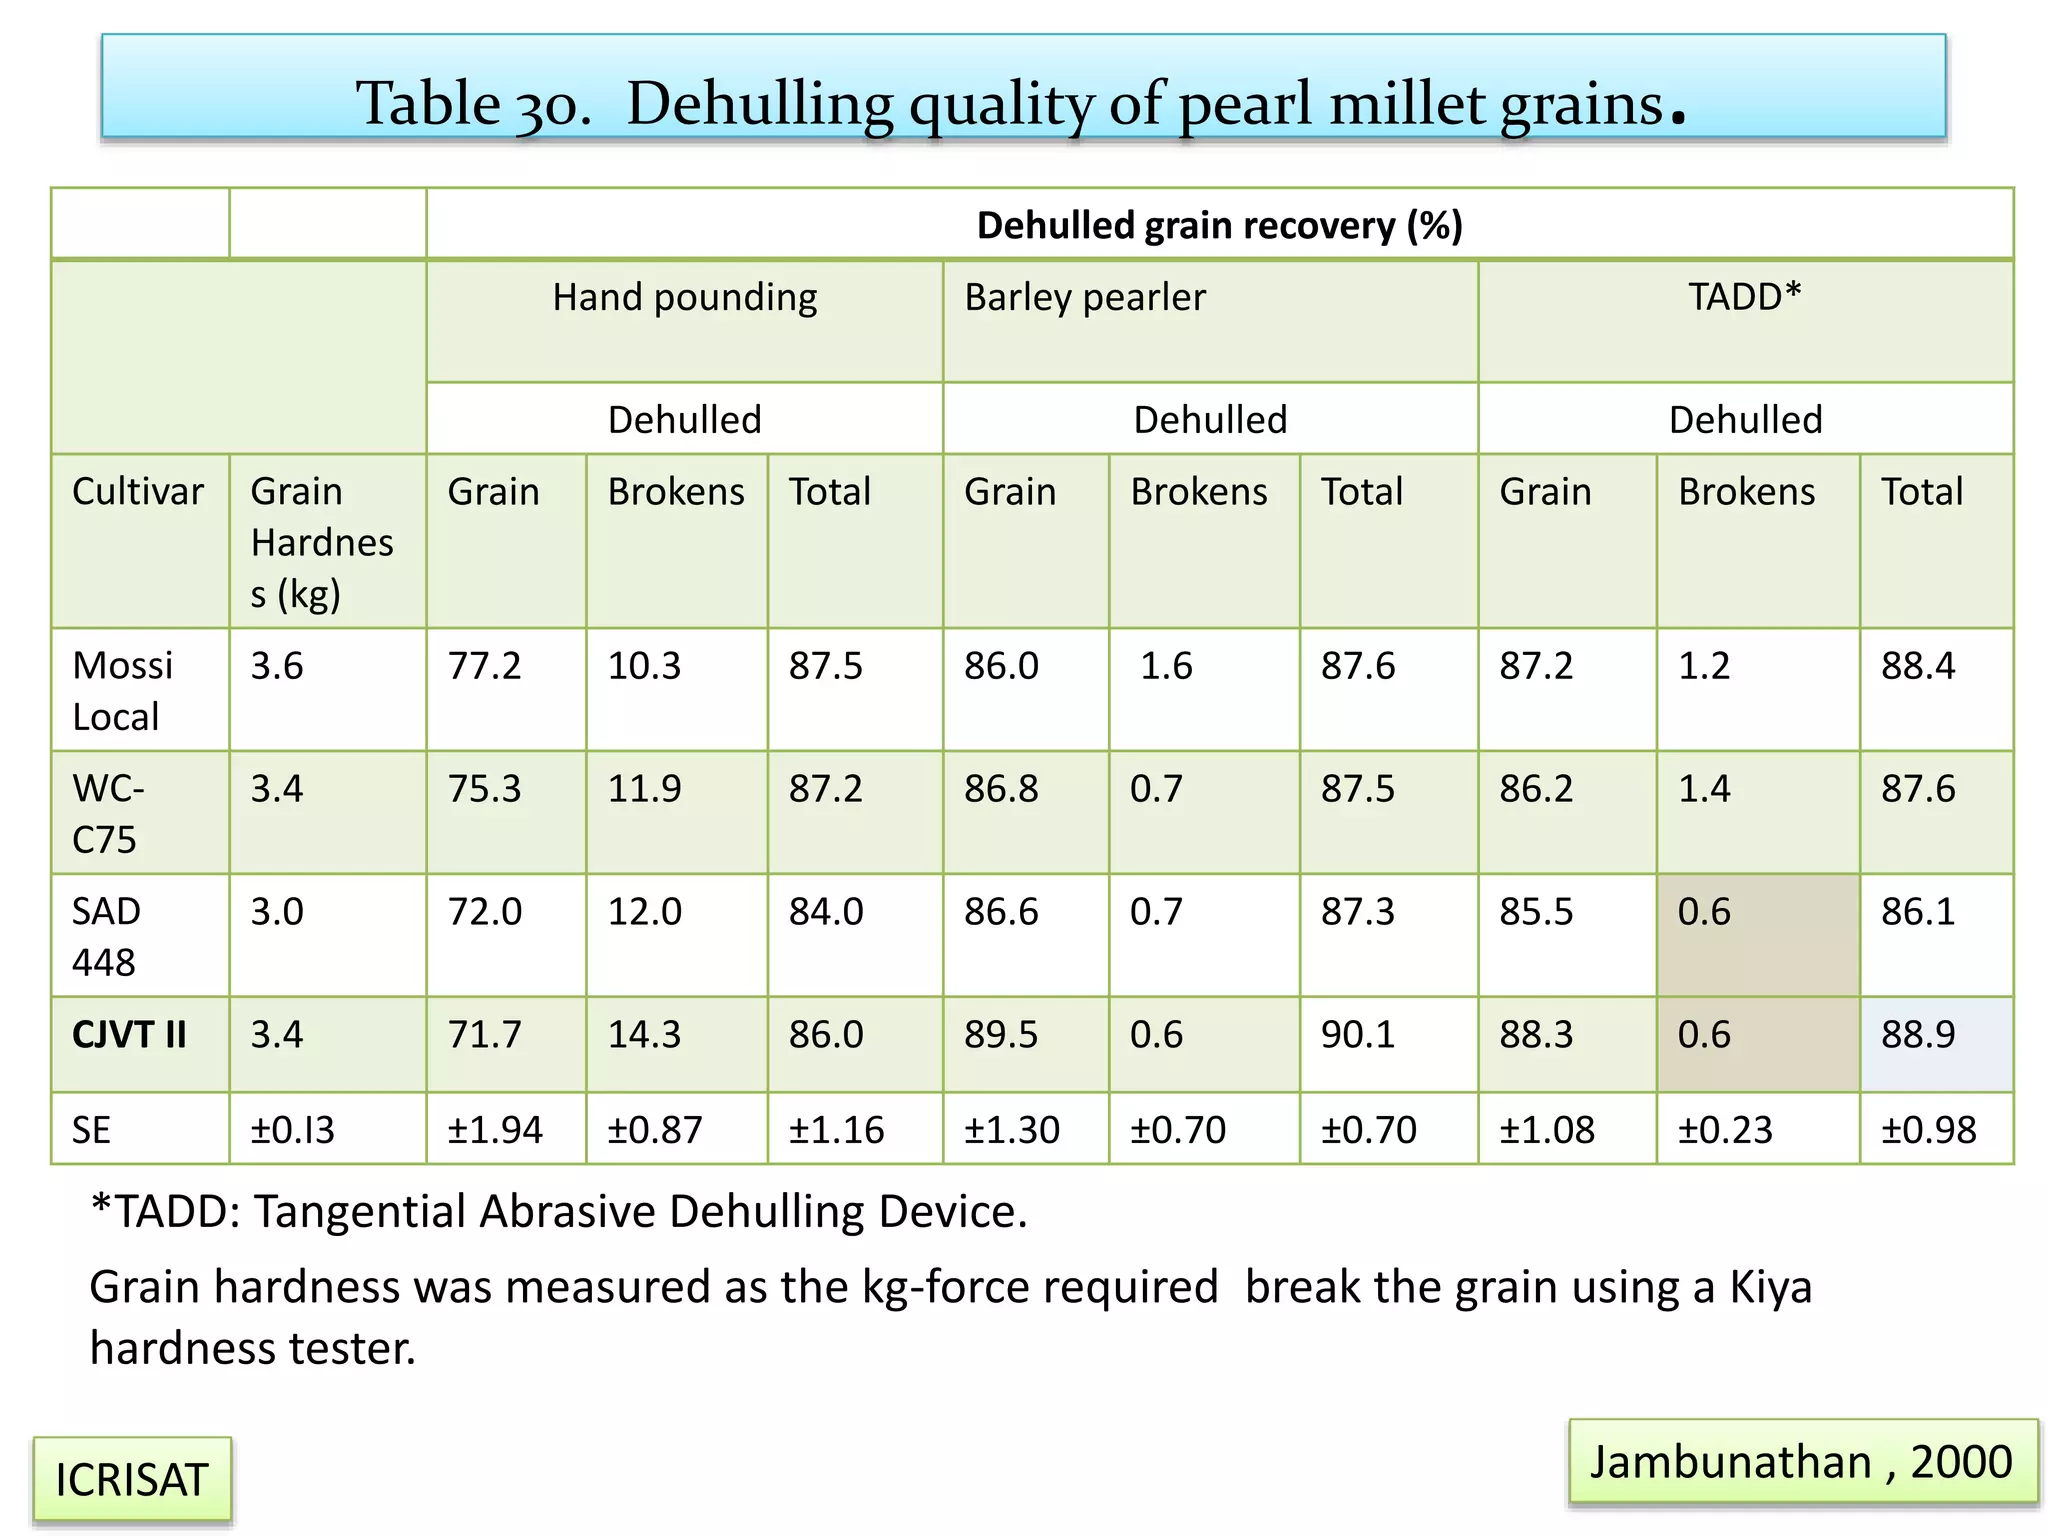
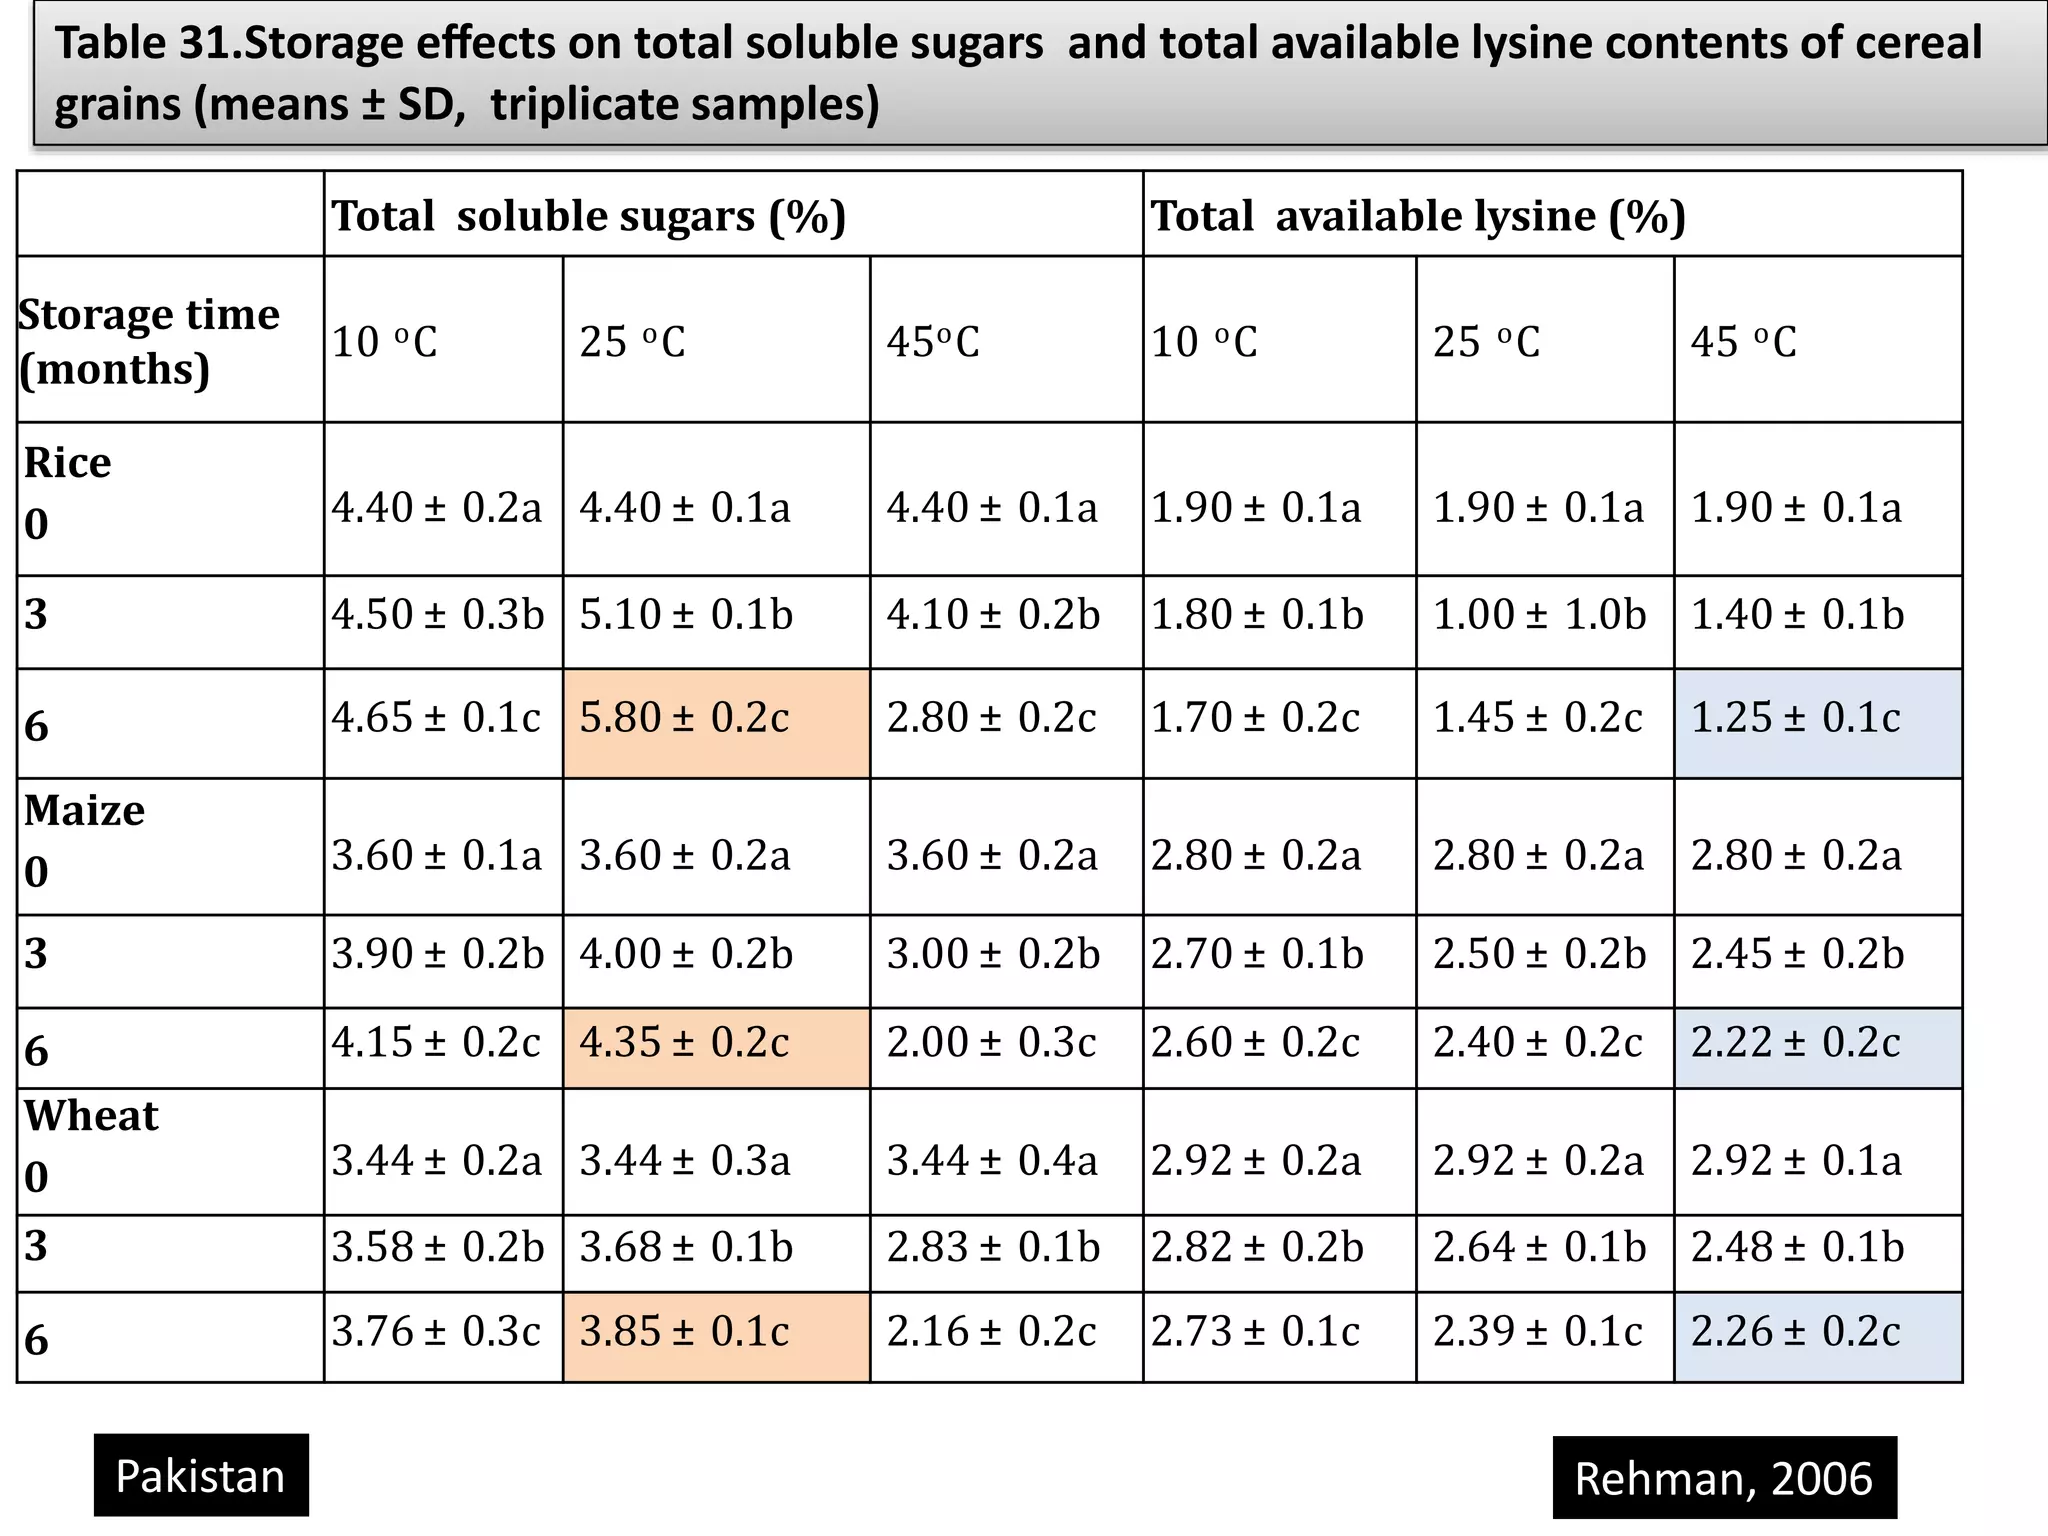
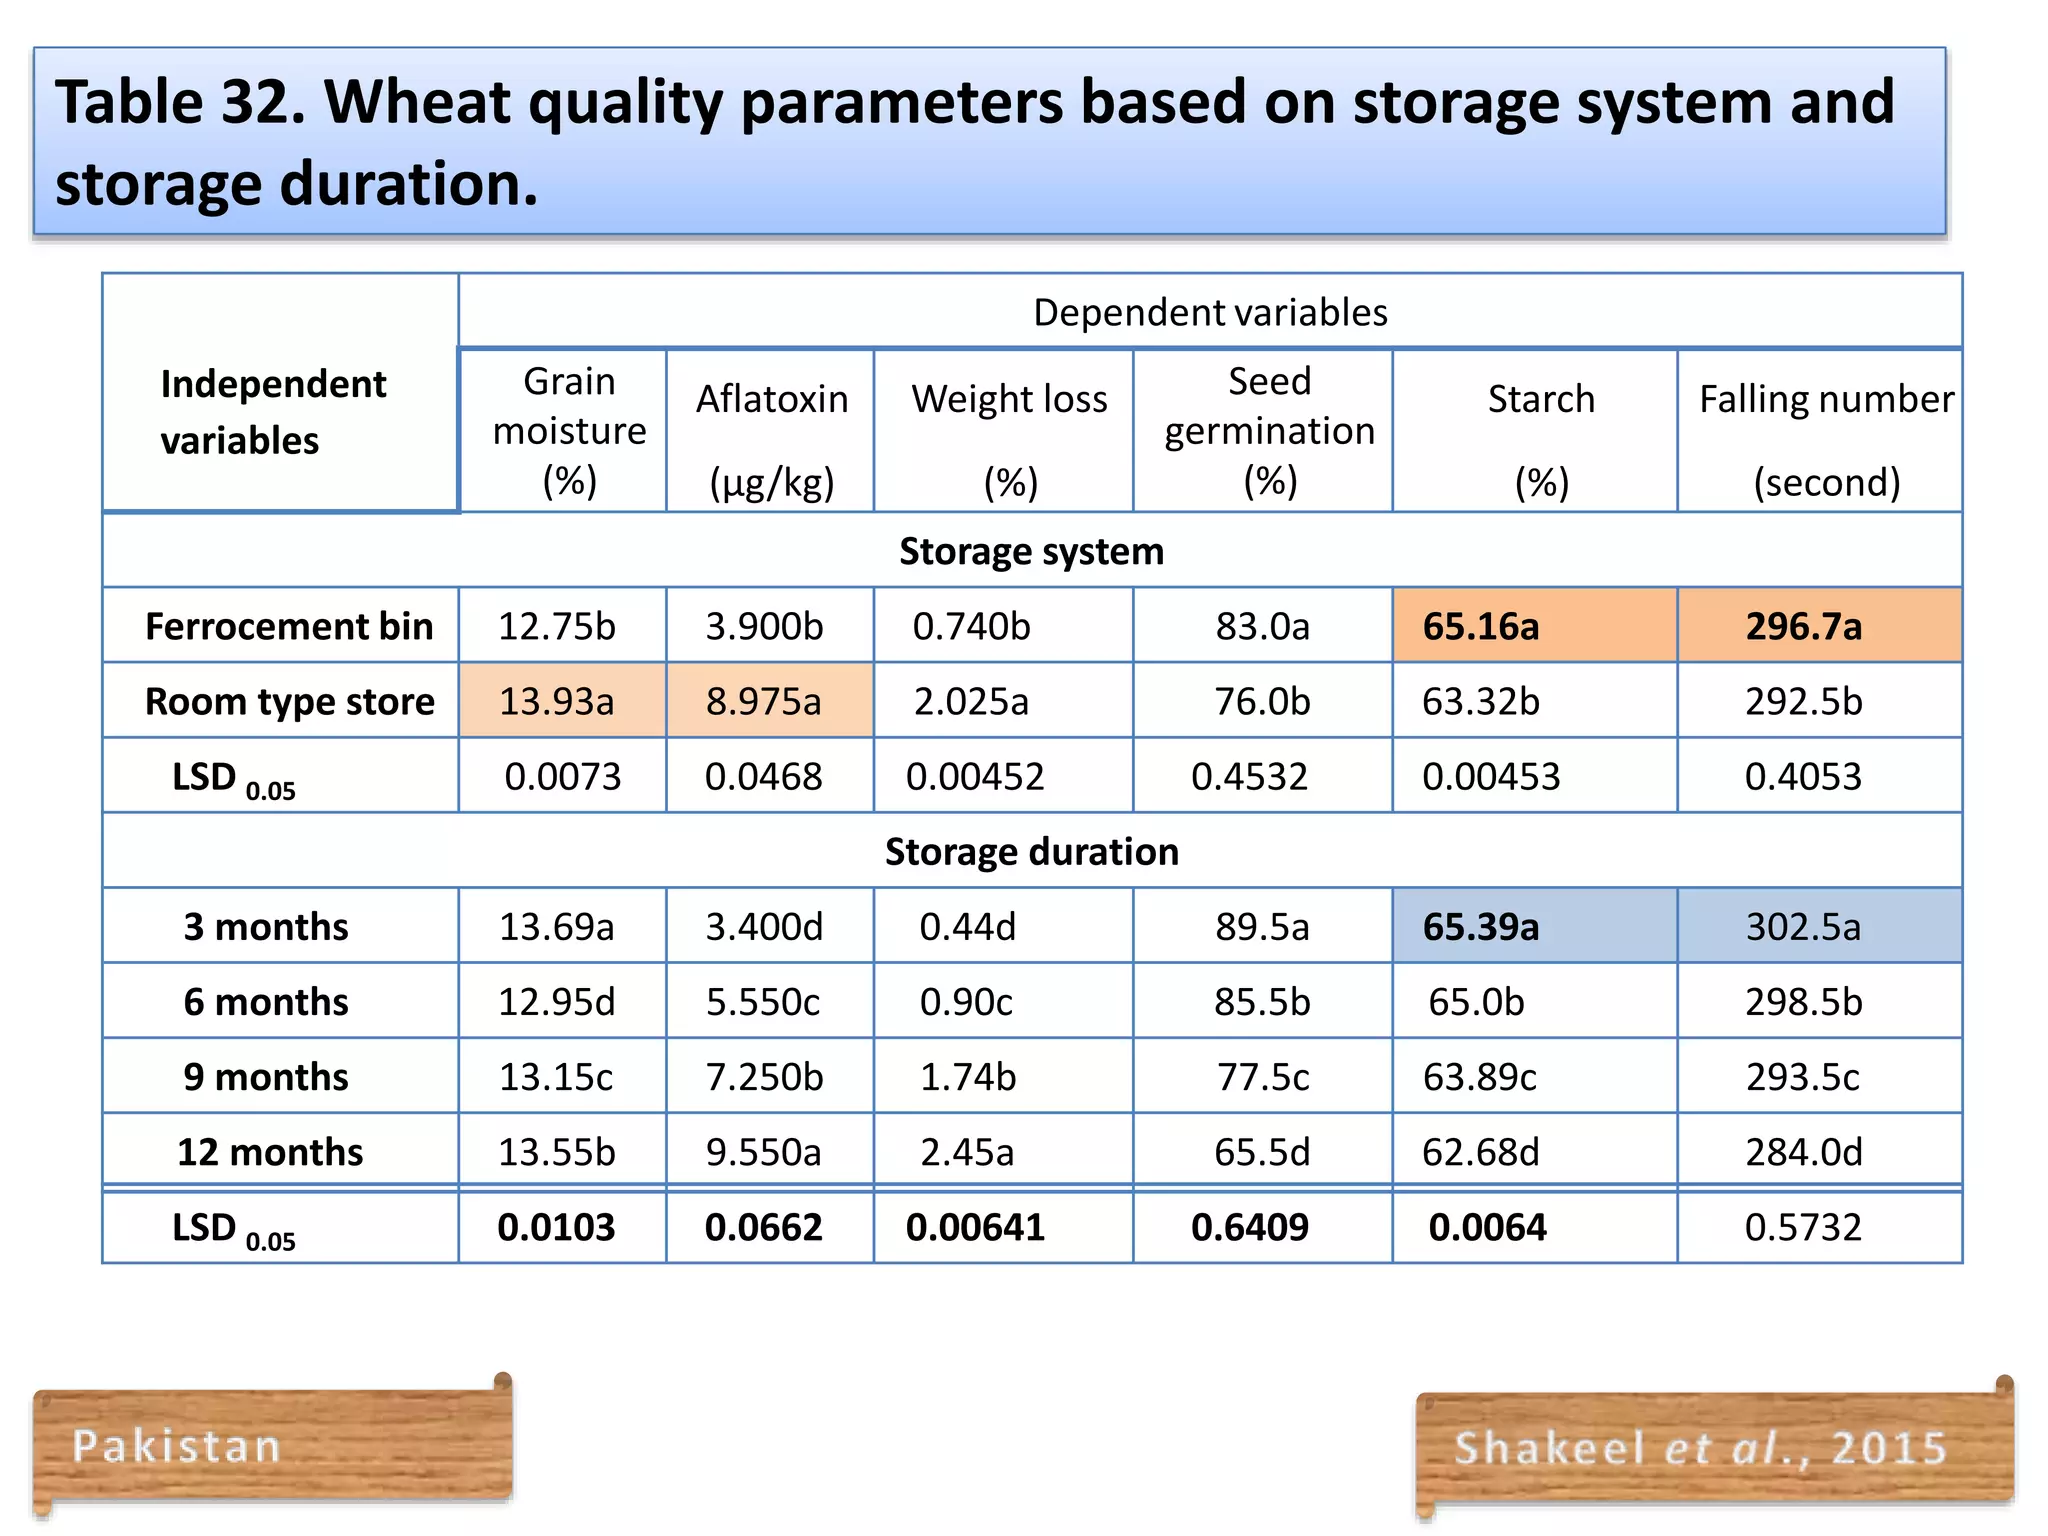
Gurunath Upparatti
Sr.M.Sc (Agri.)
Dept. of Agronomy
GKVK ,Bengaluru
Sequence of presentation
Introduction
Factors affecting grain
quality
Case studies
Agronomic biofortification
Post harvest studies
Conclusion
Future line of work
Table 1. Daily requirement (g/day)
WHO , 2014
Cereal Protein(g) Fat (g) CHO(g) Crude
Fiber
(g)
Ash (g) Energy
(kcal)
Calcium
(mg)
Iron
(mg)
Thiami
n
(mg)
Niacin
(mg)
Riboflavin
(mg)
Wheat 11.6 2.0 71 2.0 1.6 348 30 3.5 -- 5.05 0.101
Brown
rice 7.9 2.7 76 1.0 1.3 362 33 1.8 -- 4.31 0.043
Maize 9.2 4.6 73 2.8 1.2 358 26 2.7 -- 3.57 0.197
Sorghum 10.9 3.2 73 2.3 1.6 329 27 4.3 -- 2.83 0.138
Pearl
millet 11.0 5.0 69 2.2 1.9 363 25 3.0 0.3 2.0 0.15
Foxtail
millet 9.9 2.5 72 10.0 3.5 351 20 4.9 --- 0.99 0.099
Finger
millet 6.0 1.5 75 3.6 2.6 336 350 5.0 0.3 1.4 0.10
Kodo
millet 11.5 1.3 74 10.4 2.6 353 35 1.7 0.15 … …
Japanese
Barnyard
millet 10.8 4.5 49 14.7 4.0 … 22 18.6 … … …
Proso millet
10.6 4.0 70 12.0 3.2 364 8 2.9 4.54 0.279
Anon.,2015
Table 2. Nutritional composition of cereal grains
Health benefits of cereals
Country Production (Metric Tons)
1 China 422,599,164
2 United States 387,397,546
3 India 226,330,000
4 Russian Federation 74,465,000
5 France 69,676,000
FAOSTAT (2014)
Factors affecting grain quality
• Growing practices
• Time and type of harvest
• Postharvest handling
• Storage management and
• Transportation practices.
Case studies
Table 4 : Wheat grain quality traits depending on soil complex
Grain quality traits
Experimental factors Gluten content
(%)
Gluten index Protein content
(%)
Very good wheat complex (black
earth )
29.3 48.2 12.5
Good wheat complex
(brown alluvial)
30.8 50.5 12.8
Good wheat complex
(loess)
32.8 52.3 13.2
Very good rye complex 31.8 70.6 13.4
Defective wheat complex
Limestone soil
34.3 77.3 14.8
Good rye complex 32.8 72.4 14.1
LSD ( 0.05) 2.07 3.17 1.55
Bryza 32.0 66.0 13.6
Hewilla 31.9 51.6 13.3
LSD ( 0.05) NS 12 NS
Poland Alicja et al ., 2008
Previous crop
(PC)
Tillage systems (TS)
Mean
CT RT HT
Wheat protein (% )
Oats 14.3 12.7 13.7 13.4
Durum wheat 14.2 12.8 13.4 13.6
Pea 14.7 13.8 14.0 14.2
Mean 14.4 13.1 13.7 -
LSD0.05 for TS = 0.27, PC = 0.27, TS x PC = 0.62
Table 5. Effect of tillage system and previous crop on grain yield and grain
quality of wheat
CT = conventional tillage; RT = reduced tillage; HT = herbicide tillage (Glyphosate
spray 4 L ha-1)
Poland Andrzej et al ., 2014
Year 24,700 39,500 54,300 69,100 84,000
starch
----------------------------------------------------------- % -----------------------------------------------
1991 63.6 63.4 63.9 63.3 63.8
1992 65.6 64.8 65.5 66.2 66.2
1993 66.7 67.1 68.5 69.1 68.8
1994 62.9 63.0 63.2 63.9 63.8
Mean 64.7 64.6 65.3 65.6 65.7
Plant Population (plants ha-1)
Table 6 . Extractable starch as influenced by year and plant population
interaction effects in maize.
Significant Contrasts: (1991 + 1994 vs. 1992 + 1993) Plant Population Linear
(1992 vs. 1993) Plant Population Linear
Stephen et al., 2008USA
Treatments Plant height(cm) Grain yield
(q/ha -1)
N content in
grains
Crude
protein(%)
Control 150.00 32.00 0.96 6.0
100% RDF* 163.00 44.00 1.54 9.6
PSB 153.10 34.00 1.41 8.8
PSB + 100% RDF 164.00 45.00 1.57 9.8
PSB + 50% RDF 162.00 42.86 1.51 9.4
PSB + 25% RDF 160.00 42.00 1.46 9.1
VAM 152.15 33.96 1.30 8.1
VAM + 100% RDF 163.38 44.96 1.58 9.9
VAM + 50% RDF 161.10 42.82 1.52 9.5
VAM + 25% RDF 158.80 41.97 1.48 9.2
VAM + PSB + 50% RDF 166.00 46.00 1.60 10.0
VAM + PSB + 25% RDF 160.92 42.20 1.50 9.3
CD0.05 2.45 1.75 0.013 0.035
*RDF = Recommended dose of P fertilizer(60kg/ha)
Table 7. Effect of PSB (Bacillus subtilis) and VAM (endomycorrhiza) on
growth, yield and quality of maize (Zea mays L.)
Fozia et al., 2015Jammu & Kashmir (India)
Treatments
Oil
content
(%)
Protein
content
(%)
O. matter
concentration
(%)
T1 5.82 a 8.12 g 0.72 c
T2 5.80 a 8.31 fg 0.77 bc
T3 5.47 b 8.37 f 0.39 g
T4 5.43 b 8.82 e 0.82 b
T5 4.95 de 9.24 c 0.61 d
T6 4.90 def 9.32 c 0.54 e
T7 5.22 c 9.02 de 0.34 g
T8 4.78 ef 9.54 b 0.39 g
T9 5.09 cd 9.17 cd 0.39 g
T10 4.50 g 10.26 a 1.07 a
T11 4.74 f 10.23 a 0.52 e
T12 4.72 f 10.19 a 0.45 f
CD0.05 0.03 0.23 0.16
Table 8 - Effect of organic mulches and tillage on grain quality of
maize
Zamir et al., 2013Pakistan
T1= conventional tillage,
T2= conventional tillage + wheat straw mulch
(partially incorporated),
T3= conventional tillage + saw dust mulch
(partially incorporated),
T4= zero tillage,
T5= zero tillage + wheat straw mulch (partially
incorporated),
T6= zero tillage + saw dust mulch (partially
incorporated),
T7= bar harrow tillage
T8= harrow tillage + wheat straw mulch
(partially incorporated),
T9= harrow tillage + saw dust mulch (partially
incorporated),
T10= subsoiler tillage (subsoiler)
T 11= sub soiler tillage + wheat straw mulch
(partially incorporated)
T12= subsoiler tillage + saw dust mulch
(partially incorporated)
Milling quality
Transplanting dates BR (%) TMR (%) HR (%)
D1 78.9 70.3 48.8
D2 79.7 71.2 55.4
D3 80.3 71.3 59.4
D4 79.9 72 62.8
S.D. (Mean) ± 0.589 ± 0.698 ± 6.016
Average 79.7 71.2 56.6
D1: 5th May D2: 27th May D3: 18th June D4: 10th July
Table 9. Effect of transplanting dates on milling quality of
rice
BR : brown rice TMR : total milling recovery HR :head rice CGL : coarse grain rice lines
Muhammad et al ., 2016Faisalabad, Pakistan
Sowing
method ×
Variety
Nitrogen in
straw (%)
Nitrogen in
grain (%)
Protein in
straw (%)
Protein in
grain (%)
Grain
yield
(t ha-1)
S1×V1
S1×V2
S1×V3
S1×V4
S2×V1
S2×V2
S2×V3
S2×V4
0.278 d 2.035 1.667 d 11.895 d
0.281 cd 1.936 1.756 cd 11.315 e
0.294 b 2.078 1.825 bc 12.115 c
0.315 b 2.085 1.947 bc 12.189 bc
0.319 b 2.114 2.010 b 12.312 ab
0.310 b 2.123 1.967 bc 11.967 d
0.312 b 2.110 1.989 b 12.321 ab
0.456 a 2.131 2.904 a 12.441 a
0.01 NS 0.01 0.01
0.41 3.92 5.01 0.61
2.29 f
2.81 de
2.94 c
3.04 bc
2.69 e
2.92 cd
3.07 b
3.25 a
LS NS
CV % 9.05
Table 10. Interaction effect of sowing method and variety on quality
traits and yield of wheat
conventional sowing (S1) Bed sowing (S2 )
Protiva (V1), Sourav (V2), Shatabdi (V3) and Prodip (V4)
Alam , 2012Bangladesh
Treatment Grain yield (kg ha-1 ) Protein (g kg-1 )
1988–1989 1989–1990 1990–1991 Mean
1988–
1989
1989–
1990 1990–1991 Mean
Tillage
NT 2350a2 4500b 2510a 3120a 110a 104a 107b 107b
CT 1750b 5060a 2790a 3200a 113a 108a 113a 111a
Rotation
CW 1630d 3720c 1700d 2350e 107d 110a 108b 109b
WS 1580d 4870b 2430c 2960d 109cd 105b 104c 106c
WCP 1920c 4830b 2740b 3170c 113ab 107ab 114a 111a
WFB 2270b 5430a 3580a 3760a 116a 104b 115a 112a
WF 2830a 5020b 2800b 3550b 112bc 106b 108b 109b
N rate (kg ha-1)
50 2020a 4400c 2560b 2990b 99c 106a 99c 101c
100 2130a 4820b 2730a 3230a 113b 107a 108b 110b
150 1990a 5110a 2650a 3250a 122a 106a 123a 117a
Mean 2050C 4780A 2650B 3160 112A 106B 110A 109
Table 11. Wheat grain yield, protein as affected by tillage methods, crop rotation
and nitrogen rate.
NT, no tillage; CT, conventional tillage; CW, continuous wheat; WS, wheat–sunflower; WCP, wheat–
chickpea; WFB, wheat–fababean; WF, wheat–fallow.
IRRI Consuelo , 1992
Treatments
Plantation methods
M1 = 70 cm spaced single rows
Grain
starch
concentrati
on (GSC)
(%)
71.51 b
Grain protein
concentration (GPC)
(%)
9.07 b
Grain oil
concentration
(GOC) (%)
4.63 b
M2 = 105 cm spaced double row strips 71.76 a 9.28 a 4.72 a
M3 = 70 cm spaced ridges 71.75 a 9.26 a 4.74 a
LSD 5% 0.08 0.04
Nutrient levels (kg ha-1)
N P K S
F0 0 0 0 0 70.72 c 7.84 e 4.08 e
F1 250 0 0 0 69.69 d 9.06 d 4.55 d
F2 250 150 0 0 71.39 b 9.34 c 4.71 c
F3 250 150 100 0 72.31 a 9.39 bc 4.78 bc
F4 250 150 100 15 72.32 a 9.64 a 4.96 a
F5 250 150 100 0 72.46 a 9.50 b 4.83 b
F6 250 150 100 15 72.50 a 9.64 a 4.96 a
LSD 0.05 0.45 0.13 0.11
Table 12. Effect of different planting methods and nutrient levels on
qualitative traits of hybrid maize
Muhammad et al ., 2004Faisalabad ,Pakistan
Treatment
Grain
yield
( t /ha)
Stover
yield
( t/ha)
Total N
uptake
(kg/ha)
Total P
uptake
(kg/ha)
Protein
content
(%)
B:C
ratio
Land configuration
LI: Flat sowing 2.33 6.36 78.24 29.45 11.42 0.88
L2: Ridge and furrow sowing 2.62 7.31 90.39 34.39 11.53 0.98
SEm + 0.05 0.13 1.47 0.54 0.07 0.03
CD (P=0.05) 0.14 0.38 4.36 1.61 NS 0.10
Nutrient management
Fo: Control 2.06 5.81 63.48 24.11 11.08 0.86
F1: 30 kg N + 20 kg P205/ha 2.45 6.65 81.40 30.65 11.48 0.98
F2: 60 kg N +40 kg P205/ha 2.70 7.45 97.14 37.13 11.65 0.96
F3:30 kg N + 20 kg P205 +
FYM @ 6 tonnes/ha 2.75 7.54 99.14 37.42 11.85 0.94
F‘4: FYM @ 6 tonnes/ha 2.46 6.59 80.42 30.30 11.36 0.91
SEm + 0.07 0.20 2.32 0.86 0.11 0.06
CD (P=0.05) 0.22 0.59 6.89 2.55 0.32 NS
Table 13. Effect of land configuration and nutrient management practices on
quality of pearl millet
Parihar et al., 2009IARI ,New Dehli
Character Genotype
Main
culm(MC)
Primary
tiller(PT)
Secondary
tiller(ST)
Tertiary
tiller(TT)
Mean
CV(%)
Brown rice rate (%) Xiushui 11 83.94 a 83.51 a 83.66 a 83.85 a 83.67 0.34
Mutant 84.49 a* 84.03 a 84.63 a 85.18 a*
84.59
**
0.56
Amylose content of rice
(%)
Xiushui 11 16.32b 17.98 a 15.68 bc 14.93 c 16.23 8.00
Mutant 16.48a 15.61 a** 15.22 a 12.93 b* 14.58* 9.93
Protein content of rice (%) Xiushui 11 10.72a 10.23 b 9.74 b 10.22 b 10.23 3.89
Mutant 9.84 a* 9.49 b* 8.84 c* 8.49 d** 9.17* 6.63
Table 14. Grain yield and panicle characteristics of different tillers in rice
*,** indicate significant difference between Xiushui 11 and the mutant for a given characteristic at 95% and 99%
probability levels, respectively.
Wang et al ., 2007China
Day/night
temperature ( oC) Water a Fertilizerb Protein (%)
24/17 ‡ ‡ 16. 9
37/17 ‡ ‡ 18 .8
37/28 ‡ ‡ 17. 3
24/17 ‡ ÿ 9 .8
37/17 ‡ ÿ 13. 5
37/28 ‡ ÿ 17 .6
37/17 ÿ ‡ 20. 0
37/17 ÿ ÿ 17. 4
a Plants were well-watered (‡) or drought-treated (ÿ).
b Plants received post-anthesis fertilizer (‡) or did not receive post-anthesis fertilizer (ÿ).
Table15.Effect of temperature, fertilizer and water on composition of mature
grain of spring wheat
Altenbach, 2001USA
Table 16. Effect of lodging on milling and baking qualities wheat
"Wheat cultivars: samples I, 3, and 5 = Stephens; sample 2 = Twin; sample
4 = Hyslop.
Pumphrey et al ., 1994Washingaton
Figure 1 View of the lodging induction method applied: A – General and B – Detailed
Intensity 1 – 50% lodging or plants inclined45°
Intensity 2 – 100% lodging or plants inclined 90°
Protein (%)
Treatments 2004 2005
Wheat sole crop 11.2% 10.2%
Wheat +Faba bean 13.0% 12.5%
Table 17. Average protein content (%) in wheat grown as a sole
crop or intercropped with faba beans.
Isobel et al ., 2008Europe
Year
Factors Grain yield
(t ha-1 )
1000 kernel
weight (g)
Protein content (%)
Variety Water
2013 EGA-Gregory Rainfed 1.63b 24b 11.9a
Irrigated 3.65a 37a 6.9b
Livingston Rainfed 1.99b 27b 8.7a
Irrigated 3.00a 34a 7.5b
LSD5%
variety × irrigation 0.8 4 1.2
2014 EGA-Gregory Rainfed 4.68b 35c 8.7b
Irrigated 6.01a 40a 7.6b
Livingston Rainfed 4.21b 36bc 10.3a
Irrigated 4.53b 37b 7.5b
LSD5%
variety ×irrigation 0.47 2 1.4
Table 18. The average grain yield and grain qualities of wheat .
Nendel et al.,2015Australia
Treatments Grain yield
Plant -1(g) 1000-grain
weight (g)
Grain protein
content (%)
I1
1.91a 45.75a 14.95d
I2
1.61b 43.00ab 15.25c
I3
1.46c 40.76b 15.25c
I4
1.23d 42.40ab 15.90b
I5
0.91e 31.21c
17.30a
LSD0.05
0.14 4.46 0.10
I1 = 7 irrigation (Control), I2 = 6 irrigations, I3 = 5 irrigations, I4 = 4 irrigations, I5 = 3 irrigations.
Table 19. Means of five irrigation treatments for yield and yield
components traits of barley (data over two seasons).
Saied et al., 2014Egypt
Stress
intensity Period Nerica 1 Nerica 4 Nerica 7 Arica 4 Arica 5
L0 FC DS 2013 9.4 9.3 9.0 9.0 9.0
L1 LS 9.4 9.3 9.0 8.8 9.1
L2 MS 9.8 10.0 10.2 9.7 9.6
L3 SS 10.8 9.9 11.6 11.0 10.0
Mean 9.9 9.6 10.0 9.6 9.5
CV (%) 6.7 4.4 12.3 10.2 4.8
LSD 0.8 1.2 0.8 1.5 1.0
L0 FC WS 2014 9.0 9.3 8.5 9.0 9.0
L1 LS 9.3 9.0 9.0 9.2 9.2
L2 MS 9.8 9.9 10.0 9.8 9.8
10.9 11.1 11.7 11.2 10.8L3 SS
Mean 9.8 9.8 9.8 9.8 9.7
CV (%) 8.5 9.2 14.4 10.2 8.1
LSD.05 0.4 0.5 1.0 0.6 0.5
Table 20.Effect of different soil moisture levels on protein content of tested
varieties of rice during dry season(DS) 2013 and wet season(WS) 2014.
Roseline et al., 2014Nigeria
L0 : Field capacity L1:Low stress L2: Moderate stress L3: Severe water stress
NERICAs (New Rice for Africa) , ARICA (Advanced Rice for Africa)
Starter
Fertilizer Yield(g m-2) Protein Grain size >2.5mm (%)
concentration(%)
Applied 343.2a 11.1a 97.8a
Not applied 354.6a 10.7a 98.6a
Soil locations
Laxmans Åkarp 311.9b 11.3a 96.8b
Lunnarp 385.8a 10.5b 99.6a
Treatments
Treatment 1 296.9a 11.7a 96.0b
Treatment 2 326.9a 10.9b 97.6ab
Treatment 3 389.5a 10.5b 99.6a
Treatment 4 382.2a 10.5b 99.6a
Treatments Soil location Starter fertilizer
1 Laxmans Åkarp Applied
2 Laxmans Åkarp Not applied
3 Lunnarp Applied
4 Lunnarp Not applied Malik et al., 2012Sweden
Table 21.Mean values of yield and quality parameters at maturity of
spring malting barley at starter fertilizer dosage, two soil locations
and four different treatments
Treatment Zn (µg g-1 ) Fe (µg g-1 ) Protein (%)
S1 = Control without Zn and Fe 12.42 31.34 7.93
S2 = ZnSO4 at 20 kg per ha+ FeSO4 at 10 kg per ha through Soil
application
20.68 57.10 10.99
S3 = ZnSO4 at 0.2 % and FeSO4 at 0.1 % as Seed treatment 21.73 71.96 10.75
S4 = ZnSO4 at 0.2 % and FeSO4 at 0.1 % as Seed treatment + Foliar
spray of ZnSO4 at 0.5 % and FeSO4 at 0.1 % at panicle initiation
and boot leaf stage
23.69 85.44 12.24
S.Em± 0.72 5.35 0.62
C.D0.05 2.14 15.91 1.85
Table 22 : Zn, Fe and Protein content in dehusked rice as influenced by agronomic
biofortification
Meena et al.,2015V.C. Farm, Mandya
Sowing
method × N
level
Nitrogen in
straw (%)
Nitrogen in
grain (%)
Protein in
straw (%)
Protein in
grain (%)
Grain yield
(t ha-1)
S1×N0
S1×N1
S1×N2
S1×N3
S2×N0
S2×N1
S2×N2
S2×N3
0.215 h 1.878 d 1.350 e 10.956 g
0.241 g 1.945 d 1.507 de 11.378 f
0.325 d 2.089 ab 2.067 c 12.201 c
0.384 b 2.241 a 2.315 b 13.021 a
0.246 f 2.056 abc 1.524 d 11.535 e
0.273 e 2.027 bcd 1.656 d 11.856 d
0.369 c 2.167 ab 2.301 b 12.645 b
0.536 a 2.245 a 3.356 a 13.088 a
0.01 0.05 0.01 0.01
0.41 3.92 5.01 0.61
1.74 e
2.69 d
3.22 c
3.42 bc
1.81 e
2.84 d
3.48 b
3.81 a
LS
CV %
0.05
9.05
Table 23.Interaction effect of sowing method and N rates on quality
traits and yield of wheat
conventional sowing (S1) Bed sowing (S2 )
0 (N0), 60 (N1), 110 (N2) and 160 (N3) kg N ha-1.
Alam, 2012Bangladesh
Treatment
N
(%)
Ca
(%)
Fe
(ppm)
Zn
(ppm)
Protein
(%)
Total Amino
Acid (%)
CHO
(%)
T1: RDF* 1.3 1.8 230.0 33.7 8.5 2.40 65.3
T2: 150 % RDF 1.4 1.6 220.2 35.1 8.8 2.46 67.7
T3:T1+ZnSO4 @ 50 kg ha-I as soil
application 1.0 1.1 200.2 71.2 6.7 1.80 61.7
T4:T1 + ZnSO4 @0.5 % foliar spray 1.0 1.2 216.1 75.9 6.5 1.90 61.3
T5: T1+ FeSO4@ 0.2 % foliar spray 1.1 1.4 722.3 34.6 7.0 2.43 65.0
T6: T1+ ZnSO4 soil application + FeSO4 0.2 %
foliar spray 1.1 1.5 720.8 84.5 7.0 2.20 64.3
T7: T1 + ZnSO4 0.5 % foliar spray + FeSO4 0.2
% foliar spray 1.2 2.6 712.0 87.3 7.6 2.43 66.0
T8: T2+ ZnSO4 @ 50 kg ha-1 as soil
application 1.0 2.0 219.3 62.7 6.5 2.70 64.7
T9: T2 + ZnSO4 0.5 % foliar spray 1.2 2.4 250.7 86.9 7.5 3.50 68.3
T10: T2+ FeSO4 0.2 % foliar spray 1.4 2.2 725.7 31.8 8.7 3.90 66.0
T11: T2+ ZnSO4 soil application + FeSO4 0.2 %
foliar spray 1.3 2.3 698.9 76.3 8.0 4.10 68.3
T12: T2+ ZnSO4 0.5 % foliar spray + FeSO4 0.2
% foliar spray 1.4 2.7 753.2 85.7 9.0 4.33 69.3
CD (P = 0.05) 0.049 0.6 43.8 4.5 0.3 0.33 2.5
Sanwer et al.,2012Hyderabad
Table 24.Grain quality parameters of finger millet as influenced by nutrient
management practices
* RDF 40:20:20 N:P2O5: K2O
Levelsof Zn*
(kg ha-1)
Yield
(t ha-1) Total Zn uptake
(g ha-1)
Total
Carbohydrate
(%)
Wet
gluten
(%)Grain Straw
0 3.88 4.76 214.39 60.01 10.05
1.25 3.93 4.81 222.70 61.15 10.30
2.50 4.04 4.88 246.19 64.37 10.93
5.00 4.24 5.09 271.56 65.60 11.89
10.00 4.62 5.42 295.93 69.20 12.19
20.00 4.66 5.44 327.74 70.37 12.37
Mean 4.23 5.06 263.08 65.12 11.28
C.D. (5%) 0.45 0.56 35.33 4.35 0.86
Table 25. Effect of Zn application on yield and total Zn uptake by wheat in Vertisol
(Pooled data of two year)
Keram et al ., 2012Jabalpur
*RDF (120N: 60 P2O5: 40 K2O kg ha-1)+ZnSO4
Nitrogen fertilizer treatment*
(kg/ha)
Rough Head
Rice
Yield (t/ha)
Head Rice
(%)
Head rice yield
(t/ha)
Protein
(%)
PP MT PI PL Total
0 0 0 0 0 5.3c 37.5c 2.0c 5.6c
120 0 60 0 180 9.3b 47.1b 4.4b 7.6b
60 60 60 45 225 9.9a 57.7a 5.7a 9.6a
Table 26. Effect of rate and timing of nitrogen fertilizer
application on rice yield and quality characteristics.
Consuelo et al.,1992IRRI
PP- preplant, MT-Max.tilliring , PI-Panicle intition , PL-Flowering
Table 27. Effect of herbicide treatments on mean carbohydrate%
and protein% of maize, in 2013 and 2014 seasons
Carbohydrate (%) Protein (%)
Treatments
Rate a.i.
g/fed*
2013
season
2014
Season
2013
season
2014
season
Acetochlor 84% EC
(Harness)
840 75.61 cd 77.5 cd 7.9 bc 6.9 e
Acetochlor 84 % CS 1680 84.39 ab 86.5 ab 9.5 ab 9.0 ab
Sulcotrione 15% SC 300 81.62 b 83.4 bc 8.2 b 8.0 ab
Metribuzin 70%WG 420 g 87.27 a 88.4 a 10.1 a 9.5 a
Pendimethalin 45.5% CS
(Stomp Extra)
682.5 80.17 bc 75.3 de 7.5 c 7.2 cde
Pendimethalin 45.5% SC 1365 81.12 b 81.9 c 7.9 bc 7.5 bc
Hand hoeing Twice 82.55 ab 83.8 bc 8.3 b 7.5 bc
Unweeded (control) -------------- 71.7 e 72.42 e 6.8 e 6.6 g
Shaba et al., 2015Egypt *feddan = 4200 m2
Treatment
Kernel protein concentration
(%)
Kernel amylose concentration
(%)
2008 2009 2008 2009
No weeding 6.61 e 6.54 e 18.63 f 18.56 f
Hand weeding 7.99 a 7.96 a 22.31 a 22.23 a
Hoeing 7.96 a 7.93 a 22.18 b 22.08 b
Tine cultivator 7.56 b 7.48 b 21.30 c 21.22 c
Herbicide PoE
(Nominee)
7.31 c 7.22 c 19.27 d 19.16 d
Spike hoe
LSD 0.05
7.05 d
0.15
6.94 d
0.09
18.95 e
0.07
18.84 e
0.10
Table 28. The effect of various weed control measures on grain
quality of direct-seeded dry rice
Muhammad et al., 2008Pakistan
Weed control practices
Kernel
Length(mm
)
Chalky
kernels (%)
Kernel protein
concentration(%)
Kernel amylose
concentration(%)
Kernel water
Absorption
ratio
Control (weedy check)
7.65 d 23.36 b 7.23 b 20.56 b 3.30 cd
Hand pulling (30, 45 and 60
days after sowing) 7.83 a
25.82 a
7.97 a 22.39 a 4.35 a
Mechanical hoeing
(30,45 and 60 days after sowing)
7.81 a
24.85 ab
7.95 a 22.04 a 3.89 ab
Butachlor (1.8 kg a.i. ha-1)
7.75 c
24.14 ab
7.30 ab 19.89 c 3.76 bc
Pendimethalin (1.65 kg a.i. ha-1)
7.77 bc 25.52 a 6.52 c 18.76 d 2.92 b
Pretilachlor (1.25 kg a.i. ha-1)
7.80 ab
24.10ab
7.50 ab 19.33 cd 3.74 bc
LSD at p ≤ 5%
0.03 1.80 0.68 0.62 0.52
Table 29. Effect of weed control practices on quality parameters of direct
sown rice
Nadeem et al ., 2011Pakistan
Table 30. Dehulling quality of pearl millet grains.
Dehulled grain recovery (%)
Hand pounding Barley pearler TADD*
Dehulled Dehulled Dehulled
Cultivar Grain
Hardnes
s (kg)
Grain Brokens Total Grain Brokens Total Grain Brokens Total
Mossi
Local
3.6 77.2 10.3 87.5 86.0 1.6 87.6 87.2 1.2 88.4
WC-
C75
3.4 75.3 11.9 87.2 86.8 0.7 87.5 86.2 1.4 87.6
SAD
448
3.0 72.0 12.0 84.0 86.6 0.7 87.3 85.5 0.6 86.1
CJVT II 3.4 71.7 14.3 86.0 89.5 0.6 90.1 88.3 0.6 88.9
SE ±0.I3 ±1.94 ±0.87 ±1.16 ±1.30 ±0.70 ±0.70 ±1.08 ±0.23 ±0.98
*TADD: Tangential Abrasive Dehulling Device.
Grain hardness was measured as the kg-force required break the grain using a Kiya
hardness tester.
Jambunathan , 2000ICRISAT
Total soluble sugars (%) Total available lysine (%)
Storage time
(months)
10 oC 25 oC 45oC 10 oC 25 oC 45 oC
Rice
0 4.40 ± 0.2a 4.40 ± 0.1a 4.40 ± 0.1a 1.90 ± 0.1a 1.90 ± 0.1a 1.90 ± 0.1a
3 4.50 ± 0.3b 5.10 ± 0.1b 4.10 ± 0.2b 1.80 ± 0.1b 1.00 ± 1.0b 1.40 ± 0.1b
6 4.65 ± 0.1c 5.80 ± 0.2c 2.80 ± 0.2c 1.70 ± 0.2c 1.45 ± 0.2c 1.25 ± 0.1c
Maize
0 3.60 ± 0.1a 3.60 ± 0.2a 3.60 ± 0.2a 2.80 ± 0.2a 2.80 ± 0.2a 2.80 ± 0.2a
3 3.90 ± 0.2b 4.00 ± 0.2b 3.00 ± 0.2b 2.70 ± 0.1b 2.50 ± 0.2b 2.45 ± 0.2b
6 4.15 ± 0.2c 4.35 ± 0.2c 2.00 ± 0.3c 2.60 ± 0.2c 2.40 ± 0.2c 2.22 ± 0.2c
Wheat
0 3.44 ± 0.2a 3.44 ± 0.3a 3.44 ± 0.4a 2.92 ± 0.2a 2.92 ± 0.2a 2.92 ± 0.1a
3 3.58 ± 0.2b 3.68 ± 0.1b 2.83 ± 0.1b 2.82 ± 0.2b 2.64 ± 0.1b 2.48 ± 0.1b
6 3.76 ± 0.3c 3.85 ± 0.1c 2.16 ± 0.2c 2.73 ± 0.1c 2.39 ± 0.1c 2.26 ± 0.2c
Table 31.Storage effects on total soluble sugars and total available lysine contents of cereal
grains (means ± SD, triplicate samples)
Rehman, 2006Pakistan
Independent
variables
Dependent variables
Grain
moisture
(%)
Aflatoxin
(µg/kg)
Weight loss
(%)
Seed
germination
(%)
Starch
(%)
Falling number
(second)
Storage system
Ferrocement bin 12.75b 3.900b 0.740b 83.0a 65.16a 296.7a
Room type store 13.93a 8.975a 2.025a 76.0b 63.32b 292.5b
LSD 0.05 0.0073 0.0468 0.00452 0.4532 0.00453 0.4053
Storage duration
3 months 13.69a 3.400d 0.44d 89.5a 65.39a 302.5a
6 months 12.95d 5.550c 0.90c 85.5b 65.0b 298.5b
9 months 13.15c 7.250b 1.74b 77.5c 63.89c 293.5c
12 months 13.55b 9.550a 2.45a 65.5d 62.68d 284.0d
LSD 0.05 0.0103 0.0662 0.00641 0.6409 0.0064 0.5732
Table 32. Wheat quality parameters based on storage system and
storage duration.
Fig 2.Ferrocement bin
Fig 3. Effect of drying method on percentage of head rice obtained for KDML 105 rice
samples stored as whole grains for 10 months.
Sugunya et al ., 2003Thailand
Fig 4 . Whiteness of KDML 105 rice samples subjected to the 6 methods of drying at monthly
intervals up to 10 months of storage.
Sugunya et al ., 2003Thailand
Conclusion
• Inoculations of both VAM and PSB have attributed the
synergistic effect on grain yield and protein content in maize
crop.
• Crop rotation of wheat with fababean increases grain yield
and protein content and restores soil fertility.
• Application of FYM with inorganic fertilizer enhances the yield
and improves grain quality and along with physico-chemical
and biological properties of soil in pearl millet.
• Foliar spray of micronutrients hastens the grain quality
parameters in finger millet.
Future line of work
• Agronomic investigation on improvement of
quality of cereals is required.
• Relationship between nutrients and quality of
grain has to be studied.
• Effect of irrigation and weed management
practices on grain quality of cereals should be
brought to limelight.
Thank you….!

TECHNOLOGIES FOR IMPROVING GRAIN QUALITY OF CEREALS

  • 2.
    Gurunath Upparatti Sr.M.Sc (Agri.) Dept.of Agronomy GKVK ,Bengaluru
  • 3.
    Sequence of presentation Introduction Factorsaffecting grain quality Case studies Agronomic biofortification Post harvest studies Conclusion Future line of work
  • 4.
    Table 1. Dailyrequirement (g/day) WHO , 2014
  • 5.
    Cereal Protein(g) Fat(g) CHO(g) Crude Fiber (g) Ash (g) Energy (kcal) Calcium (mg) Iron (mg) Thiami n (mg) Niacin (mg) Riboflavin (mg) Wheat 11.6 2.0 71 2.0 1.6 348 30 3.5 -- 5.05 0.101 Brown rice 7.9 2.7 76 1.0 1.3 362 33 1.8 -- 4.31 0.043 Maize 9.2 4.6 73 2.8 1.2 358 26 2.7 -- 3.57 0.197 Sorghum 10.9 3.2 73 2.3 1.6 329 27 4.3 -- 2.83 0.138 Pearl millet 11.0 5.0 69 2.2 1.9 363 25 3.0 0.3 2.0 0.15 Foxtail millet 9.9 2.5 72 10.0 3.5 351 20 4.9 --- 0.99 0.099 Finger millet 6.0 1.5 75 3.6 2.6 336 350 5.0 0.3 1.4 0.10 Kodo millet 11.5 1.3 74 10.4 2.6 353 35 1.7 0.15 … … Japanese Barnyard millet 10.8 4.5 49 14.7 4.0 … 22 18.6 … … … Proso millet 10.6 4.0 70 12.0 3.2 364 8 2.9 4.54 0.279 Anon.,2015 Table 2. Nutritional composition of cereal grains
  • 6.
  • 7.
    Country Production (MetricTons) 1 China 422,599,164 2 United States 387,397,546 3 India 226,330,000 4 Russian Federation 74,465,000 5 France 69,676,000 FAOSTAT (2014)
  • 8.
    Factors affecting grainquality • Growing practices • Time and type of harvest • Postharvest handling • Storage management and • Transportation practices.
  • 9.
  • 10.
    Table 4 :Wheat grain quality traits depending on soil complex Grain quality traits Experimental factors Gluten content (%) Gluten index Protein content (%) Very good wheat complex (black earth ) 29.3 48.2 12.5 Good wheat complex (brown alluvial) 30.8 50.5 12.8 Good wheat complex (loess) 32.8 52.3 13.2 Very good rye complex 31.8 70.6 13.4 Defective wheat complex Limestone soil 34.3 77.3 14.8 Good rye complex 32.8 72.4 14.1 LSD ( 0.05) 2.07 3.17 1.55 Bryza 32.0 66.0 13.6 Hewilla 31.9 51.6 13.3 LSD ( 0.05) NS 12 NS Poland Alicja et al ., 2008
  • 11.
    Previous crop (PC) Tillage systems(TS) Mean CT RT HT Wheat protein (% ) Oats 14.3 12.7 13.7 13.4 Durum wheat 14.2 12.8 13.4 13.6 Pea 14.7 13.8 14.0 14.2 Mean 14.4 13.1 13.7 - LSD0.05 for TS = 0.27, PC = 0.27, TS x PC = 0.62 Table 5. Effect of tillage system and previous crop on grain yield and grain quality of wheat CT = conventional tillage; RT = reduced tillage; HT = herbicide tillage (Glyphosate spray 4 L ha-1) Poland Andrzej et al ., 2014
  • 12.
    Year 24,700 39,50054,300 69,100 84,000 starch ----------------------------------------------------------- % ----------------------------------------------- 1991 63.6 63.4 63.9 63.3 63.8 1992 65.6 64.8 65.5 66.2 66.2 1993 66.7 67.1 68.5 69.1 68.8 1994 62.9 63.0 63.2 63.9 63.8 Mean 64.7 64.6 65.3 65.6 65.7 Plant Population (plants ha-1) Table 6 . Extractable starch as influenced by year and plant population interaction effects in maize. Significant Contrasts: (1991 + 1994 vs. 1992 + 1993) Plant Population Linear (1992 vs. 1993) Plant Population Linear (1992 vs. 1993) Plant Population Linear Stephen et al., 2008USA
  • 13.
    Treatments Plant height(cm)Grain yield (q/ha -1) N content in grains Crude protein(%) Control 150.00 32.00 0.96 6.0 100% RDF* 163.00 44.00 1.54 9.6 PSB 153.10 34.00 1.41 8.8 PSB + 100% RDF 164.00 45.00 1.57 9.8 PSB + 50% RDF 162.00 42.86 1.51 9.4 PSB + 25% RDF 160.00 42.00 1.46 9.1 VAM 152.15 33.96 1.30 8.1 VAM + 100% RDF 163.38 44.96 1.58 9.9 VAM + 50% RDF 161.10 42.82 1.52 9.5 VAM + 25% RDF 158.80 41.97 1.48 9.2 VAM + PSB + 50% RDF 166.00 46.00 1.60 10.0 VAM + PSB + 25% RDF 160.92 42.20 1.50 9.3 CD0.05 2.45 1.75 0.013 0.035 *RDF = Recommended dose of P fertilizer(60kg/ha) Table 7. Effect of PSB (Bacillus subtilis) and VAM (endomycorrhiza) on growth, yield and quality of maize (Zea mays L.) Fozia et al., 2015Jammu & Kashmir (India)
  • 14.
    Treatments Oil content (%) Protein content (%) O. matter concentration (%) T1 5.82a 8.12 g 0.72 c T2 5.80 a 8.31 fg 0.77 bc T3 5.47 b 8.37 f 0.39 g T4 5.43 b 8.82 e 0.82 b T5 4.95 de 9.24 c 0.61 d T6 4.90 def 9.32 c 0.54 e T7 5.22 c 9.02 de 0.34 g T8 4.78 ef 9.54 b 0.39 g T9 5.09 cd 9.17 cd 0.39 g T10 4.50 g 10.26 a 1.07 a T11 4.74 f 10.23 a 0.52 e T12 4.72 f 10.19 a 0.45 f CD0.05 0.03 0.23 0.16 Table 8 - Effect of organic mulches and tillage on grain quality of maize Zamir et al., 2013Pakistan T1= conventional tillage, T2= conventional tillage + wheat straw mulch (partially incorporated), T3= conventional tillage + saw dust mulch (partially incorporated), T4= zero tillage, T5= zero tillage + wheat straw mulch (partially incorporated), T6= zero tillage + saw dust mulch (partially incorporated), T7= bar harrow tillage T8= harrow tillage + wheat straw mulch (partially incorporated), T9= harrow tillage + saw dust mulch (partially incorporated), T10= subsoiler tillage (subsoiler) T 11= sub soiler tillage + wheat straw mulch (partially incorporated) T12= subsoiler tillage + saw dust mulch (partially incorporated)
  • 15.
    Milling quality Transplanting datesBR (%) TMR (%) HR (%) D1 78.9 70.3 48.8 D2 79.7 71.2 55.4 D3 80.3 71.3 59.4 D4 79.9 72 62.8 S.D. (Mean) ± 0.589 ± 0.698 ± 6.016 Average 79.7 71.2 56.6 D1: 5th May D2: 27th May D3: 18th June D4: 10th July Table 9. Effect of transplanting dates on milling quality of rice BR : brown rice TMR : total milling recovery HR :head rice CGL : coarse grain rice lines Muhammad et al ., 2016Faisalabad, Pakistan
  • 16.
    Sowing method × Variety Nitrogen in straw(%) Nitrogen in grain (%) Protein in straw (%) Protein in grain (%) Grain yield (t ha-1) S1×V1 S1×V2 S1×V3 S1×V4 S2×V1 S2×V2 S2×V3 S2×V4 0.278 d 2.035 1.667 d 11.895 d 0.281 cd 1.936 1.756 cd 11.315 e 0.294 b 2.078 1.825 bc 12.115 c 0.315 b 2.085 1.947 bc 12.189 bc 0.319 b 2.114 2.010 b 12.312 ab 0.310 b 2.123 1.967 bc 11.967 d 0.312 b 2.110 1.989 b 12.321 ab 0.456 a 2.131 2.904 a 12.441 a 0.01 NS 0.01 0.01 0.41 3.92 5.01 0.61 2.29 f 2.81 de 2.94 c 3.04 bc 2.69 e 2.92 cd 3.07 b 3.25 a LS NS CV % 9.05 Table 10. Interaction effect of sowing method and variety on quality traits and yield of wheat conventional sowing (S1) Bed sowing (S2 ) Protiva (V1), Sourav (V2), Shatabdi (V3) and Prodip (V4) Alam , 2012Bangladesh
  • 17.
    Treatment Grain yield(kg ha-1 ) Protein (g kg-1 ) 1988–1989 1989–1990 1990–1991 Mean 1988– 1989 1989– 1990 1990–1991 Mean Tillage NT 2350a2 4500b 2510a 3120a 110a 104a 107b 107b CT 1750b 5060a 2790a 3200a 113a 108a 113a 111a Rotation CW 1630d 3720c 1700d 2350e 107d 110a 108b 109b WS 1580d 4870b 2430c 2960d 109cd 105b 104c 106c WCP 1920c 4830b 2740b 3170c 113ab 107ab 114a 111a WFB 2270b 5430a 3580a 3760a 116a 104b 115a 112a WF 2830a 5020b 2800b 3550b 112bc 106b 108b 109b N rate (kg ha-1) 50 2020a 4400c 2560b 2990b 99c 106a 99c 101c 100 2130a 4820b 2730a 3230a 113b 107a 108b 110b 150 1990a 5110a 2650a 3250a 122a 106a 123a 117a Mean 2050C 4780A 2650B 3160 112A 106B 110A 109 Table 11. Wheat grain yield, protein as affected by tillage methods, crop rotation and nitrogen rate. NT, no tillage; CT, conventional tillage; CW, continuous wheat; WS, wheat–sunflower; WCP, wheat– chickpea; WFB, wheat–fababean; WF, wheat–fallow. IRRI Consuelo , 1992
  • 18.
    Treatments Plantation methods M1 =70 cm spaced single rows Grain starch concentrati on (GSC) (%) 71.51 b Grain protein concentration (GPC) (%) 9.07 b Grain oil concentration (GOC) (%) 4.63 b M2 = 105 cm spaced double row strips 71.76 a 9.28 a 4.72 a M3 = 70 cm spaced ridges 71.75 a 9.26 a 4.74 a LSD 5% 0.08 0.04 Nutrient levels (kg ha-1) N P K S F0 0 0 0 0 70.72 c 7.84 e 4.08 e F1 250 0 0 0 69.69 d 9.06 d 4.55 d F2 250 150 0 0 71.39 b 9.34 c 4.71 c F3 250 150 100 0 72.31 a 9.39 bc 4.78 bc F4 250 150 100 15 72.32 a 9.64 a 4.96 a F5 250 150 100 0 72.46 a 9.50 b 4.83 b F6 250 150 100 15 72.50 a 9.64 a 4.96 a LSD 0.05 0.45 0.13 0.11 Table 12. Effect of different planting methods and nutrient levels on qualitative traits of hybrid maize Muhammad et al ., 2004Faisalabad ,Pakistan
  • 19.
    Treatment Grain yield ( t /ha) Stover yield (t/ha) Total N uptake (kg/ha) Total P uptake (kg/ha) Protein content (%) B:C ratio Land configuration LI: Flat sowing 2.33 6.36 78.24 29.45 11.42 0.88 L2: Ridge and furrow sowing 2.62 7.31 90.39 34.39 11.53 0.98 SEm + 0.05 0.13 1.47 0.54 0.07 0.03 CD (P=0.05) 0.14 0.38 4.36 1.61 NS 0.10 Nutrient management Fo: Control 2.06 5.81 63.48 24.11 11.08 0.86 F1: 30 kg N + 20 kg P205/ha 2.45 6.65 81.40 30.65 11.48 0.98 F2: 60 kg N +40 kg P205/ha 2.70 7.45 97.14 37.13 11.65 0.96 F3:30 kg N + 20 kg P205 + FYM @ 6 tonnes/ha 2.75 7.54 99.14 37.42 11.85 0.94 F‘4: FYM @ 6 tonnes/ha 2.46 6.59 80.42 30.30 11.36 0.91 SEm + 0.07 0.20 2.32 0.86 0.11 0.06 CD (P=0.05) 0.22 0.59 6.89 2.55 0.32 NS Table 13. Effect of land configuration and nutrient management practices on quality of pearl millet Parihar et al., 2009IARI ,New Dehli
  • 20.
    Character Genotype Main culm(MC) Primary tiller(PT) Secondary tiller(ST) Tertiary tiller(TT) Mean CV(%) Brown ricerate (%) Xiushui 11 83.94 a 83.51 a 83.66 a 83.85 a 83.67 0.34 Mutant 84.49 a* 84.03 a 84.63 a 85.18 a* 84.59 ** 0.56 Amylose content of rice (%) Xiushui 11 16.32b 17.98 a 15.68 bc 14.93 c 16.23 8.00 Mutant 16.48a 15.61 a** 15.22 a 12.93 b* 14.58* 9.93 Protein content of rice (%) Xiushui 11 10.72a 10.23 b 9.74 b 10.22 b 10.23 3.89 Mutant 9.84 a* 9.49 b* 8.84 c* 8.49 d** 9.17* 6.63 Table 14. Grain yield and panicle characteristics of different tillers in rice *,** indicate significant difference between Xiushui 11 and the mutant for a given characteristic at 95% and 99% probability levels, respectively. Wang et al ., 2007China
  • 21.
    Day/night temperature ( oC)Water a Fertilizerb Protein (%) 24/17 ‡ ‡ 16. 9 37/17 ‡ ‡ 18 .8 37/28 ‡ ‡ 17. 3 24/17 ‡ ÿ 9 .8 37/17 ‡ ÿ 13. 5 37/28 ‡ ÿ 17 .6 37/17 ÿ ‡ 20. 0 37/17 ÿ ÿ 17. 4 a Plants were well-watered (‡) or drought-treated (ÿ). b Plants received post-anthesis fertilizer (‡) or did not receive post-anthesis fertilizer (ÿ). Table15.Effect of temperature, fertilizer and water on composition of mature grain of spring wheat Altenbach, 2001USA
  • 22.
    Table 16. Effectof lodging on milling and baking qualities wheat "Wheat cultivars: samples I, 3, and 5 = Stephens; sample 2 = Twin; sample 4 = Hyslop. Pumphrey et al ., 1994Washingaton
  • 23.
    Figure 1 Viewof the lodging induction method applied: A – General and B – Detailed Intensity 1 – 50% lodging or plants inclined45° Intensity 2 – 100% lodging or plants inclined 90°
  • 24.
    Protein (%) Treatments 20042005 Wheat sole crop 11.2% 10.2% Wheat +Faba bean 13.0% 12.5% Table 17. Average protein content (%) in wheat grown as a sole crop or intercropped with faba beans. Isobel et al ., 2008Europe
  • 25.
    Year Factors Grain yield (tha-1 ) 1000 kernel weight (g) Protein content (%) Variety Water 2013 EGA-Gregory Rainfed 1.63b 24b 11.9a Irrigated 3.65a 37a 6.9b Livingston Rainfed 1.99b 27b 8.7a Irrigated 3.00a 34a 7.5b LSD5% variety × irrigation 0.8 4 1.2 2014 EGA-Gregory Rainfed 4.68b 35c 8.7b Irrigated 6.01a 40a 7.6b Livingston Rainfed 4.21b 36bc 10.3a Irrigated 4.53b 37b 7.5b LSD5% variety ×irrigation 0.47 2 1.4 Table 18. The average grain yield and grain qualities of wheat . Nendel et al.,2015Australia
  • 26.
    Treatments Grain yield Plant-1(g) 1000-grain weight (g) Grain protein content (%) I1 1.91a 45.75a 14.95d I2 1.61b 43.00ab 15.25c I3 1.46c 40.76b 15.25c I4 1.23d 42.40ab 15.90b I5 0.91e 31.21c 17.30a LSD0.05 0.14 4.46 0.10 I1 = 7 irrigation (Control), I2 = 6 irrigations, I3 = 5 irrigations, I4 = 4 irrigations, I5 = 3 irrigations. Table 19. Means of five irrigation treatments for yield and yield components traits of barley (data over two seasons). Saied et al., 2014Egypt
  • 27.
    Stress intensity Period Nerica1 Nerica 4 Nerica 7 Arica 4 Arica 5 L0 FC DS 2013 9.4 9.3 9.0 9.0 9.0 L1 LS 9.4 9.3 9.0 8.8 9.1 L2 MS 9.8 10.0 10.2 9.7 9.6 L3 SS 10.8 9.9 11.6 11.0 10.0 Mean 9.9 9.6 10.0 9.6 9.5 CV (%) 6.7 4.4 12.3 10.2 4.8 LSD 0.8 1.2 0.8 1.5 1.0 L0 FC WS 2014 9.0 9.3 8.5 9.0 9.0 L1 LS 9.3 9.0 9.0 9.2 9.2 L2 MS 9.8 9.9 10.0 9.8 9.8 10.9 11.1 11.7 11.2 10.8L3 SS Mean 9.8 9.8 9.8 9.8 9.7 CV (%) 8.5 9.2 14.4 10.2 8.1 LSD.05 0.4 0.5 1.0 0.6 0.5 Table 20.Effect of different soil moisture levels on protein content of tested varieties of rice during dry season(DS) 2013 and wet season(WS) 2014. Roseline et al., 2014Nigeria L0 : Field capacity L1:Low stress L2: Moderate stress L3: Severe water stress NERICAs (New Rice for Africa) , ARICA (Advanced Rice for Africa)
  • 28.
    Starter Fertilizer Yield(g m-2)Protein Grain size >2.5mm (%) concentration(%) Applied 343.2a 11.1a 97.8a Not applied 354.6a 10.7a 98.6a Soil locations Laxmans Åkarp 311.9b 11.3a 96.8b Lunnarp 385.8a 10.5b 99.6a Treatments Treatment 1 296.9a 11.7a 96.0b Treatment 2 326.9a 10.9b 97.6ab Treatment 3 389.5a 10.5b 99.6a Treatment 4 382.2a 10.5b 99.6a Treatments Soil location Starter fertilizer 1 Laxmans Åkarp Applied 2 Laxmans Åkarp Not applied 3 Lunnarp Applied 4 Lunnarp Not applied Malik et al., 2012Sweden Table 21.Mean values of yield and quality parameters at maturity of spring malting barley at starter fertilizer dosage, two soil locations and four different treatments
  • 29.
    Treatment Zn (µgg-1 ) Fe (µg g-1 ) Protein (%) S1 = Control without Zn and Fe 12.42 31.34 7.93 S2 = ZnSO4 at 20 kg per ha+ FeSO4 at 10 kg per ha through Soil application 20.68 57.10 10.99 S3 = ZnSO4 at 0.2 % and FeSO4 at 0.1 % as Seed treatment 21.73 71.96 10.75 S4 = ZnSO4 at 0.2 % and FeSO4 at 0.1 % as Seed treatment + Foliar spray of ZnSO4 at 0.5 % and FeSO4 at 0.1 % at panicle initiation and boot leaf stage 23.69 85.44 12.24 S.Em± 0.72 5.35 0.62 C.D0.05 2.14 15.91 1.85 Table 22 : Zn, Fe and Protein content in dehusked rice as influenced by agronomic biofortification Meena et al.,2015V.C. Farm, Mandya
  • 30.
    Sowing method × N level Nitrogenin straw (%) Nitrogen in grain (%) Protein in straw (%) Protein in grain (%) Grain yield (t ha-1) S1×N0 S1×N1 S1×N2 S1×N3 S2×N0 S2×N1 S2×N2 S2×N3 0.215 h 1.878 d 1.350 e 10.956 g 0.241 g 1.945 d 1.507 de 11.378 f 0.325 d 2.089 ab 2.067 c 12.201 c 0.384 b 2.241 a 2.315 b 13.021 a 0.246 f 2.056 abc 1.524 d 11.535 e 0.273 e 2.027 bcd 1.656 d 11.856 d 0.369 c 2.167 ab 2.301 b 12.645 b 0.536 a 2.245 a 3.356 a 13.088 a 0.01 0.05 0.01 0.01 0.41 3.92 5.01 0.61 1.74 e 2.69 d 3.22 c 3.42 bc 1.81 e 2.84 d 3.48 b 3.81 a LS CV % 0.05 9.05 Table 23.Interaction effect of sowing method and N rates on quality traits and yield of wheat conventional sowing (S1) Bed sowing (S2 ) 0 (N0), 60 (N1), 110 (N2) and 160 (N3) kg N ha-1. Alam, 2012Bangladesh
  • 31.
    Treatment N (%) Ca (%) Fe (ppm) Zn (ppm) Protein (%) Total Amino Acid (%) CHO (%) T1:RDF* 1.3 1.8 230.0 33.7 8.5 2.40 65.3 T2: 150 % RDF 1.4 1.6 220.2 35.1 8.8 2.46 67.7 T3:T1+ZnSO4 @ 50 kg ha-I as soil application 1.0 1.1 200.2 71.2 6.7 1.80 61.7 T4:T1 + ZnSO4 @0.5 % foliar spray 1.0 1.2 216.1 75.9 6.5 1.90 61.3 T5: T1+ FeSO4@ 0.2 % foliar spray 1.1 1.4 722.3 34.6 7.0 2.43 65.0 T6: T1+ ZnSO4 soil application + FeSO4 0.2 % foliar spray 1.1 1.5 720.8 84.5 7.0 2.20 64.3 T7: T1 + ZnSO4 0.5 % foliar spray + FeSO4 0.2 % foliar spray 1.2 2.6 712.0 87.3 7.6 2.43 66.0 T8: T2+ ZnSO4 @ 50 kg ha-1 as soil application 1.0 2.0 219.3 62.7 6.5 2.70 64.7 T9: T2 + ZnSO4 0.5 % foliar spray 1.2 2.4 250.7 86.9 7.5 3.50 68.3 T10: T2+ FeSO4 0.2 % foliar spray 1.4 2.2 725.7 31.8 8.7 3.90 66.0 T11: T2+ ZnSO4 soil application + FeSO4 0.2 % foliar spray 1.3 2.3 698.9 76.3 8.0 4.10 68.3 T12: T2+ ZnSO4 0.5 % foliar spray + FeSO4 0.2 % foliar spray 1.4 2.7 753.2 85.7 9.0 4.33 69.3 CD (P = 0.05) 0.049 0.6 43.8 4.5 0.3 0.33 2.5 Sanwer et al.,2012Hyderabad Table 24.Grain quality parameters of finger millet as influenced by nutrient management practices * RDF 40:20:20 N:P2O5: K2O
  • 32.
    Levelsof Zn* (kg ha-1) Yield (tha-1) Total Zn uptake (g ha-1) Total Carbohydrate (%) Wet gluten (%)Grain Straw 0 3.88 4.76 214.39 60.01 10.05 1.25 3.93 4.81 222.70 61.15 10.30 2.50 4.04 4.88 246.19 64.37 10.93 5.00 4.24 5.09 271.56 65.60 11.89 10.00 4.62 5.42 295.93 69.20 12.19 20.00 4.66 5.44 327.74 70.37 12.37 Mean 4.23 5.06 263.08 65.12 11.28 C.D. (5%) 0.45 0.56 35.33 4.35 0.86 Table 25. Effect of Zn application on yield and total Zn uptake by wheat in Vertisol (Pooled data of two year) Keram et al ., 2012Jabalpur *RDF (120N: 60 P2O5: 40 K2O kg ha-1)+ZnSO4
  • 33.
    Nitrogen fertilizer treatment* (kg/ha) RoughHead Rice Yield (t/ha) Head Rice (%) Head rice yield (t/ha) Protein (%) PP MT PI PL Total 0 0 0 0 0 5.3c 37.5c 2.0c 5.6c 120 0 60 0 180 9.3b 47.1b 4.4b 7.6b 60 60 60 45 225 9.9a 57.7a 5.7a 9.6a Table 26. Effect of rate and timing of nitrogen fertilizer application on rice yield and quality characteristics. Consuelo et al.,1992IRRI PP- preplant, MT-Max.tilliring , PI-Panicle intition , PL-Flowering
  • 34.
    Table 27. Effectof herbicide treatments on mean carbohydrate% and protein% of maize, in 2013 and 2014 seasons Carbohydrate (%) Protein (%) Treatments Rate a.i. g/fed* 2013 season 2014 Season 2013 season 2014 season Acetochlor 84% EC (Harness) 840 75.61 cd 77.5 cd 7.9 bc 6.9 e Acetochlor 84 % CS 1680 84.39 ab 86.5 ab 9.5 ab 9.0 ab Sulcotrione 15% SC 300 81.62 b 83.4 bc 8.2 b 8.0 ab Metribuzin 70%WG 420 g 87.27 a 88.4 a 10.1 a 9.5 a Pendimethalin 45.5% CS (Stomp Extra) 682.5 80.17 bc 75.3 de 7.5 c 7.2 cde Pendimethalin 45.5% SC 1365 81.12 b 81.9 c 7.9 bc 7.5 bc Hand hoeing Twice 82.55 ab 83.8 bc 8.3 b 7.5 bc Unweeded (control) -------------- 71.7 e 72.42 e 6.8 e 6.6 g Shaba et al., 2015Egypt *feddan = 4200 m2
  • 35.
    Treatment Kernel protein concentration (%) Kernelamylose concentration (%) 2008 2009 2008 2009 No weeding 6.61 e 6.54 e 18.63 f 18.56 f Hand weeding 7.99 a 7.96 a 22.31 a 22.23 a Hoeing 7.96 a 7.93 a 22.18 b 22.08 b Tine cultivator 7.56 b 7.48 b 21.30 c 21.22 c Herbicide PoE (Nominee) 7.31 c 7.22 c 19.27 d 19.16 d Spike hoe LSD 0.05 7.05 d 0.15 6.94 d 0.09 18.95 e 0.07 18.84 e 0.10 Table 28. The effect of various weed control measures on grain quality of direct-seeded dry rice Muhammad et al., 2008Pakistan
  • 36.
    Weed control practices Kernel Length(mm ) Chalky kernels(%) Kernel protein concentration(%) Kernel amylose concentration(%) Kernel water Absorption ratio Control (weedy check) 7.65 d 23.36 b 7.23 b 20.56 b 3.30 cd Hand pulling (30, 45 and 60 days after sowing) 7.83 a 25.82 a 7.97 a 22.39 a 4.35 a Mechanical hoeing (30,45 and 60 days after sowing) 7.81 a 24.85 ab 7.95 a 22.04 a 3.89 ab Butachlor (1.8 kg a.i. ha-1) 7.75 c 24.14 ab 7.30 ab 19.89 c 3.76 bc Pendimethalin (1.65 kg a.i. ha-1) 7.77 bc 25.52 a 6.52 c 18.76 d 2.92 b Pretilachlor (1.25 kg a.i. ha-1) 7.80 ab 24.10ab 7.50 ab 19.33 cd 3.74 bc LSD at p ≤ 5% 0.03 1.80 0.68 0.62 0.52 Table 29. Effect of weed control practices on quality parameters of direct sown rice Nadeem et al ., 2011Pakistan
  • 37.
    Table 30. Dehullingquality of pearl millet grains. Dehulled grain recovery (%) Hand pounding Barley pearler TADD* Dehulled Dehulled Dehulled Cultivar Grain Hardnes s (kg) Grain Brokens Total Grain Brokens Total Grain Brokens Total Mossi Local 3.6 77.2 10.3 87.5 86.0 1.6 87.6 87.2 1.2 88.4 WC- C75 3.4 75.3 11.9 87.2 86.8 0.7 87.5 86.2 1.4 87.6 SAD 448 3.0 72.0 12.0 84.0 86.6 0.7 87.3 85.5 0.6 86.1 CJVT II 3.4 71.7 14.3 86.0 89.5 0.6 90.1 88.3 0.6 88.9 SE ±0.I3 ±1.94 ±0.87 ±1.16 ±1.30 ±0.70 ±0.70 ±1.08 ±0.23 ±0.98 *TADD: Tangential Abrasive Dehulling Device. Grain hardness was measured as the kg-force required break the grain using a Kiya hardness tester. Jambunathan , 2000ICRISAT
  • 38.
    Total soluble sugars(%) Total available lysine (%) Storage time (months) 10 oC 25 oC 45oC 10 oC 25 oC 45 oC Rice 0 4.40 ± 0.2a 4.40 ± 0.1a 4.40 ± 0.1a 1.90 ± 0.1a 1.90 ± 0.1a 1.90 ± 0.1a 3 4.50 ± 0.3b 5.10 ± 0.1b 4.10 ± 0.2b 1.80 ± 0.1b 1.00 ± 1.0b 1.40 ± 0.1b 6 4.65 ± 0.1c 5.80 ± 0.2c 2.80 ± 0.2c 1.70 ± 0.2c 1.45 ± 0.2c 1.25 ± 0.1c Maize 0 3.60 ± 0.1a 3.60 ± 0.2a 3.60 ± 0.2a 2.80 ± 0.2a 2.80 ± 0.2a 2.80 ± 0.2a 3 3.90 ± 0.2b 4.00 ± 0.2b 3.00 ± 0.2b 2.70 ± 0.1b 2.50 ± 0.2b 2.45 ± 0.2b 6 4.15 ± 0.2c 4.35 ± 0.2c 2.00 ± 0.3c 2.60 ± 0.2c 2.40 ± 0.2c 2.22 ± 0.2c Wheat 0 3.44 ± 0.2a 3.44 ± 0.3a 3.44 ± 0.4a 2.92 ± 0.2a 2.92 ± 0.2a 2.92 ± 0.1a 3 3.58 ± 0.2b 3.68 ± 0.1b 2.83 ± 0.1b 2.82 ± 0.2b 2.64 ± 0.1b 2.48 ± 0.1b 6 3.76 ± 0.3c 3.85 ± 0.1c 2.16 ± 0.2c 2.73 ± 0.1c 2.39 ± 0.1c 2.26 ± 0.2c Table 31.Storage effects on total soluble sugars and total available lysine contents of cereal grains (means ± SD, triplicate samples) Rehman, 2006Pakistan
  • 39.
    Independent variables Dependent variables Grain moisture (%) Aflatoxin (µg/kg) Weight loss (%) Seed germination (%) Starch (%) Fallingnumber (second) Storage system Ferrocement bin 12.75b 3.900b 0.740b 83.0a 65.16a 296.7a Room type store 13.93a 8.975a 2.025a 76.0b 63.32b 292.5b LSD 0.05 0.0073 0.0468 0.00452 0.4532 0.00453 0.4053 Storage duration 3 months 13.69a 3.400d 0.44d 89.5a 65.39a 302.5a 6 months 12.95d 5.550c 0.90c 85.5b 65.0b 298.5b 9 months 13.15c 7.250b 1.74b 77.5c 63.89c 293.5c 12 months 13.55b 9.550a 2.45a 65.5d 62.68d 284.0d LSD 0.05 0.0103 0.0662 0.00641 0.6409 0.0064 0.5732 Table 32. Wheat quality parameters based on storage system and storage duration.
  • 40.
  • 41.
    Fig 3. Effectof drying method on percentage of head rice obtained for KDML 105 rice samples stored as whole grains for 10 months. Sugunya et al ., 2003Thailand
  • 42.
    Fig 4 .Whiteness of KDML 105 rice samples subjected to the 6 methods of drying at monthly intervals up to 10 months of storage. Sugunya et al ., 2003Thailand
  • 43.
    Conclusion • Inoculations ofboth VAM and PSB have attributed the synergistic effect on grain yield and protein content in maize crop. • Crop rotation of wheat with fababean increases grain yield and protein content and restores soil fertility. • Application of FYM with inorganic fertilizer enhances the yield and improves grain quality and along with physico-chemical and biological properties of soil in pearl millet. • Foliar spray of micronutrients hastens the grain quality parameters in finger millet.
  • 44.
    Future line ofwork • Agronomic investigation on improvement of quality of cereals is required. • Relationship between nutrients and quality of grain has to be studied. • Effect of irrigation and weed management practices on grain quality of cereals should be brought to limelight.
  • 45.

Editor's Notes

  • #11 Limestone it improves the uptake of major plant nutrients (nitrogen, phosphorus, and potassium) of plants growing on acid soilsit permits improved water penetration for acidic soils It is important to determine the total protein content and gluten content while assessing the quality of wheat. In the present study, the soil quality and weather conditions in the wheat ripening period differentiated the protein content and gluten content in spring wheat grains. The year 2007, in which high temperatures and lack of rainfall were recorded at the ripening period, was more favorable for storing protein. Gluten content and gluten index were significantly dependent on the soil quality. In 2007, gluten content ranged from 29.3 to 34.8%. Amount of eluted gluten was significantly higher in the grains originating from the wheat cultivated on defective wheat complex soil (limestone soil). The lowest amount of gluten was obtained from wheat grains growing on the soil of very good wheat complex (black earth) In 2007 wheat grains collected from the defective wheat complex (14.8%) and good rye complex (14.1%) (limestone soil) had significantly highest protein content. The lowest protein content in recorded in the grain of wheat cultivated on a very good wheat (black earth) (12.5%) and good wheat complex (alluvial soil) (12.8%).
  • #14 Plant height showed a significant increase due to various treatments as compared to control with maximum height (166 cm) in VAM + PSB + 50% RDF treatment which was at par with PSB + 100%RDF This increase may be attributed to the auxin production by PSB and increased supply of phosphorus by PSB and VAM (Fankem et al., 2008). (Fankem, H., Laurette, N.N., Annette, D., John, Q., Wolfgang, M., François-Xavier, E. and Dieudonné, N. 2008. Solubilization of inorganic phosphates and plant growth promotion by strains of Pseudomonas fluorescens isolated from acidic soils of Cameroon. African Journal of Microbiology Research, 2: 171-178.) The increase in grain yield and plant biomass due to the dual inoculations of VAM and PSB could be attributed to the synergistic action of two organisms which increased the P uptake Maximum nitrogen and crude protein content of 1.6 and 10.0% was observed in treatment VAM + PSB + 50% RDF which was at par with treatments PSB + 100% RDF and VAM + 100% RDF (Table 1). The effect could be due to the synergistic action of PSB, VAM and phosphorus fertilizer.
  • #15 Protein is important quality parameter that depends on the management practices. The mean maximum value of protein 10.26% was observed in T10 (subsoiler tillage) which is statistically at par with those of T11 (subsoiler tillage + wheat straw mulch) [10.23] and T12 (subsoiler tillage + saw dust mulch) [10.19], followed by 9.54%, 9.32% and 9.24% in T8 (bar harrow tillage + wheat straw mulch), T6 (zero tillage + saw dust mulch) and T5 (zero tillage + wheat straw), respectively. The mean minimum value 8.12% was observed in T1 (conventional tillage) followed by T2 (conventional tillage + wheat straw mulch) [8.31%] and T3 (conventional tillage + saw dust mulch) [8.37%]. The combined effect of tillage and mulching showed that wheat straw mulch along with mulching showed better results as compare to sole application of tillage and mulches in the treatments. Organic mulches conserved the water and provided the nutrients (nitrogen) in the soil The seedwas sown with the help of drill bymaintaining 25 cm P×P distance and R×Rdistance 60 cm. subsoil tillage improved the root length andwater availability as the root was gone for the extraction of storage of waterin the deeper profiles of soil. Subsoiler tillage might have improved the root proliferation of maize crop
  • #16 Results suggest that very early transplanting is more damaging to milling and cooking of both, fine as well as coarse grain rice lines as compared to delayed transplanting. Likewise, much delayed transplanting is more destructive for milling and cooking characters in case of fine grain rice lines as compared to coarse grain type rice lines. In case of studied fine grain rice genotypes, head rice recovery was observed maximum when translated at 18th of June. Similarly, cooked grain length was improved significantly in case of fine rice lines with delay in transplanting. Results suggest fine grain rice varieties to be transplanted before onset of July in order to have least broken rice in milled rice. Delayed sowing date, milling quality, total and head rice recovery, cooked grain length and bursting percentages showed
  • #17 The interaction effect of sowing method and variety had significant effect on grain protein content. The highest protein content in grain was found in Prodip in bed sowing system and the lowest one was found in Sourav in conventional sowing system . The interaction effect of sowing method and nitrogen was found significant on grain protein content. The highest protein content wasnoticed in bed sowing system at 160 kg N ha-1 and thelowest was found in conventional sowing system at control treatment (Table 3).
  • #19 The crop grown in 105 cm spaced double-row strips (M2) and on 70 cm spaced ridges (M3) produced statistically similar starch content with a range of 72.10 to 72.14% which was significantly higher than M1 (71.86%) Grain protein concentration. The crop planted in 70 cm spaced single-rows (M1) produced significantly less grain protein (9.12%) than that planted either in 105 cm spaced double-row strips (M2) or 70 cm spaced ridges (M3) which were statistically on a par with each other showing GPC of 9.33 and 9.29%, respectively Grain oil concentration :Promotive effect of sulphur in grain oil content may be due to the reason that sulphur is needed for the formation of disulfide bonds between polypeptide chains. Such disulfide linkages stabilize the various enzymes. This in turn, may increase the activity of enzyme. Besides sulphur is required for the synthesis of various metabolites reg. Coenzyme A which is involved in the oxidation and synthesis of fatty acids
  • #21 starch synthesis as well as grain quality was affected by climatic factors, especially by temperature at later grain filling stage [13]. Therefore, the more the tillers for a plant, the greater the variation of grain quality within a plant, because the plant with more tillers has more chance of being subjected to different temperatures during grain filling. This may explain for the negative effect of tillering capacity on the uniformity of grain quality within a plant.
  • #22 Apoptosis in endosperm tissue also occurred earlier under high temperatures and coincided with physiological maturity. The addition of drought to the 37/17 C regimen further shortened the time to maximum water content and dry weight and reduced the duration of starch accumulation, but did not in¯uence the timing of protein accumulation or kernel desiccation
  • #23 Equations Used: kg/hL = (lb/bushel) * 1.25 (1 lb = 454 g = 0.4536 kg)(kg/hL (kilograms per 100 litres of volume))( 79.6kg/hl = 63.679) lb/bushel = (kg/hL) / 1.25 Lodging effects the movemment of photoassimilates to other grain parts Wheat with the greatest tendency for lodging had characteristics associated with over management (Pinthus 1973). The wheat was planted relatively early and fertilized with great amounts of nitrogen (more than 250 kg/ha) applied before planting or during early tillering in the spring. These practices, combined with favorable growing conditions, resulted in massive vegetative growth before the boot stage of growth. Test weight of the standing grain was 3-10 kg/hi higher than the test weight of the lodged grain (Table I). Grain from the lodged wheat graded one to four grades lower because of the lower test weight (data not shown). Visual observation indicated that the lower test weight of the lodged grain resulted from the large amount of shriveled kernels it contained. Mean test weight of the conditioned grain from standing wheat was 5.7 kg/hi higher than the test weight of the conditioned grain from lodged plants (Table II).   Milling Score Grain from lodged wheat had a slower feed rate into the mill, which contributed to its lower milling score   Flour The plumper kernels of the standing wheat compared to the less plump kernels of the lodged wheat had a higher ratio of flour to bran, as indicated by the flour yield (Table II). Flour from the standing wheat was lower in ash and protein and absorbed less water than flour from lodged wheat (Table II). Low levels of ash, protein, and water absorption are desirable characteristics of soft white wheat flour. concluded that lodging at heading reduced yield of small grain 27-30%, reduced test weight, increased the N (protein) content of the grain, and might have reduced the milling quality of wheat
  • #25 Faba bean-wheat mixtures seem to be the most reliable and economically viable option. Kasyanova et al (2006) conducted field experiments in three successive growing seasons (2002/03 to 2004/05) at different sites within Europe. Treatments included wheat intercropped with faba bean in both replacement and additive designs, both autumn and spring sowing, and at one site, wheat intercropped with pea. Irrespective of design, sowing season, site, or grain legume used, intercropping increased the N and S concentration, and the N:S ratio in wheat grain. The rheological (deformation and flow) properties of doughs made from wheat flour, and hence the characteristics of many wheat-based products, are strongly influenced by the amount and type of storage proteins in wheat endosperms. The crude protein concentration (e.g. N x 5.7) of wheat grain is, therefore, a commonly used quality criterion for marketing wheat. Achieving sufficient N concentration in organic wheat can be a challenge in high yielding areas of Europe (Gooding et al. 1999) as it is heavily dependant on nitrogen availability, particularly during grain filling. Sulphur is also an important component of wheat proteins and provides the inter- and intra-chain disulphide bonds that help maintain gluten functionality. Prins, U. and Wit, J. de (2006) Intercropping cereals and grain legumes: a farmer’s perspective. Paper presented at Joint Organic Congress, Odense, Denmark, May 30-31, 2006. Org Print 7297
  • #26 The non-irrigated wheat had a 50% higher protein content compared to that of the irrigated wheat which might be due to dilution effect of higher yield from the irrigated wheat. There was no interaction effect of year × variety and variety × water on pro- tein content.
  • #27  . Furrow irrigation was applied at 30 days intervals to all experimental plots for establishment of plants till they were 60 days old. Life irrigation or first irrigation was started after 30 days from sowing at tillering stage and the second irrigation after 60 days from sowing at booting stage. Booting was defined to growth stage (GS) (approximately flag leaf sheath opening). Irrigation treatments were applied thereafter. The crop during grown seasons received 7 irrigations (control) including planting irrigation Complete irrigation: irrigation was applied every 10 days after booting7stage.7   Irrigation was applied every 15 days after booting stage.6   Irrigation was applied every 20 days after booting stage.5   Irrigation was applied every 25 days after booting stage.4   Cut irrigation after booting stage (irrigation was stopped till the end of the season).3   that the maximum protein content (17.3%) was recorded in I5 (three irrigations) treatment. Grain protein content (17.3%) was significantly higher when crop was grown under three irrigation regimes than grain protein content (14.95%) in control, when crop was given normal irrigations, and grain protein content (15.25, 15.25 and 15.90%), Protein yield (kg ha-1) Protein yield per unit area is the ultimate target in growing high-protein barley genotypes and it is in direct dependence on grain yield and protein concentration. According to ANOVA (Table 4), irrigation regimes affected significantly protein yield (P ≤ 0.01). The means of the five irrigation treatments were compared to study the significant differences among the treatments (Table 2). According to the least significant difference test, the results suggested that the highest (442.6 kg h-1) and the lowest (161.3 kg ha-1) protein yield belonged to I1 and I5, respectively. Data (Table 4) revealed that highest protein yield (442.6 kg h-1) was produced under I1 treatment which, on an average, was 27.88, 72.01, 118.24 and 174.39% higher than protein yield produced under I2, I3, I4 and I5 treatments, respectively. The extents of these reductions were related to the variations in grain yield of barley under different irrigation regimes. The glutamate pathway accounts for major proline accumulation during osmotic stress. The proline is synthesized from glutamatic acid via intermediate ∆'-pyrroline-5-carboxylate (P5C). The reaction is being catalyzed by ∆'-pyrroline-5-carboxylate synthetase (P5CS) and ∆'-pyrroline-5-carboxylate reductase (P5CR) (Fig. 1).23 P5CS is encoded by two genes whereas P5CR is encoded by only one in most plant species.16,24,25 Proline catabolism occurs in mitochondria by means of the chronological action of proline dehydrogenase or proline oxidase (PDH or POX) producing P5C from proline and P5C dehydrogenase (P5CDH) converts P5C to glutamate. Two genes encode PDH, whereas a single P5CDH gene has been identified in Arabidopsis and tobacco (Nicotiana tabacum).26-29 PDH transcription is activated by rehydration and proline but repressed by dehydration, thus preventing proline degradation during abiotic stress
  • #28 L0: In the first treatment, plots were maintained at the soil moisture content close to field capacity throughout the experiment (Tensiometer readings were maintained within0 to -5Kpa throughout the trial); * L1:Low stress intensity; plots were maintained at tensiometers readings fluctuated between -30 to -40Kpa from 49 days (7 weeks) after planting until harvesting; * L2: Moderate stress in which water supply was withdrawn until harvesting and the soil moisture maintained between -50 and -60Kpa; * L3: Severe water stress in which tensiometers readings were maintained between-70 and -85Kpa from 7 weeks after planting to harvesting.   The decrease in the head rice ratio observed could be due to the increase of chalkiness related to improper grain filling as reported by Fofana et al. (2011) or fissured grain ( Fofana M, Futakuchi K, Manful JT, Bokossa IY, Dossou J,Bleoussi RTM(2011). Rice grain quality: a comparison of imported varieties, local varieties with new varieties adopted in Benin.Food Control, 2:1821-1825.) this study indicate that water deficit during the reproductive phase reduced the amylose content and the gel consistency of all the varieties regardless of trial Jane et al. (1999) showed that rice pasting properties are affected by amylose content and by the branch chain length distribution of amylopectin (Jane J, Chen YY, Lee LF, McPherson AE, Wong KS, RadosavljevicM, Kasemsuwan T(1999). Effects of amylopectin branch chain length and amylose content on the gelatinization and pasting properties of starch. Cereal Chem. 76: 629-637.) The amylose content is generally thought to be a critical determinant of starch pasting properties because amylose suppresses starch swelling. The amylose helix has an internal hydrophobic tube, providing a space for hydrophobic complexing agents such as lipids Protein is one of the factors that mainly influence the eating quality of rice (Adu-Kwarteng et al., 2003; Futakuchi et al., 2008). (Adu-Kwarteng E, EllisWO, OduroI, Manful J T (2003).(Futakuchi K,Watanabe H, Jones MP (2008). Relationship of grain protein content to other Grain Quality Traits in Interspecific Oryza sativa L x Oryza glaberrima Steud. Progenies. Agric. J. 3(1): 50-57 ) Rice grain quality: a comparison of local varieties with new varieties under study in Ghana. Food Control, 14:507-514)Protein content correlates with cooked rice texture. Protein is also involved in providing structural support to the rice kernel during cooking, thereby restricting starch granule swelling. Thus, treatment with protease, an enzyme that cleaves protein, significantly decreases cooked rice firmness (Saleh and Meullenet, 2007). Negative correlation was found between amylose content and protein content for stressed samples in this study
  • #29 The cultivar Prestige was grown in two different soils (Lunnarp and LaxmansÅkarp) More nitrogen rich and low humus content soil (Lunnarp) resulted in higher grain yield and polymerization of proteins and lower protein concentration than the other soil
  • #30 enzyme carbonic anhydrase accelerating carbohydrate formation, the maximum requirements Zn were enough to accumulate suitable carbohydrate contents. It also activate glutamic dehydrogenase enzyme, synthesis of RNA and DNA enhancing gliadin and glutenin content, which are main protein components of gluten accumulated in the later stages of grain filling
  • #31 The highest value of nitrogen and protein content and was observed at 160 kg N ha- 1. Among the varieties, Prodip is the best one for bed sowing system to maximize the production. The highest grain yield in bed sowing system was due to the maximum tillers plant-1, highest no of grains spike-1 and higher 1000-grain weight. Connor et al. (2003) reported that bed sowing showed significantly higher grain yield as compared to flat sowing.
  • #32 enzyme carbonic anhydrase accelerating carbohydrate formation, the maximum requirements Zn were enough to accumulate suitable carbohydrate contents. It also activate glutamic dehydrogenase enzyme, synthesis of RNA and DNA enhancing gliadin and glutenin content, which are main protein components of gluten accumulated in the later stages of grain filling
  • #33 total carbohydrate and wet gluten content on wheat grain (70.37 and 12.37 per cent, respectively) was recorded with treatment comprising (DTPA-Zn )20 kg Zn ha-1, which was significantly higher than the control. The treatment with application of 2.50, 5 and 10 kg Zn ha-1 was at par to 20 kg Zn ha-1 on both total carbohydrate and wet gluten content on wheat grain. The minimal total carbohydrate and wet gluten content on wheat grain (60.01 and 10.05 per cent, respectively) was recorded in control, which was statistically at par to the treatments with the application of 1.25 kg Zn ha-1 on total carbohydrate and wet gluten content on wheat grain. This indicates that there is value to increase Zn level more than 1.25 kg ha-1 for obtaining high total carbohydrate and wet gluten, of grains. This might be due to Zn contributed in photosynthesis, chlorophyll, metabolism of starch formation and     enzyme carbonic anhydrase accelerating carbohydrate formation, the maximum requirements Zn were enough to accumulate suitable carbohydrate contents. It also activate glutamic dehydrogenase enzyme, synthesis of RNA and DNA enhancing gliadin and glutenin content, which are main protein components of gluten accumulated in the later stages of grain filling . The recommended doses of N, P and K were applied @ 120 N: 60 P2O5: 40 K2O kg ha-1
  • #35 feddan= 4200 m2 metribuzin inhibits photosynthesis by blocking electron transfer from compound Q to plastoquinone in photosystem II (Fedtke, 1982) and hence prevent the reduction of NADP+ required for CO2 fixation. Nitrate accumumulation morein
  • #36 In the 2008 harvest, grain protein concentration was highest in the hand weeded plots (7.99%) followed by the tine cultivated ones (7.56%), the herbicide treated ones (7.31%), the spike hoed ones (7.05%) and the non-weeded control ones (6.61%). Similarly, protein concentration in the 2009 harvest varied from 7.96% (hand weeded plots) to 6.54% (non-weeded plots). The amylose concentration of grain from the hand weeded plots was 22.31% in 2008 and 22.23% in 2009; from the hoed plots the proportions were 22.18% and 22.08%; from the tine cultivated plots 21.30% and 21.22%; from the herbicide treated plots 19.27% and 19.16%; from the spike hoed plots 18.95% and 18.84%, and from the non-weeded control plots 18.63% and 18.56%. The grains water absorption ratios in the 2008 and 2009 harvests were 4.47 and4.39 (hand weeded plots), 4.33 and 4.24 (hoed plots), 4.08 and 3.94 (tine cultivated plots), 3.68 and 3.57 (herbicide treated plots),3.33 and 3.22 (spike hoed plots) and 2.94 and 2.86 (non-weeded control plots). The herbicide treatment (bispyribac sodium @250 mL ha-1 (Nominee 100 SC) ) showed generally less effectiveness than that of hand weeding, hoeing and tine cultivator, but better than that of control and spike hoe. This difference in effectiveness may be a result of the active ingredient of the herbicide and its mode of action, as it inhibits acetolactate synthase(ALS).
  • #37 Kernel protein and amylose contents were noted maximum for the hand pulling and mechanical hoeing followed by the weedy check while they were noted minimum for the chemical weed control treatments (Table 4). Kernel water absorption ratio was noted maximum in the hand pulling treatment and the minimum in pendimethalin Mechanical hoeing resulted in significant increase (25.1 %) in grain yield over control despite lower percentage inhibition in total weed density and dry weight over control compared with the other weed control treatments. This may be due to the enhanced nutrient availability due to soil stirring during carrying out the mechanical hoeing (Arif et al. 2004)(Arif M, Awan IU, Khan HHU (2004) Weed management strategies in wheat (Triticum aestivum L.). Pak J Weed Sci Res 10:11-16 Begum M, Juraimi AS, Amartalingam R, Man BA, Rastans- Bin-Syed SO (2006) The effects of sowing depth and flooding on the emergence, survival, and growth of). Higher harvest index recorded in hand pulling and pretilachlor was due to more grain yield and comparatively lower straw yield recorded in these treatments. Higher percentage of sterile spikelets, opaque and chalky kernels in the weedy check compared with the weed control treatments may be the result of rigorous competition among crop and weeds for nutrients, space, light and carbon dioxide (Tindal et al. 2005).(Tindall KV, Williams BJ, Stout MJ, Geaghan JP, Leonard BR, Webster EP (2005) Yield components and quality of rice in response to graminaceous weed,density and rice stink bug populations. Crop Protec 24: 991-998) Weed free environment was helpful in improving the kernel quality of rice (Singh, 2008c; (Singh S, Ladha JK, Gupta RK, Bhushan L, Rao AN (2008a) Weed management in aerobic rice systems under varying establishment methods. Crop Protec 27: 660-671)Better kernel quality like increased grain length and improved amylose and protein concentrations in the weed control treatments compared with the weedy check were due to less weed competition and healthy rice kernels
  • #39 The decrease in total available lysine during storageat different temperatures could be the result of somestructural changes which inhibited proteolysis and aminoacid solubility (Martin-Cabrejas et al., 1995; Sowunmi,1981). The increase in the soluble sugarscould be the result of activity of endogenous amylases(Kramer, Guyer, & Ide, 1949) whereas the decrease insoluble sugars at 45 C might be due to their involvementin Maillard reactions (Glass, Ponte, Christensen,& Gedder, 1959) Decreases in protein and starch digestibilities could be the result of Maillard reactions, during which free amino groups of protein and carbonyl groups of reducing sugars form complex intermediate compounds by interacting with each other during storage. These complex compounds might have inhibited the activity of proteolytic and amy- lolytic enzymes which ultimately caused distinct reduc- tions in protein and starch digestibilities Nutritional quality of cereal gains was adversely affected as a result of storage at elevated temperatures. Protein and starch digestibilities of cereal grains de- creased to various extents on storage at 25 and 45 C for six months. Significant losses of lysine and thiamine occurred on storage of cereal grains at 25 and 45 C. At 45 C, losses in soluble sugars were also observed during six month s storage of cereal grains. In view of these facts, it is suggested that cereal grains (wheat, maize and rice) should not be stored above 25 C in order to minimize nutrient losses during storage.
  • #40 Grain stored for one year in ferrocement bin retained better germination percentage, starch content and falling number than grain stored in room type store. Ferrocement bin protected stored wheat from deterioration caused by fungi, aflatoxin, and insects while wheat stored in conventional room type store suffered severe damages. Ferrocement bin showed lower grain moisture and grain weight loss throughout the storage period than room type store. The quality of wheat in traditional room type storage system was low and this storage system was inadequate for protecting stored wheat from deterioration. Therefore ferrocement bin has proven to be a promising solution for storage of good quality grain. starch content The higher rate of decrease of starch content in room type store could be due to higher moisture and temperature conditions. decrease in starch content of cereal grains due to the consumption of carbohydrates as a source of energy for growth of fungi during storage Thus, the alpha amylases quickly hydrolyse the starch in the endosperm of the wheat grain, forming sections of glucose sub-units called maltodextrins. The maltodextrins are then hydrolysed by maltase into glucose. Kruger and Tipples (1980) reported that pre-harvest sprouting of grain or sprouting during grain storage at high temperature and moistness builds the level of α- amylase enzyme. The raise in alpha-amylase activity has a very drastic effect on the dough and bread making process. The flour with high α- amylase activity produces a sticky bread crumb together with a low volume, which are detrimental for bread making quality
  • #41 Relative humidity and ambient temperature conditions of the study area ranged from 24.53 to 41.42 °C and 63 to 77%, respectively. This high humidity and temperature condition was suitable for insects and fungal growth which deteriorate stored grain quality. The insects that grow inside the stored grains are actually thermophillic in nature hence they survive even in higher temperature. Insects start to develop when the temperature of grain reach at 18 °C and continue to rise in quantity even at 25 to 35 °C
  • #42 On average, the percentages of whiteness of milled rice was 44.30%, and 44.79%, as ob- tained from paddy dried by high temperature hot air (70 C) and modified air at 30 C, respectively sun-drying and the drying methods using hot air at 40 and 50 C and modified air at 40 C resulted in higher percentages of whiteness of the milled rice.
  • #43 The drying method and storage time, as important post-harvest processing variables for rice grains, have significant effects on the aroma and milling quality of aromatic rice KDML 105 stored as whole grains. An appropriate post-harvest treatment for KDML 105 rice, according to this study, should be one which employs drying methods with low temperature, for example, modified or hot air at 30–40 C, together with as short a storage time as possible to ensure better aroma quality. From the results of this work, drying by hot air at 70 C should be discounted as it gives a percentage of head rice less than one half of that obtained by the other drying methods, regardless of the storage time