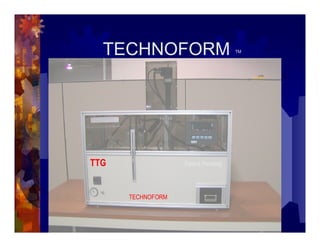
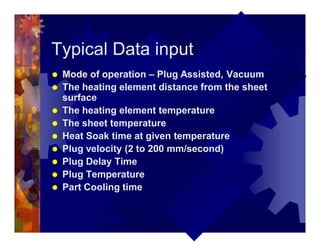
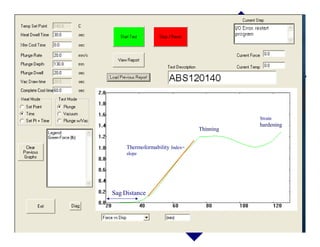
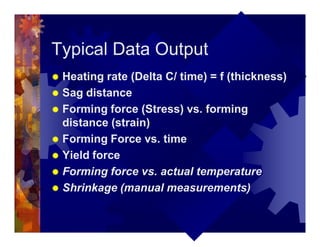
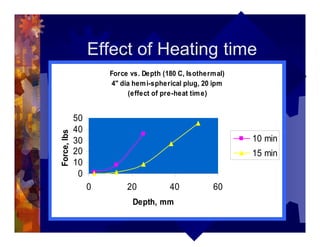
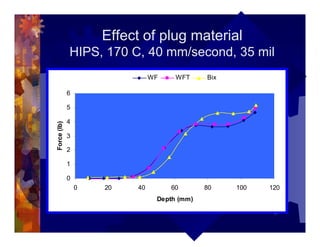
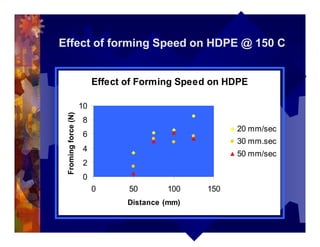
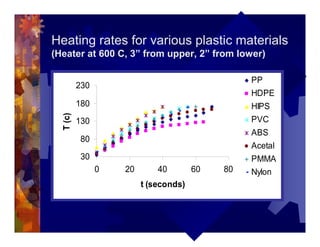
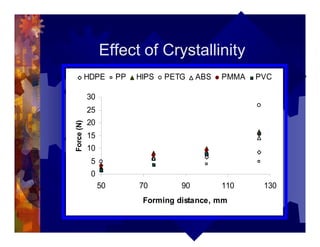
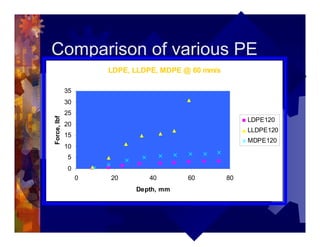
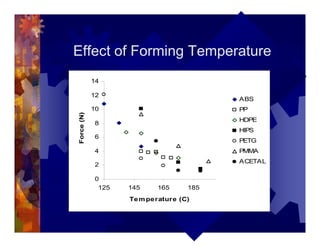
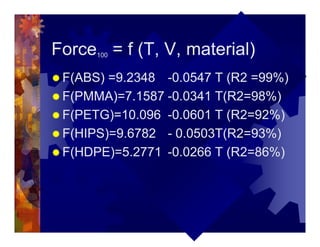
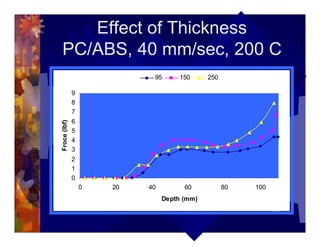
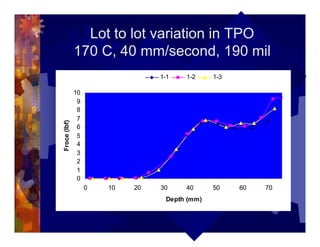
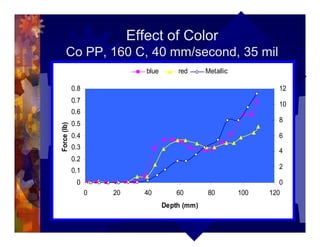
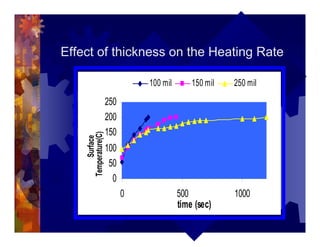
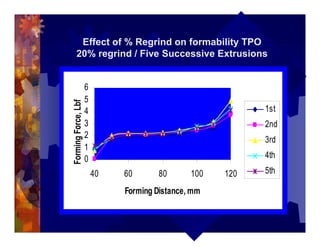
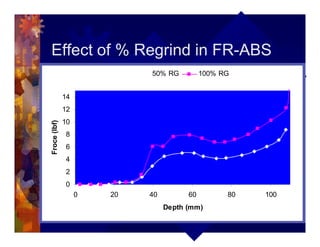
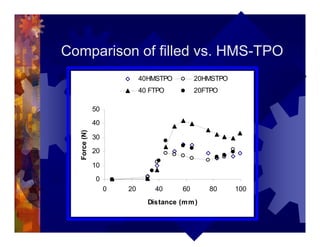
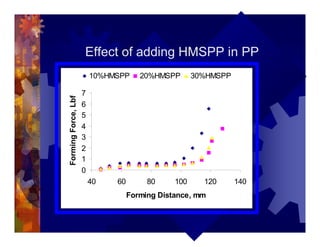
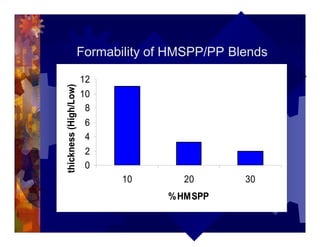
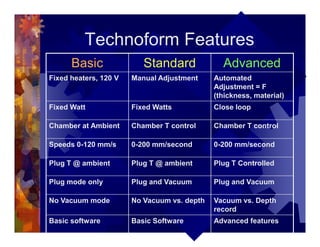
Technoform – For Rapid, Repeatable
Thermoformability Analyses
Dr. Amit Dharia
Transmit Technology Group, LLC, TX
www.transmit-technology.com
Outline
® Properties –Thermoforming Process
relationship
® Current test methods
® Description of Technoform
® Application and data interpretation
® Products – Basic, Standard, Advanced
® Conclusion
Thermoforming Process
® Extruding sheet stock
® Heating sheet above Tg
® Stretching heated sheet in rubbery state
® Cooling
® Trimming
® Finishing
Structure - Properties -
Thermoformability
® Rate of change of strength with the
change in strain rate at forming
temperature
® % Crystallinity – Breadth of rubbery
Plateau
® Molecular weight, Molecular weight
distribution, molecular architecture
(branching, crosslinking) – MFR, Melt
Elasticity
Other parameters
® Density - % filler, type of fillers, degassing
® Geometry – Thickness, area, multi-layered
structures, adhesion between layers
® Residual stresses between and within in
extruded layer sheet stock
® Thermal diffusivity (Cp, K. Rho)
® Extrusion quality ( gels, unmelts,
thickness variation, grain patterns)
® Color (IR absorption)
Current tests
® Low shear melt viscosity (MFR, RMS)
® Melt Tension (Draw Force –Melt
tension, Break Velocity -extension)
® Sag Test (sag distance, sag time)
® Hot Creep Test
® DMA (Relaxation time)
Major disadvantages of current
methods
® Most tests are conducted in melt or near melt
phase
® Test Specimens does not reflect actual test
geometry (shape, size, clamping mode)
® Tests does not account for orientation, thermal
stresses, thickness variations
® Isothermal environment, does not account for
transient nature of heating/ cooling
® Effects of secondary process parameters can not
be evaluated
® Results cannot be directly used.
What processors want to know?
® Will this material thermoform?
® Will this new material process the same?
® Will this lot process the same as the last one?
® Why this lot does not process the same?
® How much time is needed to heat the sheet?
® How fast material will heat?
® What is the right forming temperature range?
® Will melt adhesion between layers survive
heating and stretching step?
® Will material discolor, fed or degrade during
heating?
What processors want to
know? -II
® What is the maximum draw down?
® How fast part can be made?
® What is the MD and TD shrinkage?
® Will material tear at the corners and ribs?
® How much regrind can I use?
® Will grains retain shape and depth?
® Does extruded sheet have gels or
unmelts?
What Industry Needs?
® A standard test method which reflects all unit
steps – heating, 3D stretching, forming, and
cooling
® A test equipment which can be precisely
controlled, is rapid, easy to use, provides
repeatable and quantitative information, using the
lease amount of material.
® Easy to use “Thermoformability Index” standard
for comparing, contrasting effects of selected
process/ material variables
TECHNOFORM TM
Patent PendingTTG
TECHNOFORM
Schematics of Technoform
1
2
3
4
5
7
9
10
12
1113
14
1617
18
19
20
21
22 24
25
26
8
27
1
2
3
4
5
7
9
10
12
1113
14
1617
18
19
20
21
22 24
25
26
8
27
1
2
3
4
5
7
9
10
12
1113
14
1617
18
19
20
21
22 24
25
26
8
27
Typical Data input
® Mode of operation – Plug Assisted, Vacuum
® The heating element distance from the sheet
surface
® The heating element temperature
® The sheet temperature
® Heat Soak time at given temperature
® Plug velocity (2 to 200 mm/second)
® Plug Delay Time
® Plug Temperature
® Part Cooling time
Typical user Input Screen
Sag Distance
Thinning
Strain
hardening
Forming Depth mm
Thermoformability Index=
slope
Typical Data Output
® Heating rate (Delta C/ time) = f (thickness)
® Sag distance
® Forming force (Stress) vs. forming
distance (strain)
® Forming Force vs. time
® Yield force
® Forming force vs. actual temperature
® Shrinkage (manual measurements)
Effect of Heating time
Force vs. Depth (180 C, Isothermal)
4" dia hemi-spherical plug, 20 ipm
(effect of pre-heat time)
0
10
20
30
40
50
0 20 40 60
Depth, mm
Force,lbs
10 min
15 min
Plug Material and Shapes
® Truncated cone with flat end (2.5” Top
D, 0.75 “ Bottom D, 4” Height)
® Truncated cone with Rounded End (2.5”
Top D, 1” D bottom, 4” Height)
® Hemisphere of 3.5” Diameter
® All tools made of Foam Epoxy
Effect of Plug Temperature
35 Mil Black HIPS, 130 C,40 mm/s
- No control -
0
2
4
6
8
10
12
0 50 100 150
Draw Depth, mm
Force,Lbf
Series1
Series2
Series3
Effect of controlling Plug Temperature
HIPS, 40 mm/second with T control
HIPS @130 C, 40 mm/second
Plug cooled for five minutes
0
2
4
6
8
10
12
0 20 40 60 80 100 120
Depth, mm
Force,Lbf
#1
#2
#3
#4
Effect of Plug Geometry
Force vs. Depth 180 C, 40 mm/s
Hemi-Spherical Plug with 4 " Diameter
0
5
10
15
20
25
30
35
0 10 20 30 40 50
Depth mm
Force,lbsf
1
2
Effect of plug material
HIPS, 170 C, 40 mm/second, 35 mil
0
1
2
3
4
5
6
0 20 40 60 80 100 120
Depth (mm)
Force(lb)
WF WFT Bix
Effect of forming Speed on HDPE @ 150 C
Effect of Forming Speed on HDPE
0
2
4
6
8
10
0 50 100 150
Distance (mm)
Fromingforce(N)
20 mm/sec
30 mm.sec
50 mm/sec
Heating rates for various plastic materials
(Heater at 600 C, 3” from upper, 2” from lower)
30
80
130
180
230
0 20 40 60 80
t (seconds)
T(c)
PP
HDPE
HIPS
PVC
ABS
Acetal
PMMA
Nylon
Effect of Crystallinity
0
5
10
15
20
25
30
50 70 90 110 130
Forming distance, mm
Force(N)HDPE PP HIPS PETG ABS PMMA PVC
Comparison of various PE
LDPE, LLDPE, MDPE @ 60 mm/s
0
5
10
15
20
25
30
35
0 20 40 60 80
Depth, mm
Force,lbf
LDPE120
LLDPE120
MDPE120
Effect of Forming Temperature
0
2
4
6
8
10
12
14
125 145 165 185
Temperature (C)
Force(N)
ABS
PP
HDPE
HIPS
PETG
PMMA
ACETAL
Force100 = f (T, V, material)
® F(ABS) =9.2348 -0.0547 T (R2 =99%)
® F(PMMA)=7.1587 -0.0341 T(R2=98%)
® F(PETG)=10.096 -0.0601 T (R2=92%)
® F(HIPS)=9.6782 - 0.0503T(R2=93%)
® F(HDPE)=5.2771 -0.0266 T (R2=86%)
Effect of Thickness
PC/ABS, 40 mm/sec, 200 C
0
1
2
3
4
5
6
7
8
9
0 20 40 60 80 100
Depth (mm)
Froce(lbf)
95 150 250
Lot to lot variation in TPO
170 C, 40 mm/second, 190 mil
0
1
2
3
4
5
6
7
8
9
10
0 10 20 30 40 50 60 70
Depth (mm)
Froce(lbf)
1-1 1-2 1-3
Effect of Color
Co PP, 160 C, 40 mm/second, 35 mil
0
0.1
0.2
0.3
0.4
0.5
0.6
0.7
0.8
0 20 40 60 80 100 120
Depth (mm)
Force(lb)
0
2
4
6
8
10
12
blue red Metallic
Effect of thickness on the Heating Rate
0
50
100
150
200
250
0 500 1000
time (sec)
Surface
Temperature(C)
100 mil 150 mil 250 mil
Effect of % Regrind on formability TPO
20% regrind / Five Successive Extrusions
0
1
2
3
4
5
6
40 60 80 100 120
Forming Distance, mm
FormingForce,Lbf
1st
2nd
3rd
4th
5th
Effect of % Regrind in FR-ABS
0
2
4
6
8
10
12
14
0 20 40 60 80 100
Depth (mm)
Froce(lbf)
50% RG 100% RG
Comparison of filled vs. HMS-TPO
0
10
20
30
40
50
0 20 40 60 80 100
Distance (mm)
Force(N)
40HMSTPO 20HMSTPO
40 FTPO 20FTPO
Effect of adding HMSPP in PP
0
1
2
3
4
5
6
7
40 60 80 100 120 140
Form ing Dist ance, mm
FormingForce,Lbf
10%H MSPP 20%HMS PP 30% HMSPP
0
1
2
3
4
5
6
7
40 60 80 100 120 140
Form ing Dist ance, mm
FormingForce,Lbf
10%H MSPP 20%HMS PP 30% HMSPP
0
1
2
3
4
5
6
7
40 60 80 100 120 140
Forming Distance, mm
FormingForce,Lbf 10%HMSPP 20%HMSPP 30%HMSPP
Formability of HMSPP/PP Blends
0
2
4
6
8
10
12
10 20 30
%HMSPP
thickness(High/Low)
Comparison of Test Methods
Relaxation Time (s) Vs. Force @ 75 mm depth
R2
= 0.9968
0
2
4
6
8
10
12
0 2 4 6 8
Relaxation Time (sec)
FormignFroce(75mm)
PP, 165 C
HDPE,140C
HIPS,160 C
Processing window for E-3500
170 C, 40 mm/s, 190 mil
0
10
20
30
0 20 40 60 80 100
Depth (mm)
Force(lbf)
170 180 190 170TPO
Technoform Features
Basic Standard Advanced
Fixed heaters, 120 V Manual Adjustment Automated
Adjustment = F
(thickness, material)
Fixed Watt Fixed Watts Close loop
Chamber at Ambient Chamber T control Chamber T control
Speeds 0-120 mm/s 0-200 mm/second 0-200 mm/second
Plug T @ ambient Plug T @ ambient Plug T Controlled
Plug mode only Plug and Vacuum Plug and Vacuum
No Vacuum mode No Vacuum vs. depth Vacuum vs. Depth
record
Basic software Basic Software Advanced features
Conclusions
® Technoform is a simple to operate test
equipment is which closely reflects all unit
steps of the typical thermoforming
process and generates quantitative and
repeatable information in short time.
® The test data can be used in raw form to
compare or contrast various materials,
process parameters or can be further
modeled as a design or predictive tool.

Technoform Applications

  • 1.
    Technoform – ForRapid, Repeatable Thermoformability Analyses Dr. Amit Dharia Transmit Technology Group, LLC, TX www.transmit-technology.com
  • 2.
    Outline ® Properties –ThermoformingProcess relationship ® Current test methods ® Description of Technoform ® Application and data interpretation ® Products – Basic, Standard, Advanced ® Conclusion
  • 3.
    Thermoforming Process ® Extrudingsheet stock ® Heating sheet above Tg ® Stretching heated sheet in rubbery state ® Cooling ® Trimming ® Finishing
  • 4.
    Structure - Properties- Thermoformability ® Rate of change of strength with the change in strain rate at forming temperature ® % Crystallinity – Breadth of rubbery Plateau ® Molecular weight, Molecular weight distribution, molecular architecture (branching, crosslinking) – MFR, Melt Elasticity
  • 5.
    Other parameters ® Density- % filler, type of fillers, degassing ® Geometry – Thickness, area, multi-layered structures, adhesion between layers ® Residual stresses between and within in extruded layer sheet stock ® Thermal diffusivity (Cp, K. Rho) ® Extrusion quality ( gels, unmelts, thickness variation, grain patterns) ® Color (IR absorption)
  • 6.
    Current tests ® Lowshear melt viscosity (MFR, RMS) ® Melt Tension (Draw Force –Melt tension, Break Velocity -extension) ® Sag Test (sag distance, sag time) ® Hot Creep Test ® DMA (Relaxation time)
  • 7.
    Major disadvantages ofcurrent methods ® Most tests are conducted in melt or near melt phase ® Test Specimens does not reflect actual test geometry (shape, size, clamping mode) ® Tests does not account for orientation, thermal stresses, thickness variations ® Isothermal environment, does not account for transient nature of heating/ cooling ® Effects of secondary process parameters can not be evaluated ® Results cannot be directly used.
  • 8.
    What processors wantto know? ® Will this material thermoform? ® Will this new material process the same? ® Will this lot process the same as the last one? ® Why this lot does not process the same? ® How much time is needed to heat the sheet? ® How fast material will heat? ® What is the right forming temperature range? ® Will melt adhesion between layers survive heating and stretching step? ® Will material discolor, fed or degrade during heating?
  • 9.
    What processors wantto know? -II ® What is the maximum draw down? ® How fast part can be made? ® What is the MD and TD shrinkage? ® Will material tear at the corners and ribs? ® How much regrind can I use? ® Will grains retain shape and depth? ® Does extruded sheet have gels or unmelts?
  • 10.
    What Industry Needs? ®A standard test method which reflects all unit steps – heating, 3D stretching, forming, and cooling ® A test equipment which can be precisely controlled, is rapid, easy to use, provides repeatable and quantitative information, using the lease amount of material. ® Easy to use “Thermoformability Index” standard for comparing, contrasting effects of selected process/ material variables
  • 11.
  • 12.
    Schematics of Technoform 1 2 3 4 5 7 9 10 12 1113 14 1617 18 19 20 21 2224 25 26 8 27 1 2 3 4 5 7 9 10 12 1113 14 1617 18 19 20 21 22 24 25 26 8 27 1 2 3 4 5 7 9 10 12 1113 14 1617 18 19 20 21 22 24 25 26 8 27
  • 13.
    Typical Data input ®Mode of operation – Plug Assisted, Vacuum ® The heating element distance from the sheet surface ® The heating element temperature ® The sheet temperature ® Heat Soak time at given temperature ® Plug velocity (2 to 200 mm/second) ® Plug Delay Time ® Plug Temperature ® Part Cooling time
  • 14.
    Typical user InputScreen Sag Distance Thinning Strain hardening Forming Depth mm Thermoformability Index= slope
  • 15.
    Typical Data Output ®Heating rate (Delta C/ time) = f (thickness) ® Sag distance ® Forming force (Stress) vs. forming distance (strain) ® Forming Force vs. time ® Yield force ® Forming force vs. actual temperature ® Shrinkage (manual measurements)
  • 16.
    Effect of Heatingtime Force vs. Depth (180 C, Isothermal) 4" dia hemi-spherical plug, 20 ipm (effect of pre-heat time) 0 10 20 30 40 50 0 20 40 60 Depth, mm Force,lbs 10 min 15 min
  • 17.
    Plug Material andShapes ® Truncated cone with flat end (2.5” Top D, 0.75 “ Bottom D, 4” Height) ® Truncated cone with Rounded End (2.5” Top D, 1” D bottom, 4” Height) ® Hemisphere of 3.5” Diameter ® All tools made of Foam Epoxy
  • 18.
    Effect of PlugTemperature 35 Mil Black HIPS, 130 C,40 mm/s - No control - 0 2 4 6 8 10 12 0 50 100 150 Draw Depth, mm Force,Lbf Series1 Series2 Series3
  • 19.
    Effect of controllingPlug Temperature HIPS, 40 mm/second with T control HIPS @130 C, 40 mm/second Plug cooled for five minutes 0 2 4 6 8 10 12 0 20 40 60 80 100 120 Depth, mm Force,Lbf #1 #2 #3 #4
  • 20.
    Effect of PlugGeometry Force vs. Depth 180 C, 40 mm/s Hemi-Spherical Plug with 4 " Diameter 0 5 10 15 20 25 30 35 0 10 20 30 40 50 Depth mm Force,lbsf 1 2
  • 21.
    Effect of plugmaterial HIPS, 170 C, 40 mm/second, 35 mil 0 1 2 3 4 5 6 0 20 40 60 80 100 120 Depth (mm) Force(lb) WF WFT Bix
  • 22.
    Effect of formingSpeed on HDPE @ 150 C Effect of Forming Speed on HDPE 0 2 4 6 8 10 0 50 100 150 Distance (mm) Fromingforce(N) 20 mm/sec 30 mm.sec 50 mm/sec
  • 23.
    Heating rates forvarious plastic materials (Heater at 600 C, 3” from upper, 2” from lower) 30 80 130 180 230 0 20 40 60 80 t (seconds) T(c) PP HDPE HIPS PVC ABS Acetal PMMA Nylon
  • 24.
    Effect of Crystallinity 0 5 10 15 20 25 30 5070 90 110 130 Forming distance, mm Force(N)HDPE PP HIPS PETG ABS PMMA PVC
  • 25.
    Comparison of variousPE LDPE, LLDPE, MDPE @ 60 mm/s 0 5 10 15 20 25 30 35 0 20 40 60 80 Depth, mm Force,lbf LDPE120 LLDPE120 MDPE120
  • 26.
    Effect of FormingTemperature 0 2 4 6 8 10 12 14 125 145 165 185 Temperature (C) Force(N) ABS PP HDPE HIPS PETG PMMA ACETAL
  • 27.
    Force100 = f(T, V, material) ® F(ABS) =9.2348 -0.0547 T (R2 =99%) ® F(PMMA)=7.1587 -0.0341 T(R2=98%) ® F(PETG)=10.096 -0.0601 T (R2=92%) ® F(HIPS)=9.6782 - 0.0503T(R2=93%) ® F(HDPE)=5.2771 -0.0266 T (R2=86%)
  • 28.
    Effect of Thickness PC/ABS,40 mm/sec, 200 C 0 1 2 3 4 5 6 7 8 9 0 20 40 60 80 100 Depth (mm) Froce(lbf) 95 150 250
  • 29.
    Lot to lotvariation in TPO 170 C, 40 mm/second, 190 mil 0 1 2 3 4 5 6 7 8 9 10 0 10 20 30 40 50 60 70 Depth (mm) Froce(lbf) 1-1 1-2 1-3
  • 30.
    Effect of Color CoPP, 160 C, 40 mm/second, 35 mil 0 0.1 0.2 0.3 0.4 0.5 0.6 0.7 0.8 0 20 40 60 80 100 120 Depth (mm) Force(lb) 0 2 4 6 8 10 12 blue red Metallic
  • 31.
    Effect of thicknesson the Heating Rate 0 50 100 150 200 250 0 500 1000 time (sec) Surface Temperature(C) 100 mil 150 mil 250 mil
  • 32.
    Effect of %Regrind on formability TPO 20% regrind / Five Successive Extrusions 0 1 2 3 4 5 6 40 60 80 100 120 Forming Distance, mm FormingForce,Lbf 1st 2nd 3rd 4th 5th
  • 33.
    Effect of %Regrind in FR-ABS 0 2 4 6 8 10 12 14 0 20 40 60 80 100 Depth (mm) Froce(lbf) 50% RG 100% RG
  • 34.
    Comparison of filledvs. HMS-TPO 0 10 20 30 40 50 0 20 40 60 80 100 Distance (mm) Force(N) 40HMSTPO 20HMSTPO 40 FTPO 20FTPO
  • 35.
    Effect of addingHMSPP in PP 0 1 2 3 4 5 6 7 40 60 80 100 120 140 Form ing Dist ance, mm FormingForce,Lbf 10%H MSPP 20%HMS PP 30% HMSPP 0 1 2 3 4 5 6 7 40 60 80 100 120 140 Form ing Dist ance, mm FormingForce,Lbf 10%H MSPP 20%HMS PP 30% HMSPP 0 1 2 3 4 5 6 7 40 60 80 100 120 140 Forming Distance, mm FormingForce,Lbf 10%HMSPP 20%HMSPP 30%HMSPP
  • 36.
    Formability of HMSPP/PPBlends 0 2 4 6 8 10 12 10 20 30 %HMSPP thickness(High/Low)
  • 37.
    Comparison of TestMethods Relaxation Time (s) Vs. Force @ 75 mm depth R2 = 0.9968 0 2 4 6 8 10 12 0 2 4 6 8 Relaxation Time (sec) FormignFroce(75mm) PP, 165 C HDPE,140C HIPS,160 C
  • 38.
    Processing window forE-3500 170 C, 40 mm/s, 190 mil 0 10 20 30 0 20 40 60 80 100 Depth (mm) Force(lbf) 170 180 190 170TPO
  • 39.
    Technoform Features Basic StandardAdvanced Fixed heaters, 120 V Manual Adjustment Automated Adjustment = F (thickness, material) Fixed Watt Fixed Watts Close loop Chamber at Ambient Chamber T control Chamber T control Speeds 0-120 mm/s 0-200 mm/second 0-200 mm/second Plug T @ ambient Plug T @ ambient Plug T Controlled Plug mode only Plug and Vacuum Plug and Vacuum No Vacuum mode No Vacuum vs. depth Vacuum vs. Depth record Basic software Basic Software Advanced features
  • 40.
    Conclusions ® Technoform isa simple to operate test equipment is which closely reflects all unit steps of the typical thermoforming process and generates quantitative and repeatable information in short time. ® The test data can be used in raw form to compare or contrast various materials, process parameters or can be further modeled as a design or predictive tool.