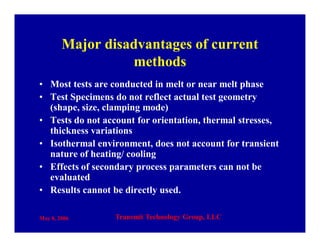
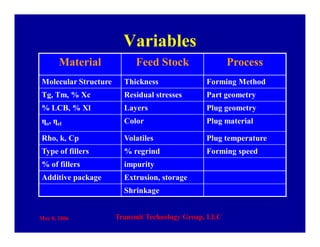
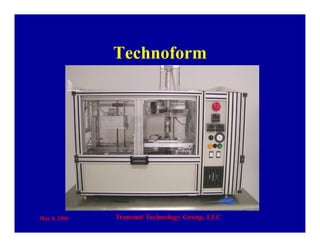
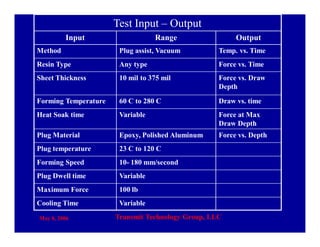
This document discusses applications of a thermoformability analyzer to test and analyze plastic materials. It begins by outlining the need for a standardized quantitative test method for measuring thermoformability. It then describes the structure-property relationships that impact thermoformability and limitations of current test methods. The document outlines the thermoformability analyzer, which aims to address current limitations through a test that reflects the full thermoforming process. It presents various results the analyzer can provide on factors that influence thermoformability and how these results can help processors. Finally, it proposes a thermoforming index to standardize comparing materials' thermoformability.


![May 8, 2006 Transmit Technology Group, LLC
How to Standardize?
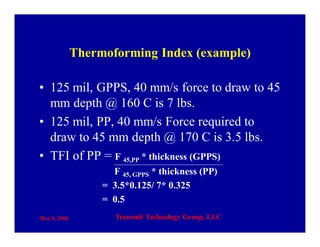
• Thermoforming Index (TFI)
– Force required to draw a sheet of thickness X at
speed Y mm/second using a Plug of specified
geometry G at Temperature Tf to area ratio A
(or volume ratio V), with plug temperature Tp.
• TFI = [Force (M, Tm)/ Force (GPPS, Ts)]](https://image.slidesharecdn.com/dbc81352-4d8a-4b57-b0ef-a7104ac8c2f0-160816202412/85/SPE-Aug15-43-320.jpg)


![[BLT] 연구개발 프로세스에 따른_강한_특허_전략_v1.3_엄](https://cdn.slidesharecdn.com/ss_thumbnails/v1-140409024018-phpapp02-thumbnail.jpg?width=640&height=640&fit=bounds)