Download to read offline


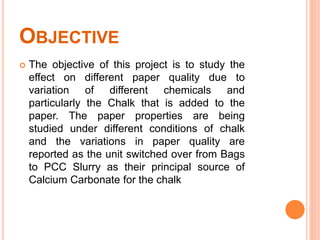
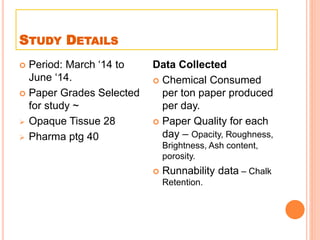
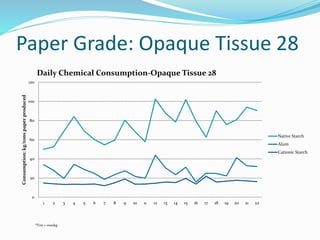


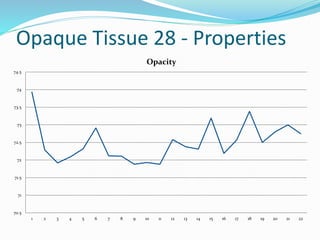

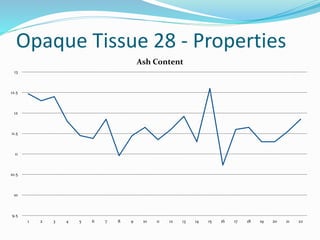


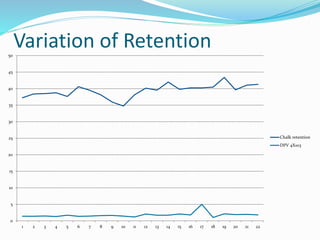
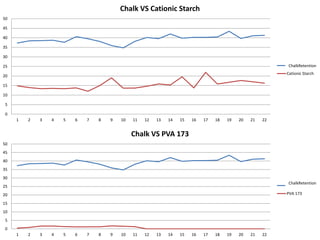


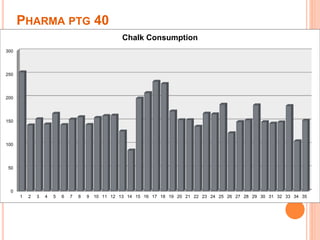
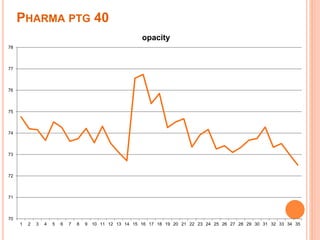
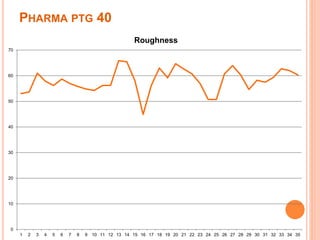

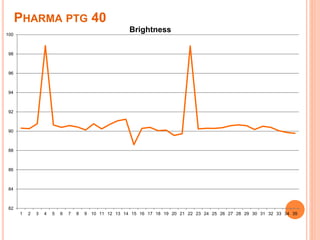
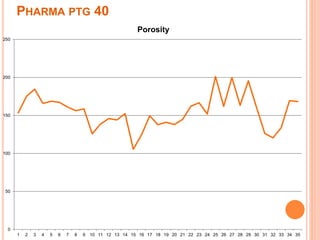

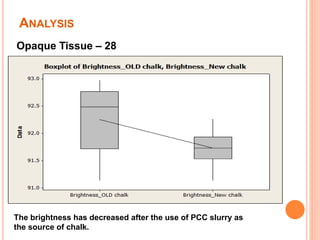

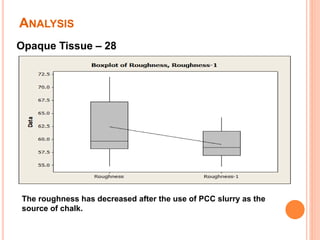
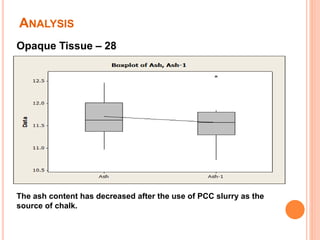
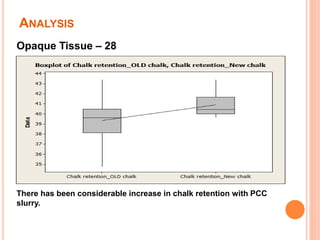
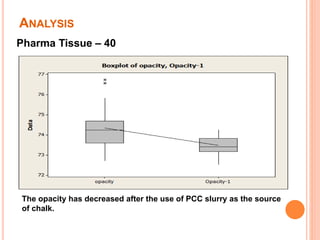

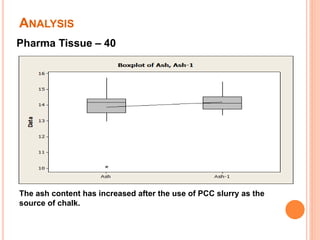

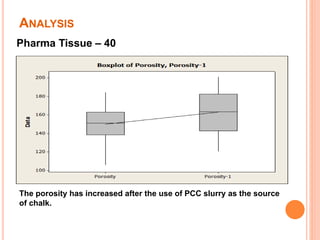

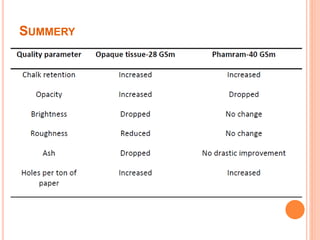


This document summarizes a study on the effect of replacing bag chalk with precipitated calcium carbonate (PCC) slurry as the primary source of calcium carbonate filler in paper production. Data was collected on chemical consumption, paper properties, and chalk retention for two paper grades - Opaque Tissue 28 and Pharma PTG 40 - over approximately three months when the process switched to using PCC slurry. Analysis of the data found that for Opaque Tissue 28, brightness, opacity, roughness, and ash content decreased with PCC slurry while chalk retention increased. For Pharma PTG 40, opacity decreased while roughness, ash content, brightness, porosity, and chalk retention increased with PCC sl


