Download as PDF, PPTX
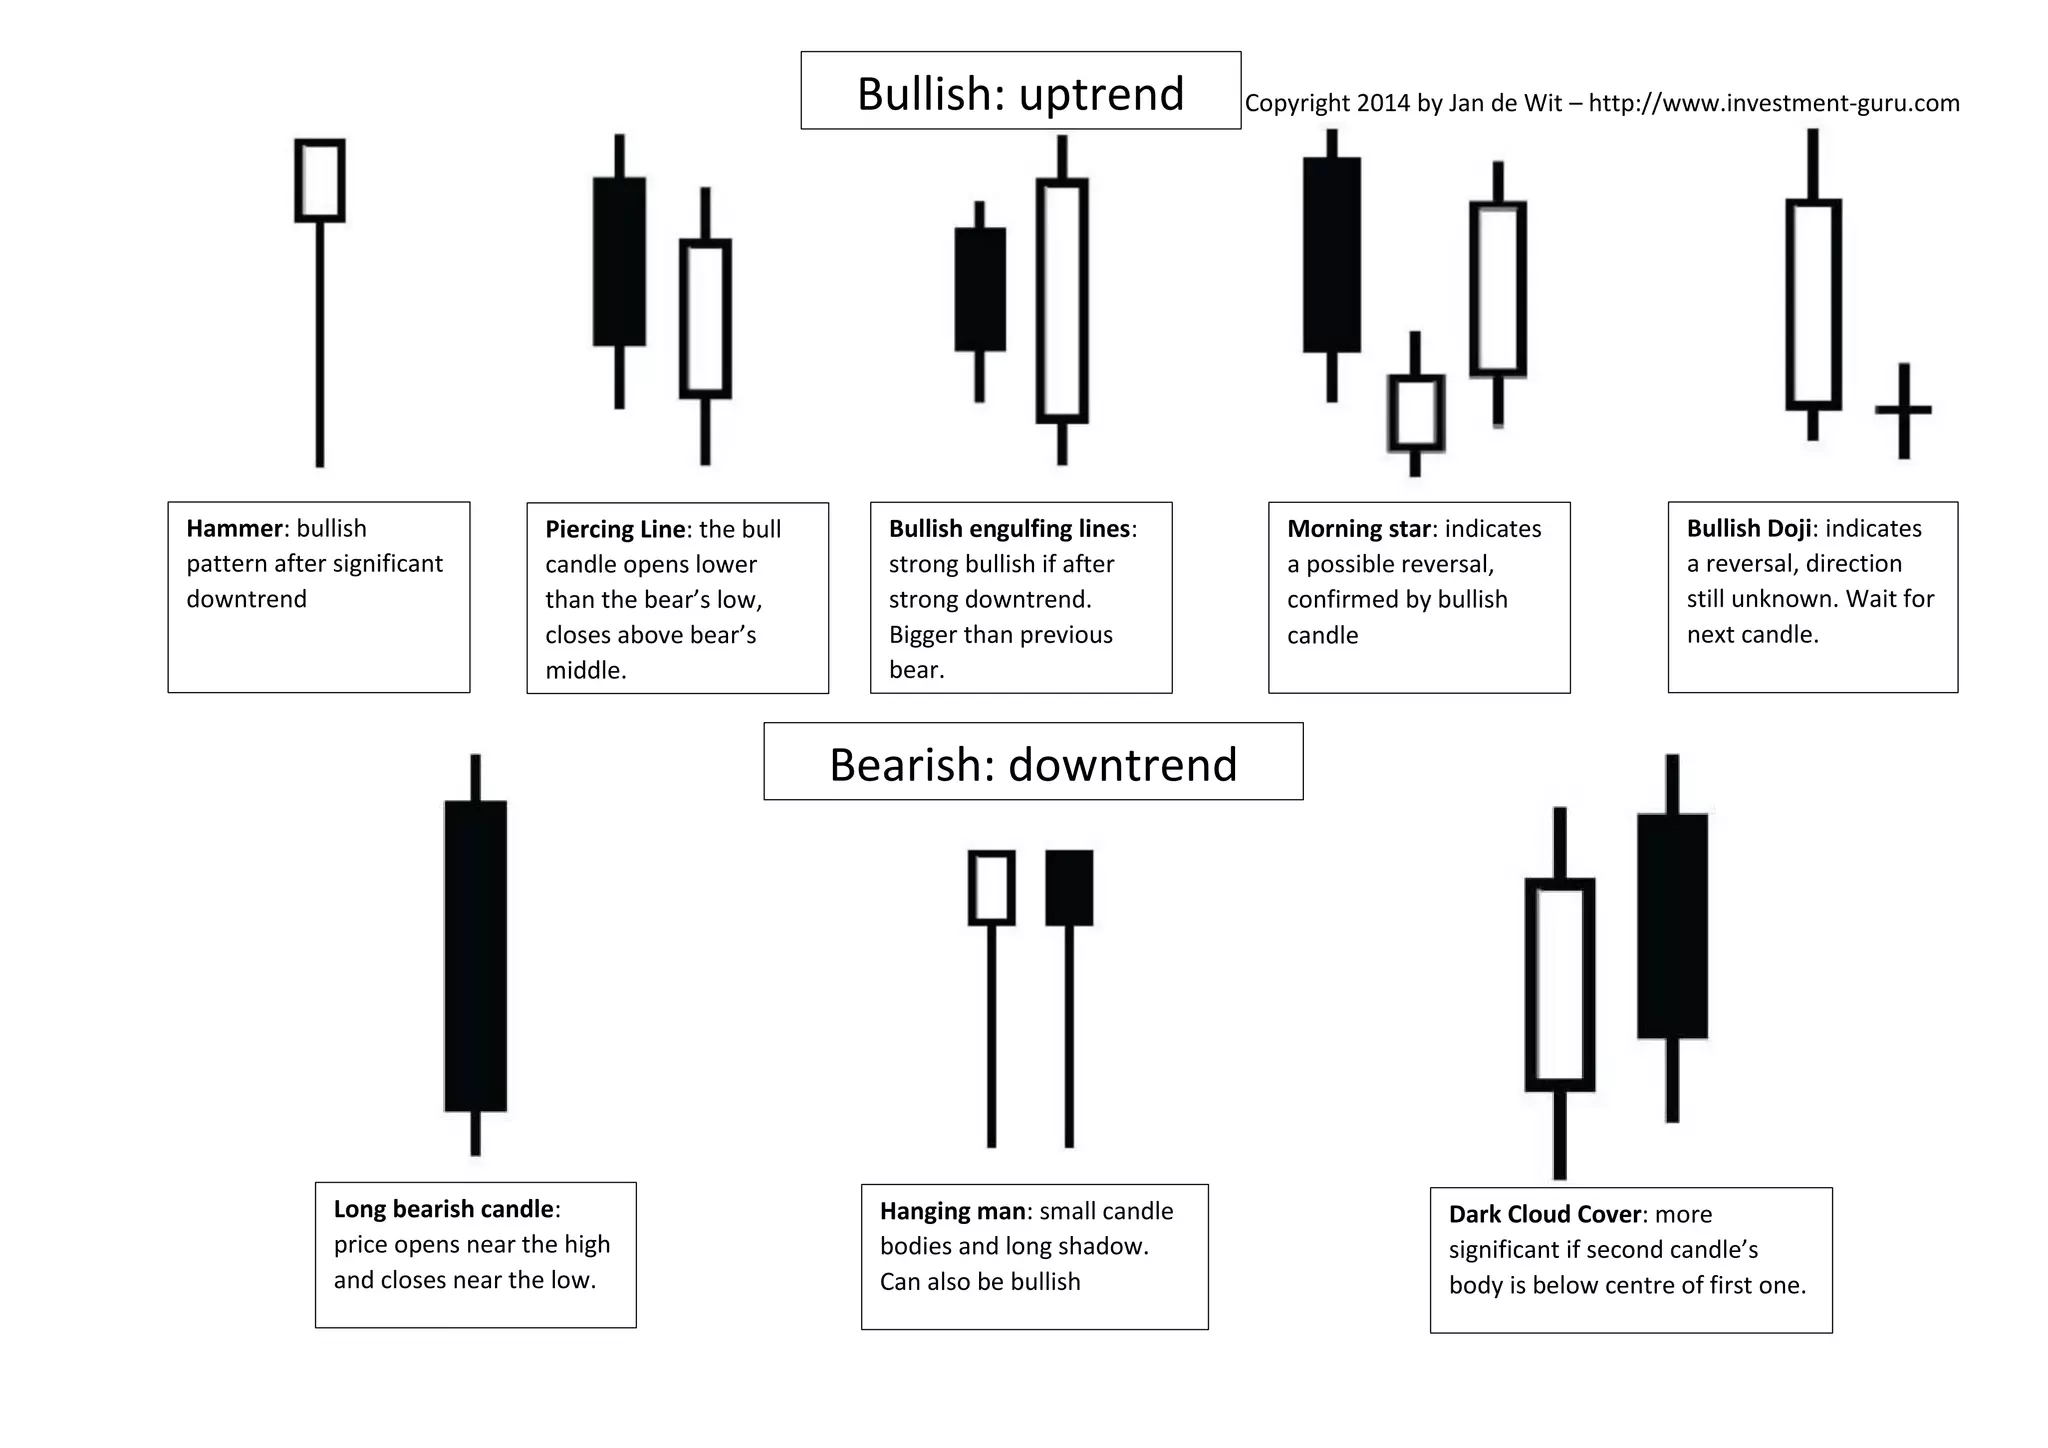
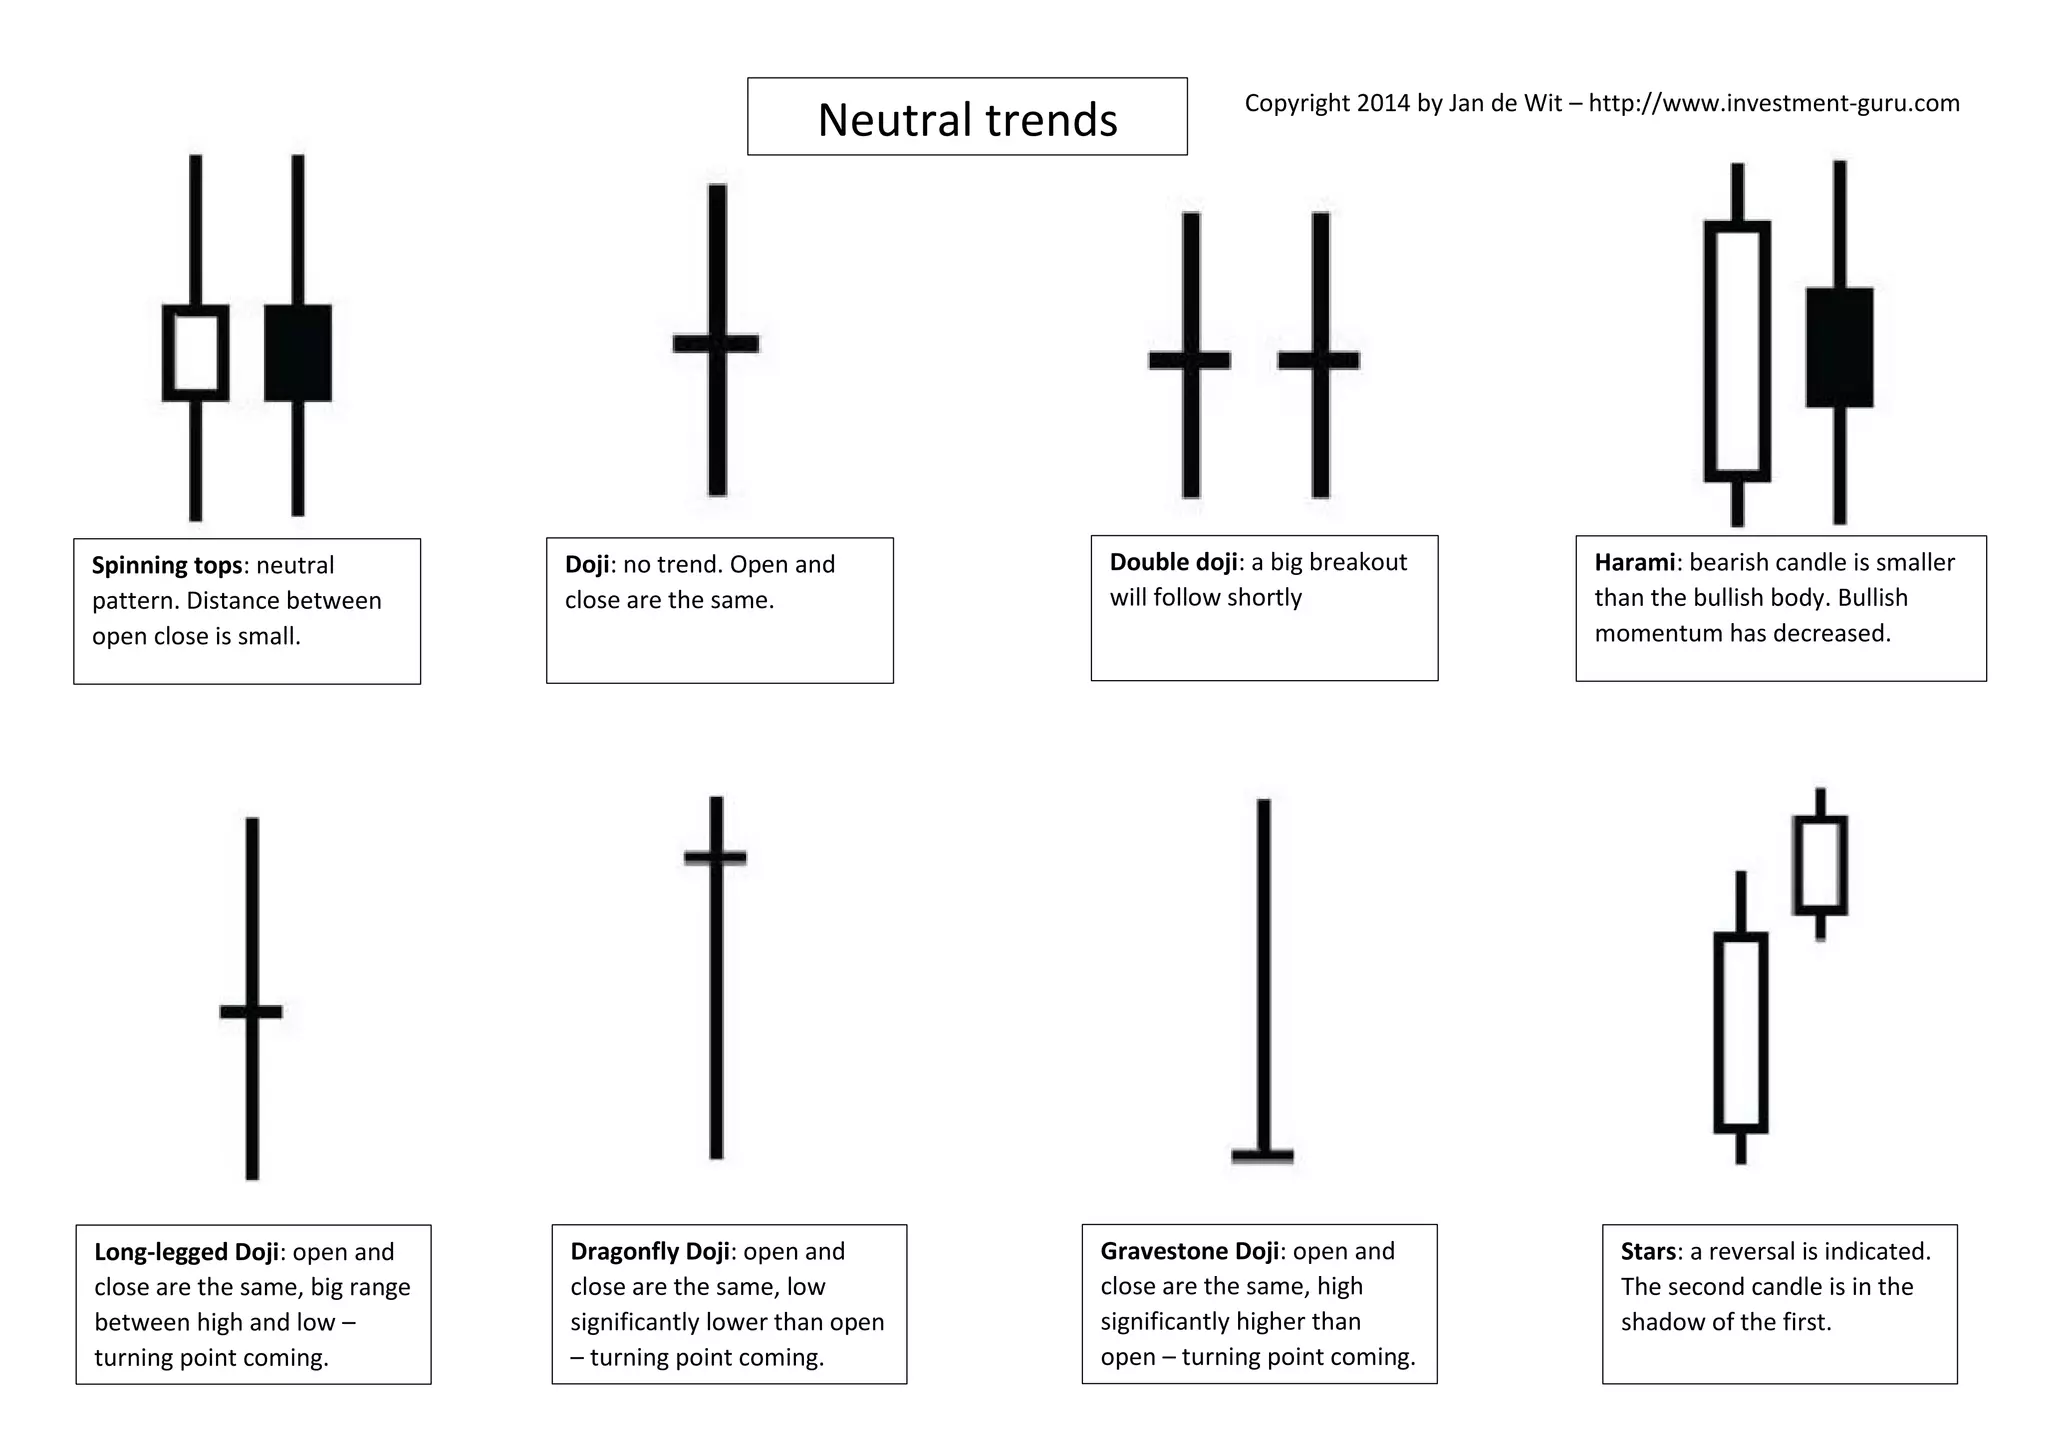

This document defines and describes various candlestick patterns used in technical analysis for stock trading, including bullish patterns like hammer and piercing line that indicate reversals from downtrends, as well as bearish patterns like hanging man, dark cloud cover, and doji variations that signal potential trend changes. It provides brief explanations of common candlestick formations and their implications for identifying bullish or bearish market momentum.


