Introduction
Technical Analysisis the study of market action, primarily
through the use of charts, for the purpose of forecasting future
price trends.
Technicians (also known as quantitative analysts or chartists)
usually look at price, volume and psychological indicators
over time.
They are looking for trends and patterns in the data that
indicate future price movements.
3.
Technical Analysis
The BasicAssumption
The Market Discount Everything
Price Moves In Trends
History Tends To Repeat Itself
4.
Strength & Weaknessof
Technical Analysis
Strength Weakness
• Focus on Price Analyst Bias
• Supply, Demand and Open to Interpretation
Price Action Too Late
• Support/Resistance Always Another Level
• Pictorial Price History Trader’s Remorse
• Assist with Entry Point
5.
Chart Type
ChartingStocks
• Bar Charts and Japanese Candlestick Charts
• Point and Figure Charts
• Line Chart
Major Chart Patterns
Price-based Indicators
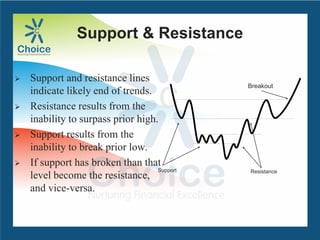
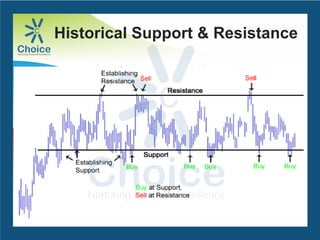
Support & Resistance
Support and resistance lines
indicate likely end of trends.
Resistance results from the
inability to surpass prior high.
Support results from the
inability to break prior low.
If support has broken than that
level become the resistance,
and vice-versa.
Support Resistance
Breakout
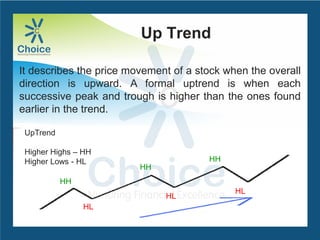
Up Trend
It describesthe price movement of a stock when the overall
direction is upward. A formal uptrend is when each
successive peak and trough is higher than the ones found
earlier in the trend.
UpTrend
Higher Highs – HH
Higher Lows - HL
HH
HH
HH
HL
HL
HL
11.
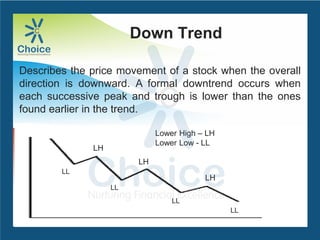
Down Trend
Describes theprice movement of a stock when the overall
direction is downward. A formal downtrend occurs when
each successive peak and trough is lower than the ones
found earlier in the trend.
Lower High – LH
Lower Low - LL
LL
LL
LL
LL
LH
LH
LH
12.
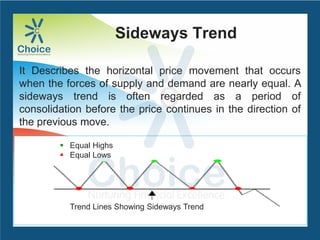
Sideways Trend
It Describesthe horizontal price movement that occurs
when the forces of supply and demand are nearly equal. A
sideways trend is often regarded as a period of
consolidation before the price continues in the direction of
the previous move.
Equal Highs
Equal Lows
Trend Lines Showing Sideways Trend
13.
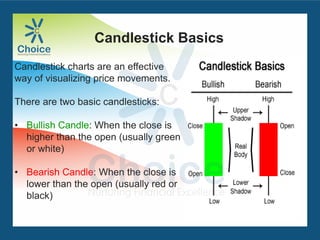
Candlestick charts arean effective
way of visualizing price movements.
There are two basic candlesticks:
• Bullish Candle: When the close is
higher than the open (usually green
or white)
• Bearish Candle: When the close is
lower than the open (usually red or
black)
Candlestick Basics
14.
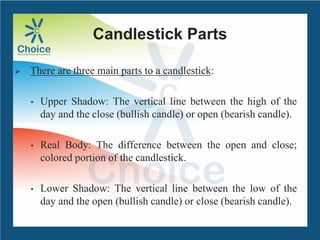
Candlestick Parts
Thereare three main parts to a candlestick:
• Upper Shadow: The vertical line between the high of the
day and the close (bullish candle) or open (bearish candle).
• Real Body: The difference between the open and close;
colored portion of the candlestick.
• Lower Shadow: The vertical line between the low of the
day and the open (bullish candle) or close (bearish candle).
15.
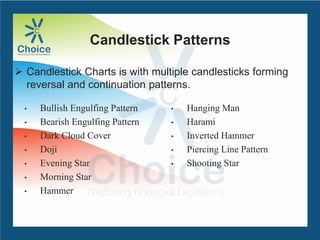
Candlestick Patterns
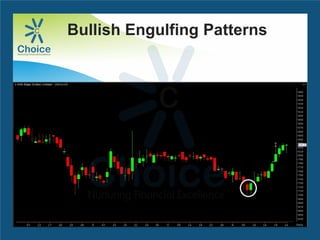
• BullishEngulfing Pattern
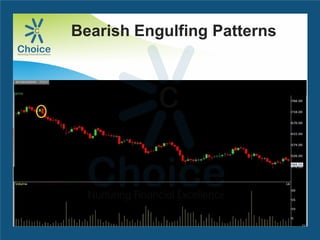
• Bearish Engulfing Pattern
• Dark Cloud Cover
• Doji
• Evening Star
• Morning Star
• Hammer
• Hanging Man
• Harami
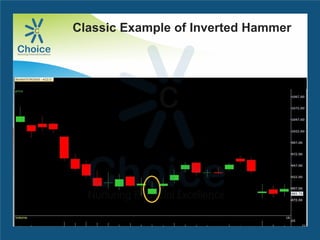
• Inverted Hammer
• Piercing Line Pattern
• Shooting Star
Candlestick Charts is with multiple candlesticks forming
reversal and continuation patterns.
16.
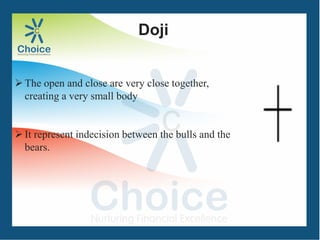
The open andclose are very close together,
creating a very small body
It represent indecision between the bulls and the
bears.
Doji
17.
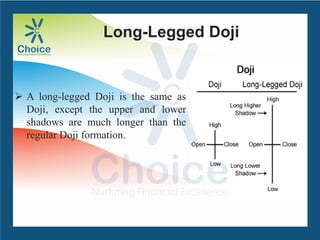
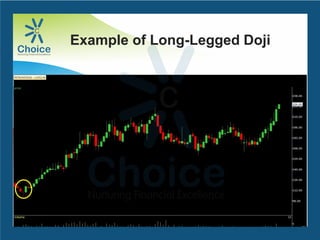
Long-Legged Doji
Along-legged Doji is the same as
Doji, except the upper and lower
shadows are much longer than the
regular Doji formation.
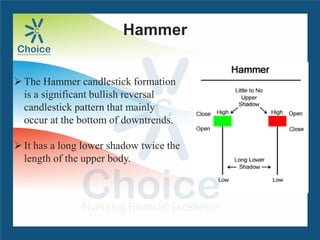
The Hammer candlestickformation
is a significant bullish reversal
candlestick pattern that mainly
occur at the bottom of downtrends.
It has a long lower shadow twice the
length of the upper body.
Hammer
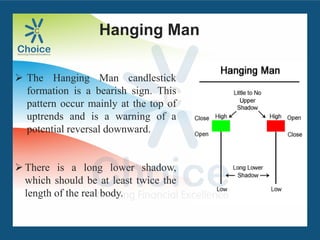
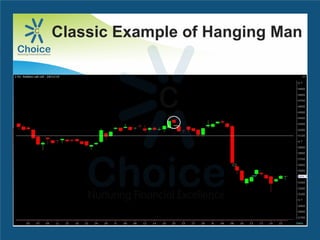
The HangingMan candlestick
formation is a bearish sign. This
pattern occur mainly at the top of
uptrends and is a warning of a
potential reversal downward.
There is a long lower shadow,
which should be at least twice the
length of the real body.
Hanging Man
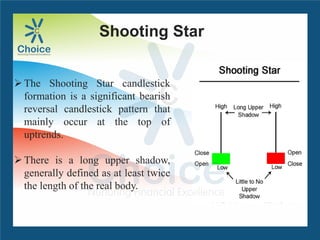
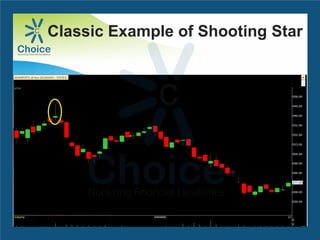
The Shooting Starcandlestick
formation is a significant bearish
reversal candlestick pattern that
mainly occur at the top of
uptrends.
There is a long upper shadow,
generally defined as at least twice
the length of the real body.
Shooting Star
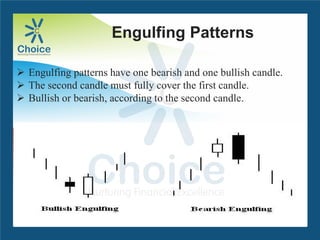
Engulfing Patterns
Engulfingpatterns have one bearish and one bullish candle.
The second candle must fully cover the first candle.
Bullish or bearish, according to the second candle.
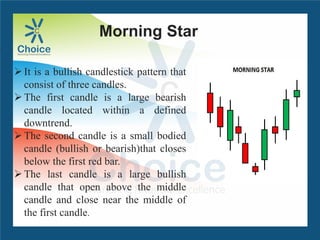
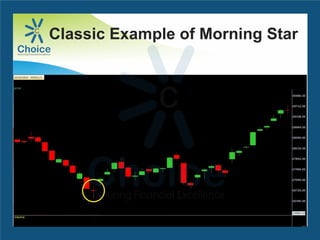
Morning Star
It isa bullish candlestick pattern that
consist of three candles.
The first candle is a large bearish
candle located within a defined
downtrend.
The second candle is a small bodied
candle (bullish or bearish)that closes
below the first red bar.
The last candle is a large bullish
candle that open above the middle
candle and close near the middle of
the first candle.
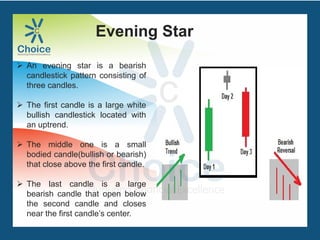
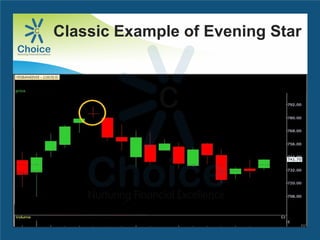
An eveningstar is a bearish
candlestick pattern consisting of
three candles.
The first candle is a large white
bullish candlestick located with
an uptrend.
The middle one is a small
bodied candle(bullish or bearish)
that close above the first candle.
The last candle is a large
bearish candle that open below
the second candle and closes
near the first candle’s center.
Evening Star
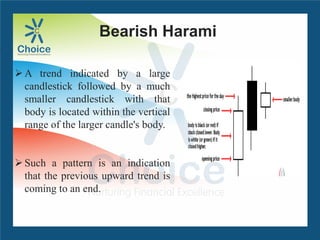
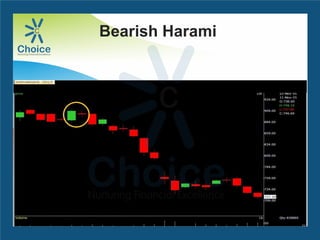
A trend indicatedby a large
candlestick followed by a much
smaller candlestick with that
body is located within the vertical
range of the larger candle's body.
Such a pattern is an indication
that the previous upward trend is
coming to an end.
Bearish Harami
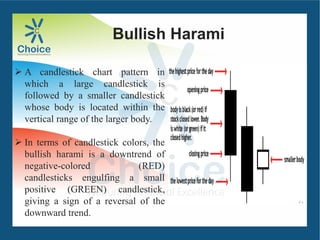
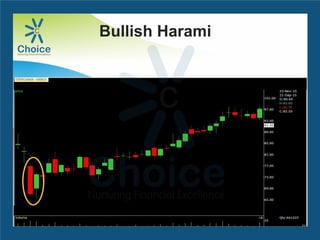
Bullish Harami
Acandlestick chart pattern in
which a large candlestick is
followed by a smaller candlestick
whose body is located within the
vertical range of the larger body.
In terms of candlestick colors, the
bullish harami is a downtrend of
negative-colored (RED)
candlesticks engulfing a small
positive (GREEN) candlestick,
giving a sign of a reversal of the
downward trend.
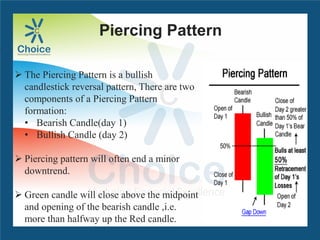
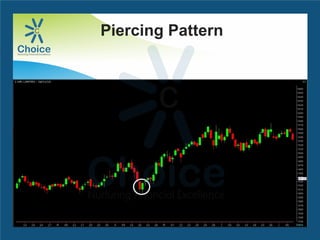
Piercing Pattern
ThePiercing Pattern is a bullish
candlestick reversal pattern, There are two
components of a Piercing Pattern
formation:
• Bearish Candle(day 1)
• Bullish Candle (day 2)
Piercing pattern will often end a minor
downtrend.
Green candle will close above the midpoint
and opening of the bearish candle ,i.e.
more than halfway up the Red candle.
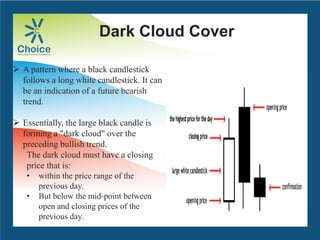
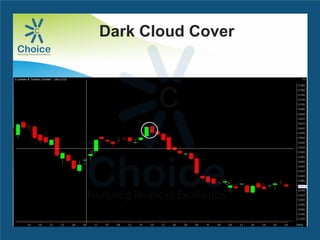
A patternwhere a black candlestick
follows a long white candlestick. It can
be an indication of a future bearish
trend.
Essentially, the large black candle is
forming a "dark cloud" over the
preceding bullish trend.
The dark cloud must have a closing
price that is:
• within the price range of the
previous day.
• But below the mid-point between
open and closing prices of the
previous day.
Dark Cloud Cover
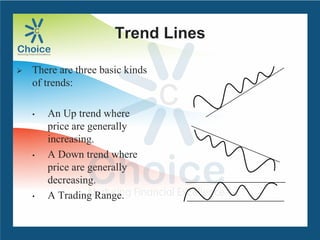
Trend Lines
Thereare three basic kinds
of trends:
• An Up trend where
price are generally
increasing.
• A Down trend where
price are generally
decreasing.
• A Trading Range.
47.
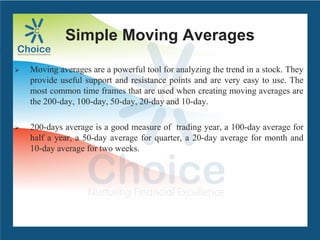
Simple Moving Averages
Moving averages are used to identify current trends and trend reversals as
well as to set up support and resistance levels.
Moving averages can be used to quickly identify whether a stock is moving
in an uptrend or a downtrend depending on the direction of the moving
average. when a moving average is heading upward and the price is above it,
the stock is in uptrend. Conversely, a downward sloping moving average
with the price below can be used to signal a downtrend.
Another method of determining momentum is to look at the order of a pair
of moving averages. When a short-term average is above a longer-term
average, the trend is up. On the other hand, a long-term average above a
shorter-term average signals a downward movement in the trend.
Conti…
48.
Simple Moving Averages
Moving averages are a powerful tool for analyzing the trend in a stock. They
provide useful support and resistance points and are very easy to use. The
most common time frames that are used when creating moving averages are
the 200-day, 100-day, 50-day, 20-day and 10-day.
200-days average is a good measure of trading year, a 100-day average for
half a year, a 50-day average for quarter, a 20-day average for month and
10-day average for two weeks.
49.
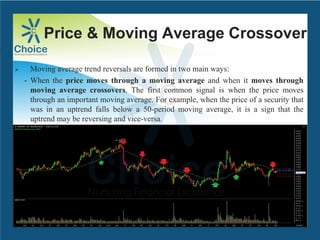
Price & MovingAverage Crossover
Moving average trend reversals are formed in two main ways:
• When the price moves through a moving average and when it moves through
moving average crossovers. The first common signal is when the price moves
through an important moving average. For example, when the price of a security that
was in an uptrend falls below a 50-period moving average, it is a sign that the
uptrend may be reversing and vice-versa.
50.
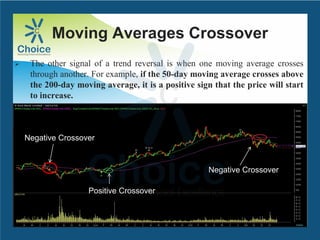
Moving Averages Crossover
The other signal of a trend reversal is when one moving average crosses
through another. For example, if the 50-day moving average crosses above
the 200-day moving average, it is a positive sign that the price will start
to increase.
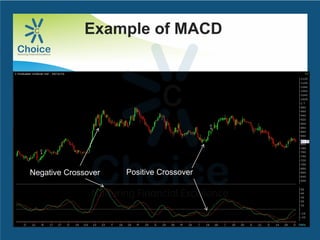
Positive Crossover
Negative Crossover
Negative Crossover
51.
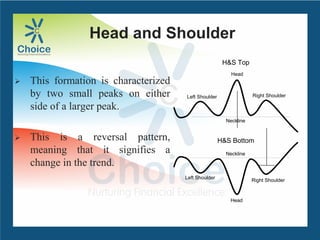
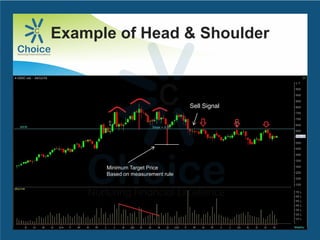
Head and Shoulder
This formation is characterized
by two small peaks on either
side of a larger peak.
This is a reversal pattern,
meaning that it signifies a
change in the trend.
Head
Head
Left Shoulder
Left Shoulder
Right Shoulder
Right Shoulder
Neckline
Neckline
H&S Top
H&S Bottom
52.
Example of Head& Shoulder
Sell Signal
Minimum Target Price
Based on measurement rule
Sell Signal
Minimum Target Price
Based on measurement rule
53.
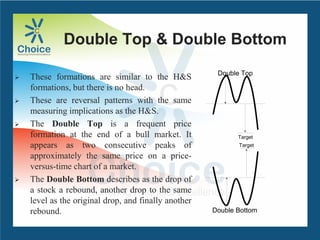
Double Top &Double Bottom
These formations are similar to the H&S
formations, but there is no head.
These are reversal patterns with the same
measuring implications as the H&S.
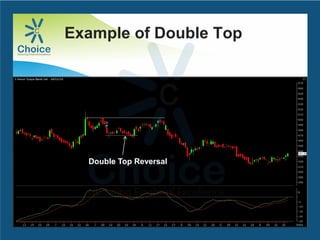
The Double Top is a frequent price
formation at the end of a bull market. It
appears as two consecutive peaks of
approximately the same price on a price-
versus-time chart of a market.
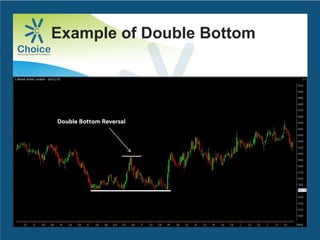
The Double Bottom describes as the drop of
a stock a rebound, another drop to the same
level as the original drop, and finally another
rebound.
Target
Double Top
Double Bottom
Target
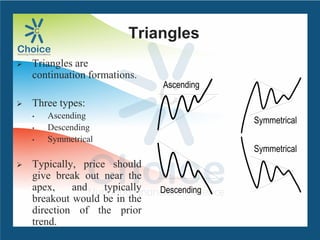
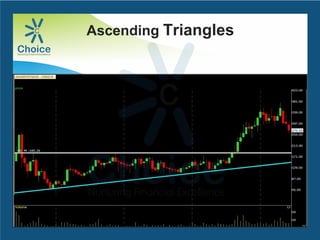
Triangles
Triangles are
continuationformations.
Three types:
• Ascending
• Descending
• Symmetrical
Typically, price should
give break out near the
apex, and typically
breakout would be in the
direction of the prior
trend.
Ascending
Descending
Symmetrical
Symmetrical
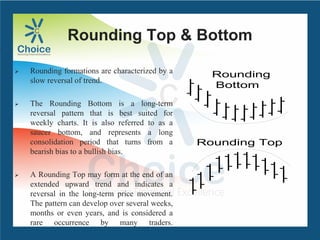
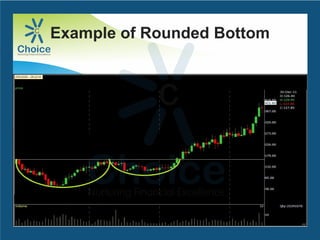
Rounding Top &Bottom
Rounding formations are characterized by a
slow reversal of trend.
The Rounding Bottom is a long-term
reversal pattern that is best suited for
weekly charts. It is also referred to as a
saucer bottom, and represents a long
consolidation period that turns from a
bearish bias to a bullish bias.
A Rounding Top may form at the end of an
extended upward trend and indicates a
reversal in the long-term price movement.
The pattern can develop over several weeks,
months or even years, and is considered a
rare occurrence by many traders.
Rounding Top
Rounding
Bottom
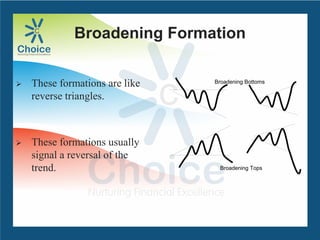
Broadening Formation
Theseformations are like
reverse triangles.
These formations usually
signal a reversal of the
trend. Broadening Tops
Broadening Bottoms
61.
Technical Indicators
Thereare, literally, hundreds of technical indicators used to
generate buy and sell signals.
We will look at few of the major indicators:
• Moving Average Convergence/Divergence (MACD)
• Relative Strength Index (RSI)
• Bollinger Bands
62.
MACD
MACD wasdeveloped by Gerald Appel as a way to keep track of a moving
average crossover system.
The MACD fluctuates above and below the zero line as the moving averages
converge, cross and diverge.
Traders can look for signal line crossovers, centerline crossovers and
divergences to generate signals.
When the signal line goes from negative to positive, a buy signal is
generated.
When the signal line goes from positive to negative, a sell signal is
generated.
MACD is best used in choppy (trendless) markets, and is subject to
whipsaws (in and out rapidly with little or no profit).
Relative Strength Index(RSI)
RSI was developed by Welles Wilder as an oscillator to gauge
overbought/oversold levels.
The most important thing to understand about RSI is that a
level above 70 indicates a stock is overbought, and a level
below 30 indicates that it is oversold (it can range from 0 to
100).
Also, realize that stocks can remain overbought or oversold for
long periods of time, so RSI alone isn’t always a great timing
tool.
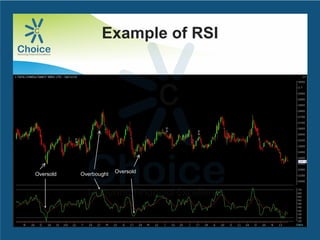
65.
RSI
A technicalanalysis tool that is banded between two extreme
values and built with the results from a trend indicator for
discovering short term overbought and over sold conditions. As
the value of the oscillator approach the upper extreme value,
the stock seem to be over bought and as it approaches to lower
extreme level, it seems to be over sold.
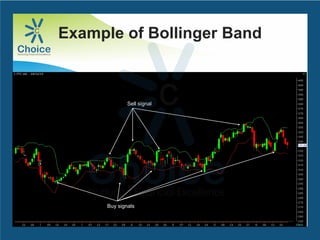
Bollinger Band
Bollingerbands were created by John Bollinger (former FNN
technical analyst, and regular guest on CNBC).
Bollinger Bands are based on a moving average of the closing
price.
They are two standard deviations above and below the moving
average.
A buy signal is given when the stock price closes below the
lower band, and a sell signal is given when the stock price
closes above the upper band.
When the bands contract, that is a signal that a big move is
expecting, but it is impossible to say if it will be up or down.