Download as PPS, PPTX

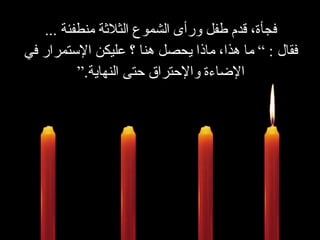
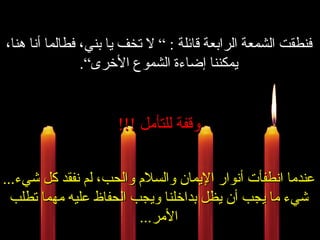
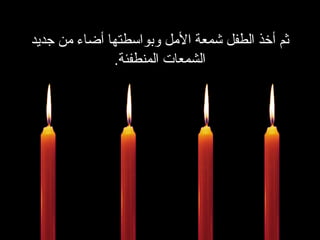
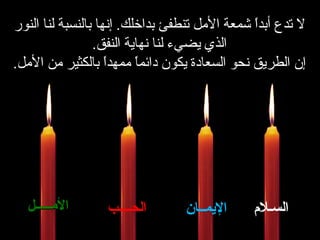
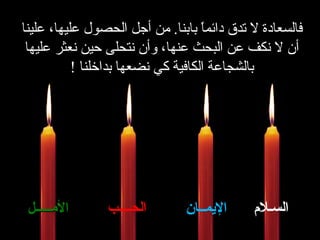


تتحدث الوثيقة عن أربع شموع تمثل السلام، الإيمان، الحب، والأمل، حيث تنطفئ الشموع الثلاث الأولى بسبب عدم تقدير الناس لها. يظهر طفل ينبه الشموع إلى أهمية استمرار الإضاءة، ويدعو لإبقاء شمعة الأمل مشتعلة لتضيء الطريق نحو السعادة. تشجع الوثيقة على الحفاظ على الأمل والإيمان والمحبة في الحياة.


