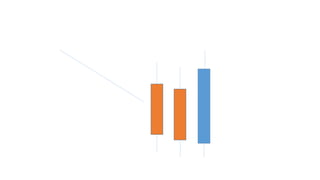
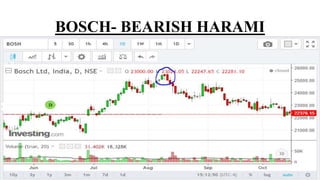
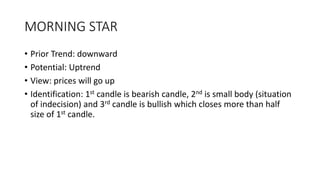
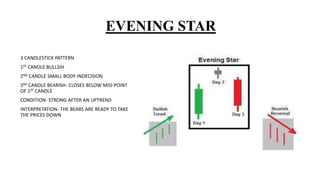
Candlestick patterns provide a visual way to analyze stock prices and identify signals about market sentiment and potential trend reversals. The document describes several common candlestick patterns including hammer, hanging man, inverted hammer, shooting star, bullish/bearish engulfing, piercing, bullish/bearish harami, morning star, evening star, and doji. Each pattern has a specific formation and indicates whether the trend may be reversing from up to down or down to up.