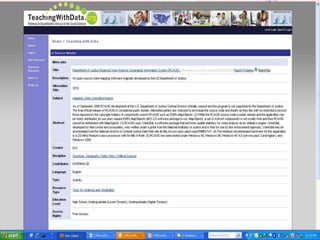
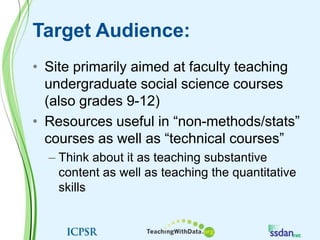
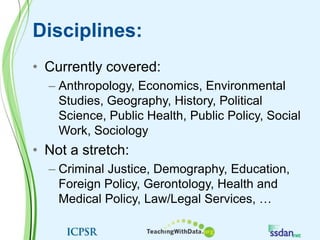
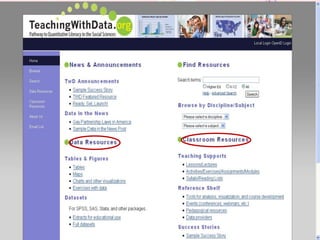
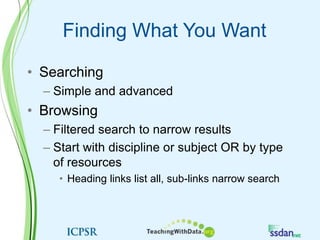
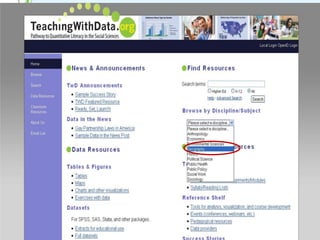
TeachingWithData.org: Example Presentation for Faculty/Grad StudentsOR Assessment Team WorkshopMay 25-26, 2010
Presentation Outline:Introducing the project partnersIntroducing TeachingWithData.orgGeneral overviewHow/When to use TwDFinding what you want, wanting what you findFuture directions
Project PartnersICPSR SSDANOthers involvedAmerican Economic Association Committee on Economic EducationAmerican Political Science AssociationAmerican Sociological AssociationAssociation of American GeographersScience Education Resource Center, Carleton College
Inter-university Consortium for Political & Social Research (ICPSR)World’s oldest and largest social science data archiveBegan in 1962 as ICPRMembership organization with 700+ members worldwide (non-members can use many resources)Summer Program in Quantitative Methods of Social Research
Current “Picture” of ICPSRCurrently 7,800 studies (64,800 data sets)Grouped into Thematic CollectionsAvailable in multiple formatsFederal funding allows parts of the collection to be openly availableData sources:GovernmentLarge data collection effortsPrincipal InvestigatorsRepurposingOther organizations
Undergraduate EducationFairly recent attentionResponse to facultyUndergrad users are fastest growing segmentNSF-funded projectsTeachingWithData.org (NSDL)Course, Curriculum, & Laboratory Improvement project to assess the effect of using digital materials on students’ quantitative literacy skills
SSDAN: Social Science Data Analysis NetworkStarted in 1995University-based organization that creates demographic media and makes U.S. census data accessible to policymakers, educators, the media, and informed citizens. Web sitesuser guides hands-on classroom computer materials
SSDANDataCounts! (www.ssdan.net/datacounts)Collection of  approximately 85 Data Driven Learning Modules (DDLMs)Datasets (repackaged decennial census and American Community Survey)Target is lower undergraduate coursesCensusScope (www.censusscope.org)Maps, charts, and tables Demographic data at local, region, and national levelsKey indicators and trends back to 1960 for some variables Kids Count in the Classroom (www.ssdan.net/kidscount)Course modules and exercisesData resources and tools (tables, charts, maps)
SSDAN: CensusScopeCharts, Trends, and TablesAll available for states, counties, and metropolitan areas
TeachingWithData.orgNational Science Digital Library – Social Science PathwayGoal: Make it easier for faculty to use real data in classesUndergraduate (esp. “non-methods”)K(9)-12 effortsIncludes survey of ~3200 social science faculty
TwD.org (con’t)Repository of data-related materialsExercises, including games and simulationsStatic and dynamic maps, charts, tablesData PublicationsTagged with metadata for easy searching
Engaging Students Through DataPiques student interestSupporting Quantitative LiteracyRoughly 30% of 2-year college students and 20% of 4-year college students show below basic or basic quantitative literacy skills:These students could not, for example, estimate if their cars had enough gas to get to a gas station.  (The Literacy of America’s College Students, American Institutes for Research, January 2006)Engages students with disciplines more fully Better picture of how social scientists workPrevents some of the feelings of “disconnect” between substantive and technical coursesOpens the door to the world of data13
When & How to Use TeachingWithData.orgShort answer: ANY time! and often!Long answer: Looking forBackground reading on pedagogical issues relating to quantitative literacy and using data in the classroomBackground information for teaching conceptsIdeas for creating own course exercises“Ready to go” exercisesDatasets related to particular topicsTypically instructors will search TwD first and point students directly to resources, but students can also go directly to the siteEspecially useful for graduate students beginning to think about teaching
Target Audience:Site primarily aimed at faculty teaching undergraduate social science courses (also grades 9-12)Resources useful in “non-methods/stats” courses as well as “technical courses”Think about it as teaching substantive content as well as teaching the quantitative skills
Disciplines:Currently covered:Anthropology, Economics, Environmental Studies, Geography, History, Political Science, Public Health, Public Policy, Social Work, SociologyNot a stretch: Criminal Justice, Demography, Education, Foreign Policy, Gerontology, Health and Medical Policy, Law/Legal Services, …
Finding What You Want	SearchingSimple and advancedBrowsingFiltered search to narrow resultsStart with discipline or subject OR by type of resourcesHeading links list all, sub-links narrow search
Data Resources:Tables & FiguresTablesMapsCharts and other visualizationsExercises with dataDatasetsFor SPSS, SAS, Stata, and other packages.Extracts for educational useFull datasets
Classroom ResourcesTeaching SupportsLessons/LecturesActivities/Exercises/Assignments/ModulesSyllabi/Reading ListsReference ShelfTools for analysis, visualization, and course developmentEvents (conferences, webinars, etc.)Pedagogical resourcesData providersSuccess Stories
Faculty Submission (coming soon)Submission formSome elements allow for multiple valuesControlled vocabularies assist search
TwD Next Phases:Include resources for high school teachersAbility to link data to analysis and/or visualization toolsMechanism for faculty to rate and comment on resourcesPeer-reviewed materials and capability for faculty to upload their own resourcesCommunity building through professional associations and networks of users
For More Information:(Your info goes here!)Lynette HoelterInstructional Resources & Developmentlhoelter@umich.edu

TeachingWithData.org -- Faculty Presentation

  • 1.
    TeachingWithData.org: Example Presentationfor Faculty/Grad StudentsOR Assessment Team WorkshopMay 25-26, 2010
  • 2.
    Presentation Outline:Introducing theproject partnersIntroducing TeachingWithData.orgGeneral overviewHow/When to use TwDFinding what you want, wanting what you findFuture directions
  • 3.
    Project PartnersICPSR SSDANOthersinvolvedAmerican Economic Association Committee on Economic EducationAmerican Political Science AssociationAmerican Sociological AssociationAssociation of American GeographersScience Education Resource Center, Carleton College
  • 4.
    Inter-university Consortium forPolitical & Social Research (ICPSR)World’s oldest and largest social science data archiveBegan in 1962 as ICPRMembership organization with 700+ members worldwide (non-members can use many resources)Summer Program in Quantitative Methods of Social Research
  • 5.
    Current “Picture” ofICPSRCurrently 7,800 studies (64,800 data sets)Grouped into Thematic CollectionsAvailable in multiple formatsFederal funding allows parts of the collection to be openly availableData sources:GovernmentLarge data collection effortsPrincipal InvestigatorsRepurposingOther organizations
  • 6.
    Undergraduate EducationFairly recentattentionResponse to facultyUndergrad users are fastest growing segmentNSF-funded projectsTeachingWithData.org (NSDL)Course, Curriculum, & Laboratory Improvement project to assess the effect of using digital materials on students’ quantitative literacy skills
  • 7.
    SSDAN: Social ScienceData Analysis NetworkStarted in 1995University-based organization that creates demographic media and makes U.S. census data accessible to policymakers, educators, the media, and informed citizens. Web sitesuser guides hands-on classroom computer materials
  • 8.
    SSDANDataCounts! (www.ssdan.net/datacounts)Collection of approximately 85 Data Driven Learning Modules (DDLMs)Datasets (repackaged decennial census and American Community Survey)Target is lower undergraduate coursesCensusScope (www.censusscope.org)Maps, charts, and tables Demographic data at local, region, and national levelsKey indicators and trends back to 1960 for some variables Kids Count in the Classroom (www.ssdan.net/kidscount)Course modules and exercisesData resources and tools (tables, charts, maps)
  • 10.
    SSDAN: CensusScopeCharts, Trends,and TablesAll available for states, counties, and metropolitan areas
  • 11.
    TeachingWithData.orgNational Science DigitalLibrary – Social Science PathwayGoal: Make it easier for faculty to use real data in classesUndergraduate (esp. “non-methods”)K(9)-12 effortsIncludes survey of ~3200 social science faculty
  • 12.
    TwD.org (con’t)Repository ofdata-related materialsExercises, including games and simulationsStatic and dynamic maps, charts, tablesData PublicationsTagged with metadata for easy searching
  • 13.
    Engaging Students ThroughDataPiques student interestSupporting Quantitative LiteracyRoughly 30% of 2-year college students and 20% of 4-year college students show below basic or basic quantitative literacy skills:These students could not, for example, estimate if their cars had enough gas to get to a gas station. (The Literacy of America’s College Students, American Institutes for Research, January 2006)Engages students with disciplines more fully Better picture of how social scientists workPrevents some of the feelings of “disconnect” between substantive and technical coursesOpens the door to the world of data13
  • 14.
    When & Howto Use TeachingWithData.orgShort answer: ANY time! and often!Long answer: Looking forBackground reading on pedagogical issues relating to quantitative literacy and using data in the classroomBackground information for teaching conceptsIdeas for creating own course exercises“Ready to go” exercisesDatasets related to particular topicsTypically instructors will search TwD first and point students directly to resources, but students can also go directly to the siteEspecially useful for graduate students beginning to think about teaching
  • 15.
    Target Audience:Site primarilyaimed at faculty teaching undergraduate social science courses (also grades 9-12)Resources useful in “non-methods/stats” courses as well as “technical courses”Think about it as teaching substantive content as well as teaching the quantitative skills
  • 16.
    Disciplines:Currently covered:Anthropology, Economics,Environmental Studies, Geography, History, Political Science, Public Health, Public Policy, Social Work, SociologyNot a stretch: Criminal Justice, Demography, Education, Foreign Policy, Gerontology, Health and Medical Policy, Law/Legal Services, …
  • 18.
    Finding What YouWant SearchingSimple and advancedBrowsingFiltered search to narrow resultsStart with discipline or subject OR by type of resourcesHeading links list all, sub-links narrow search
  • 24.
    Data Resources:Tables &FiguresTablesMapsCharts and other visualizationsExercises with dataDatasetsFor SPSS, SAS, Stata, and other packages.Extracts for educational useFull datasets
  • 25.
    Classroom ResourcesTeaching SupportsLessons/LecturesActivities/Exercises/Assignments/ModulesSyllabi/ReadingListsReference ShelfTools for analysis, visualization, and course developmentEvents (conferences, webinars, etc.)Pedagogical resourcesData providersSuccess Stories
  • 26.
    Faculty Submission (comingsoon)Submission formSome elements allow for multiple valuesControlled vocabularies assist search
  • 27.
    TwD Next Phases:Includeresources for high school teachersAbility to link data to analysis and/or visualization toolsMechanism for faculty to rate and comment on resourcesPeer-reviewed materials and capability for faculty to upload their own resourcesCommunity building through professional associations and networks of users
  • 28.
    For More Information:(Yourinfo goes here!)Lynette HoelterInstructional Resources & Developmentlhoelter@umich.edu

Editor's Notes

  • #6 Links to tools for updating ICPSR overview are found on the OR pages. We also try to keep a fairly recent version of the “Intro to ICPSR” presentation on both the ICPSR site and Slideshare.net – those presentations contain updated figures for numbers of members, studies, datasets, etc. and also often the most popularly downloaded datasets.
  • #19 Take audience through Website to demo search (and/or allow them to look themselves)