The students conducted experiments to analyze various properties of water, including:
1) Having students taste tap water and bottled water in a blind taste test, finding most students rated bottled water higher.
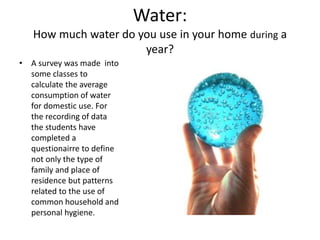
2) Surveying families to measure home water usage, finding an average of 195 liters per day and most were able to reduce usage with conservation tips.
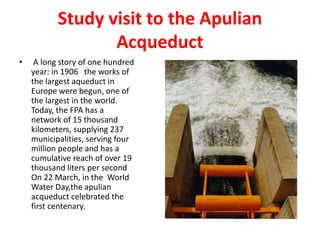
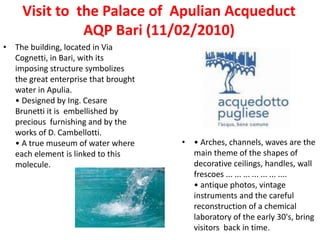
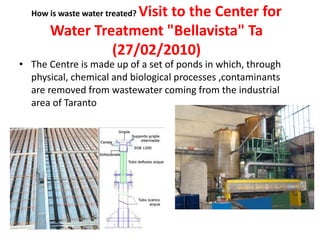
3) Learning about the local water treatment and distribution system to ensure safe, clean drinking water through filtration, disinfection, and quality testing.


![Chapter 1. introduction[1]](https://cdn.slidesharecdn.com/ss_thumbnails/chapter1-171220222030-thumbnail.jpg?width=640&height=640&fit=bounds)


