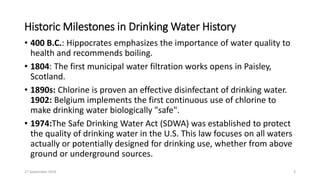
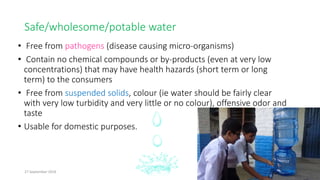
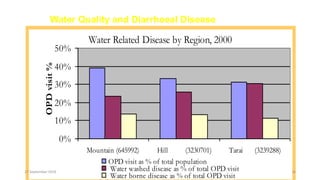
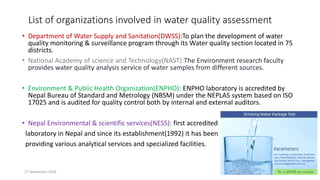
Concept of Water quality
& its Guidelines
Presented by
Govinda Rokka
27 September 2016 1
Background
-Water is an essential nutrient for all forms of life which maintains fluid &
electrolyte homeostasis.
-Access to safe drinking water is a basic right of human.
-(MDG 7) on drinking-water was met globally in 2010.[except by 48 least
developed countries] Source:WHO-drinking water
Key facts
-Human beings need about (2.5-3) lpd for survival.
-Water makes about 60% of human body.
-In 2015, 91% of the worldโ€™s population had access to an improved
drinking-water source, compared with 76% in 1990.
-1 in 9 people world wide do not have access to safe and clean drinking
water.
-Nearly 1 out of every 5 deaths under the age of 5 worldwide is due to a
water-related disease. Source:https://thewaterproject.org/water_stats
WHO-Water Fact Sheet
2
Historic Milestones in Drinking Water History
โ€ข 400 B.C.: Hippocrates emphasizes the importance of water quality to
health and recommends boiling.
โ€ข 1804: The first municipal water filtration works opens in Paisley,
Scotland.
โ€ข 1890s: Chlorine is proven an effective disinfectant of drinking water.
1902: Belgium implements the first continuous use of chlorine to
make drinking water biologically "safe".
โ€ข 1974:The Safe Drinking Water Act (SDWA) was established to protect
the quality of drinking water in the U.S. This law focuses on all waters
actually or potentially designed for drinking use, whether from above
ground or underground sources.
27 September 2016 3
History of Water Supply in Nepal
4
โ€ข While going back to history, the populations of Kathmandu Valley was not high. People
in used to take water from the available natural sources near their homes. However,
because of rapid population growth the existing water resources were not enough to
feed the people and thus, government realized to provide drinking water for the people
in the Kathmandu valley and thus established a systematic development of water supply
system with the name PANI ADDA (PANI GOSWARA) unit in 2029 BS.
Sources of water in Nepal
โ€ข Rain water- Purest form of water. Obtained from roof catchments & stored in tanks.
โ€ข Surface water- Nepal is very rich in surface water consisting of thousands of
rivers,streams,ponds & lakes.
โ€ข Ground Water- Found abundant in the aquifers of Terai & Kathmandu. But found limited
in the populated hill regions(like Kathmandu) because of the lower permeability of the
indurated and crystalline rocks. Eg.wells,springs,spout
27 September 2016
Safe/wholesome/potable water
โ€ข Free from pathogens (disease causing micro-organisms)
โ€ข Contain no chemical compounds or by-products (even at very low
concentrations) that may have health hazards (short term or long
term) to the consumers
โ€ข Free from suspended solids, colour (ie water should be fairly clear
with very low turbidity and very little or no colour), offensive odor and
taste
โ€ข Usable for domestic purposes.
27 September 2016 5
Status
Daily Demand of Water-350 million litres
Daily supply of Water- 130 million litres
(fluctuates according to the season)
27 September 2016 6
In this situation,
Can we be assure of water quality???
27 September 2016 7
The study shows that the water sources in the Kathmandu valley are badly contaminated
with E.coli & Coliform bacteria.
Location of River PH TDS(mg/dl) DO(mg/l) BOD(mg/l)
Mahakali at Pancheswor (FWDR) 8.8 110 5 2
Karnali at chisapani (FWDR) 8.9 264 10.5 1.5
Bheri at Chatagaon (MWDR) 7.8 208 9.3 1.1
Seti at Ramghat(WDR) 8.2 222 9.3 2
East Rapti at sauraha (CDR) 7.8 213 8.7 2.5
Arun(EDR) 6.5 200 9.1 2.1
Kankai(EDR) 7.7 60 8.7 2
Mechi (EDR) 8.3 30 8.9 1.8
WHO Guideline 6.5-8.5 100 >5.0 3
Water Quality of Rivers during dry season ,1998
Source:Department of Hydrology and Meterology,1998(CBS:A Compendium on Environment
Statistics Nepal,1998
27 September 2016 8
Arsenic Map of Nepal, WHO 1999
A person suffering from arsenicosis
Guideline value
WHO-10 ppb
Nepal-50 ppb
27 September 2016 9
More than 90% people consume water from ground water in the
Tarai Region .
Drinking Water Guideline by WHO
Parameter Max
Concentration
Turbidity,PH,color,TDS,electrical
conductivity,TDS
-
Al 0.2 mg/l
NH3 1.5 mg/l
Cl 250 mg/l
Zn 3 mg/l
Mn 0.5 mg/l
E-coli, Coliform bacteria,virues -
Ar 0.01 mg/l
Cr 0.05 mg/l
Pb 0.01 mg/l
F 1.5 mg/l
Cyanide 0.07 mg/l
NO3 50 mg/l
Cd 0.03 mg/l
Gross ฮฑ activity 0.1 Bq/l
Gross ฮฒ activity 1.0 Bq/l
27 September 2016 10
Group Parameter Unit Maximum Concentration Limits
Physical and
chemicals
Turbidity
pH
Color
Taste & Odor
Total Dissolved Solids
Electrical Conductivity
Iron
Manganese
Arsenic
Cadmium
Chromium
Cyanide
Fluoride
Lead
Ammonia
Chloride
Sulphate
Nitrate
Copper
Total Hardness
Calcium
Zinc
Mercury
Aluminum
Residual Chlorine
NTU
TCU
mg/l
ยตc/cm
mg/l
mg/l
mg/l
mg/l
mg/l
mg/l
mg/l
mg/l
mg/l
mg/l
mg/l
mg/l
mg/l
mg/l
mg/l
mg/l
mg/l
mg/l
mg/l
5 (10)**
6.5-8.5*
5 (15)**
Would not be objectionable
1000
1500
0.3 (3)**
0.2
0.05
0.003
0.05
0.07
0.5-1.5*
0.01
1.5
250
250
50
1
500
200
3
0.001
0.2
0.1-0.2*
Micro Germs
E-Coli
Total Coli form
MPN/100ml
MPN/100ml
0
95 % in sample
Note : * These standards indicate the maximum and minimum limits.
** Figures in parenthesis are upper range of the standards recommended.
Sources:
-Environment Statistics of Nepal 2008, Government of Nepal, National Planning Commission Secretariat, Central Bureau of
Statistics, Kathmandu, Nepal
National Drinking Water Quality Standard
27 September 2016 11
27 September 2016 12
Status of Bagmati river at different time intervals
15 years ago
5 years ago
After Bagmati cleanup campaign
Human Health & Water quality
In developing countries, as much as 80% of illnesses are linked to poor water and
sanitation conditions.
In Nepal, an estimated 15000 children die each year due to diarroheal diseases, caused by
poor environmental sanitation and lack of access to quality water supply.(UNICEF)
Quality
water
Proper
sanitation
Wellness
Poor
Quality
water
Poor
sanitation
Nevertheless, water quality alone is not enough to ensure the benefits of human
health.Three additional requisites must be met: quantity, continuity and
reasonable cost.
Illness
27 September 2016 13
Water Quality and Diarrhoeal Disease
Water Related Disease by Region, 2000
0%
10%
20%
30%
40%
50%
Mountain (645992) Hill (3230701) Tarai (3239288)
OPDvisit%
OPD visit as % of total population
Water washed disease as % of total OPD visit
Water borne disease as % of total OPD visit
27 September 2016 14
Reasons for water quality Degradation
โ€ข Haphazard disposal of wastes near the source of water.
โ€ข Discharge of industrial effluents near the water resource.
โ€ข Encroachment of water sides .
โ€ข Watershed degradation and water induced disasters.
โ€ข Increase in use of chemicals for agricultural purpose.
โ€ข Presence of leakage and rusting of water pipes.
โ€ข Presence of sewage pipe nearer to drinking water pipe.
27 September 2016 15
Solutions
โ€ข Enforcing compliance of the laws and their effective implementation.
โ€ข Proper settlement planning and industrialization.
โ€ข Law enforcement to protect the land from encroachment & effective
implementation of building codes.
โ€ข Integrated watershed protection & water induced disaster forecasting
system.
โ€ข Cleaning campaign for the existing rivers should be run frequently.
โ€ข Putting Sewage pipes as far as possible from the drinking water pipes &
checking the status of water pipes regularly.
โ€ข Educating people about water quality and its effects on human health.
27 September 2016 16
List of organizations involved in water quality assessment
โ€ข Department of Water Supply and Sanitation(DWSS):To plan the development of water
quality monitoring & surveillance program through its Water quality section located in 75
districts.
โ€ข National Academy of science and Technology(NAST):The Environment research faculty
provides water quality analysis service of water samples from different sources.
โ€ข Environment & Public Health Organization(ENPHO): ENPHO laboratory is accredited by
Nepal Bureau of Standard and Metrology (NBSM) under the NEPLAS system based on ISO
17025 and is audited for quality control both by internal and external auditors.
โ€ข Nepal Environmental & scientific services(NESS): first accredited
laboratory in Nepal and since its establishment(1992) it has been
providing various analytical services and specialized facilities.
27 September 2016 17
References
1. WHO-drinking water ,Progress on sanitation and drinking-water
Fast facts
2.State of Alaska-drinking water history
3. Guidelines for drinking water quality,WHO Geneva 2010;4th edth.
4.Environmental Statistics of Nepal, 2008
5.WaterAid-Water quality standard and testing policy,2011
6.Water In Crisis-spotlightNepal
27 September 2016 18
27 September 2016 19

Water quality & its guidelines

  • 1.
    Concept of Waterquality & its Guidelines Presented by Govinda Rokka 27 September 2016 1
  • 2.
    Background -Water is anessential nutrient for all forms of life which maintains fluid & electrolyte homeostasis. -Access to safe drinking water is a basic right of human. -(MDG 7) on drinking-water was met globally in 2010.[except by 48 least developed countries] Source:WHO-drinking water Key facts -Human beings need about (2.5-3) lpd for survival. -Water makes about 60% of human body. -In 2015, 91% of the worldโ€™s population had access to an improved drinking-water source, compared with 76% in 1990. -1 in 9 people world wide do not have access to safe and clean drinking water. -Nearly 1 out of every 5 deaths under the age of 5 worldwide is due to a water-related disease. Source:https://thewaterproject.org/water_stats WHO-Water Fact Sheet 2
  • 3.
    Historic Milestones inDrinking Water History โ€ข 400 B.C.: Hippocrates emphasizes the importance of water quality to health and recommends boiling. โ€ข 1804: The first municipal water filtration works opens in Paisley, Scotland. โ€ข 1890s: Chlorine is proven an effective disinfectant of drinking water. 1902: Belgium implements the first continuous use of chlorine to make drinking water biologically "safe". โ€ข 1974:The Safe Drinking Water Act (SDWA) was established to protect the quality of drinking water in the U.S. This law focuses on all waters actually or potentially designed for drinking use, whether from above ground or underground sources. 27 September 2016 3
  • 4.
    History of WaterSupply in Nepal 4 โ€ข While going back to history, the populations of Kathmandu Valley was not high. People in used to take water from the available natural sources near their homes. However, because of rapid population growth the existing water resources were not enough to feed the people and thus, government realized to provide drinking water for the people in the Kathmandu valley and thus established a systematic development of water supply system with the name PANI ADDA (PANI GOSWARA) unit in 2029 BS. Sources of water in Nepal โ€ข Rain water- Purest form of water. Obtained from roof catchments & stored in tanks. โ€ข Surface water- Nepal is very rich in surface water consisting of thousands of rivers,streams,ponds & lakes. โ€ข Ground Water- Found abundant in the aquifers of Terai & Kathmandu. But found limited in the populated hill regions(like Kathmandu) because of the lower permeability of the indurated and crystalline rocks. Eg.wells,springs,spout 27 September 2016
  • 5.
    Safe/wholesome/potable water โ€ข Freefrom pathogens (disease causing micro-organisms) โ€ข Contain no chemical compounds or by-products (even at very low concentrations) that may have health hazards (short term or long term) to the consumers โ€ข Free from suspended solids, colour (ie water should be fairly clear with very low turbidity and very little or no colour), offensive odor and taste โ€ข Usable for domestic purposes. 27 September 2016 5
  • 6.
    Status Daily Demand ofWater-350 million litres Daily supply of Water- 130 million litres (fluctuates according to the season) 27 September 2016 6 In this situation, Can we be assure of water quality???
  • 7.
    27 September 20167 The study shows that the water sources in the Kathmandu valley are badly contaminated with E.coli & Coliform bacteria.
  • 8.
    Location of RiverPH TDS(mg/dl) DO(mg/l) BOD(mg/l) Mahakali at Pancheswor (FWDR) 8.8 110 5 2 Karnali at chisapani (FWDR) 8.9 264 10.5 1.5 Bheri at Chatagaon (MWDR) 7.8 208 9.3 1.1 Seti at Ramghat(WDR) 8.2 222 9.3 2 East Rapti at sauraha (CDR) 7.8 213 8.7 2.5 Arun(EDR) 6.5 200 9.1 2.1 Kankai(EDR) 7.7 60 8.7 2 Mechi (EDR) 8.3 30 8.9 1.8 WHO Guideline 6.5-8.5 100 >5.0 3 Water Quality of Rivers during dry season ,1998 Source:Department of Hydrology and Meterology,1998(CBS:A Compendium on Environment Statistics Nepal,1998 27 September 2016 8
  • 9.
    Arsenic Map ofNepal, WHO 1999 A person suffering from arsenicosis Guideline value WHO-10 ppb Nepal-50 ppb 27 September 2016 9 More than 90% people consume water from ground water in the Tarai Region .
  • 10.
    Drinking Water Guidelineby WHO Parameter Max Concentration Turbidity,PH,color,TDS,electrical conductivity,TDS - Al 0.2 mg/l NH3 1.5 mg/l Cl 250 mg/l Zn 3 mg/l Mn 0.5 mg/l E-coli, Coliform bacteria,virues - Ar 0.01 mg/l Cr 0.05 mg/l Pb 0.01 mg/l F 1.5 mg/l Cyanide 0.07 mg/l NO3 50 mg/l Cd 0.03 mg/l Gross ฮฑ activity 0.1 Bq/l Gross ฮฒ activity 1.0 Bq/l 27 September 2016 10
  • 11.
    Group Parameter UnitMaximum Concentration Limits Physical and chemicals Turbidity pH Color Taste & Odor Total Dissolved Solids Electrical Conductivity Iron Manganese Arsenic Cadmium Chromium Cyanide Fluoride Lead Ammonia Chloride Sulphate Nitrate Copper Total Hardness Calcium Zinc Mercury Aluminum Residual Chlorine NTU TCU mg/l ยตc/cm mg/l mg/l mg/l mg/l mg/l mg/l mg/l mg/l mg/l mg/l mg/l mg/l mg/l mg/l mg/l mg/l mg/l mg/l mg/l 5 (10)** 6.5-8.5* 5 (15)** Would not be objectionable 1000 1500 0.3 (3)** 0.2 0.05 0.003 0.05 0.07 0.5-1.5* 0.01 1.5 250 250 50 1 500 200 3 0.001 0.2 0.1-0.2* Micro Germs E-Coli Total Coli form MPN/100ml MPN/100ml 0 95 % in sample Note : * These standards indicate the maximum and minimum limits. ** Figures in parenthesis are upper range of the standards recommended. Sources: -Environment Statistics of Nepal 2008, Government of Nepal, National Planning Commission Secretariat, Central Bureau of Statistics, Kathmandu, Nepal National Drinking Water Quality Standard 27 September 2016 11
  • 12.
    27 September 201612 Status of Bagmati river at different time intervals 15 years ago 5 years ago After Bagmati cleanup campaign
  • 13.
    Human Health &Water quality In developing countries, as much as 80% of illnesses are linked to poor water and sanitation conditions. In Nepal, an estimated 15000 children die each year due to diarroheal diseases, caused by poor environmental sanitation and lack of access to quality water supply.(UNICEF) Quality water Proper sanitation Wellness Poor Quality water Poor sanitation Nevertheless, water quality alone is not enough to ensure the benefits of human health.Three additional requisites must be met: quantity, continuity and reasonable cost. Illness 27 September 2016 13
  • 14.
    Water Quality andDiarrhoeal Disease Water Related Disease by Region, 2000 0% 10% 20% 30% 40% 50% Mountain (645992) Hill (3230701) Tarai (3239288) OPDvisit% OPD visit as % of total population Water washed disease as % of total OPD visit Water borne disease as % of total OPD visit 27 September 2016 14
  • 15.
    Reasons for waterquality Degradation โ€ข Haphazard disposal of wastes near the source of water. โ€ข Discharge of industrial effluents near the water resource. โ€ข Encroachment of water sides . โ€ข Watershed degradation and water induced disasters. โ€ข Increase in use of chemicals for agricultural purpose. โ€ข Presence of leakage and rusting of water pipes. โ€ข Presence of sewage pipe nearer to drinking water pipe. 27 September 2016 15
  • 16.
    Solutions โ€ข Enforcing complianceof the laws and their effective implementation. โ€ข Proper settlement planning and industrialization. โ€ข Law enforcement to protect the land from encroachment & effective implementation of building codes. โ€ข Integrated watershed protection & water induced disaster forecasting system. โ€ข Cleaning campaign for the existing rivers should be run frequently. โ€ข Putting Sewage pipes as far as possible from the drinking water pipes & checking the status of water pipes regularly. โ€ข Educating people about water quality and its effects on human health. 27 September 2016 16
  • 17.
    List of organizationsinvolved in water quality assessment โ€ข Department of Water Supply and Sanitation(DWSS):To plan the development of water quality monitoring & surveillance program through its Water quality section located in 75 districts. โ€ข National Academy of science and Technology(NAST):The Environment research faculty provides water quality analysis service of water samples from different sources. โ€ข Environment & Public Health Organization(ENPHO): ENPHO laboratory is accredited by Nepal Bureau of Standard and Metrology (NBSM) under the NEPLAS system based on ISO 17025 and is audited for quality control both by internal and external auditors. โ€ข Nepal Environmental & scientific services(NESS): first accredited laboratory in Nepal and since its establishment(1992) it has been providing various analytical services and specialized facilities. 27 September 2016 17
  • 18.
    References 1. WHO-drinking water,Progress on sanitation and drinking-water Fast facts 2.State of Alaska-drinking water history 3. Guidelines for drinking water quality,WHO Geneva 2010;4th edth. 4.Environmental Statistics of Nepal, 2008 5.WaterAid-Water quality standard and testing policy,2011 6.Water In Crisis-spotlightNepal 27 September 2016 18
  • 19.