Download to read offline


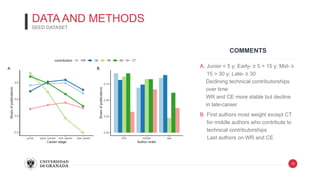


The document explores task specialization and diversity in research careers, investigating factors such as author contribution, gender differences, and career trajectories among scientists. It highlights the impact of research evaluation on diversity and assesses individual profiles based on predicted contributorships through a rigorous analysis of bibliometric data. The findings reveal notable differences in contributions and profiles across career stages and genders, suggesting implications for career prospects and task specialization in academia.


