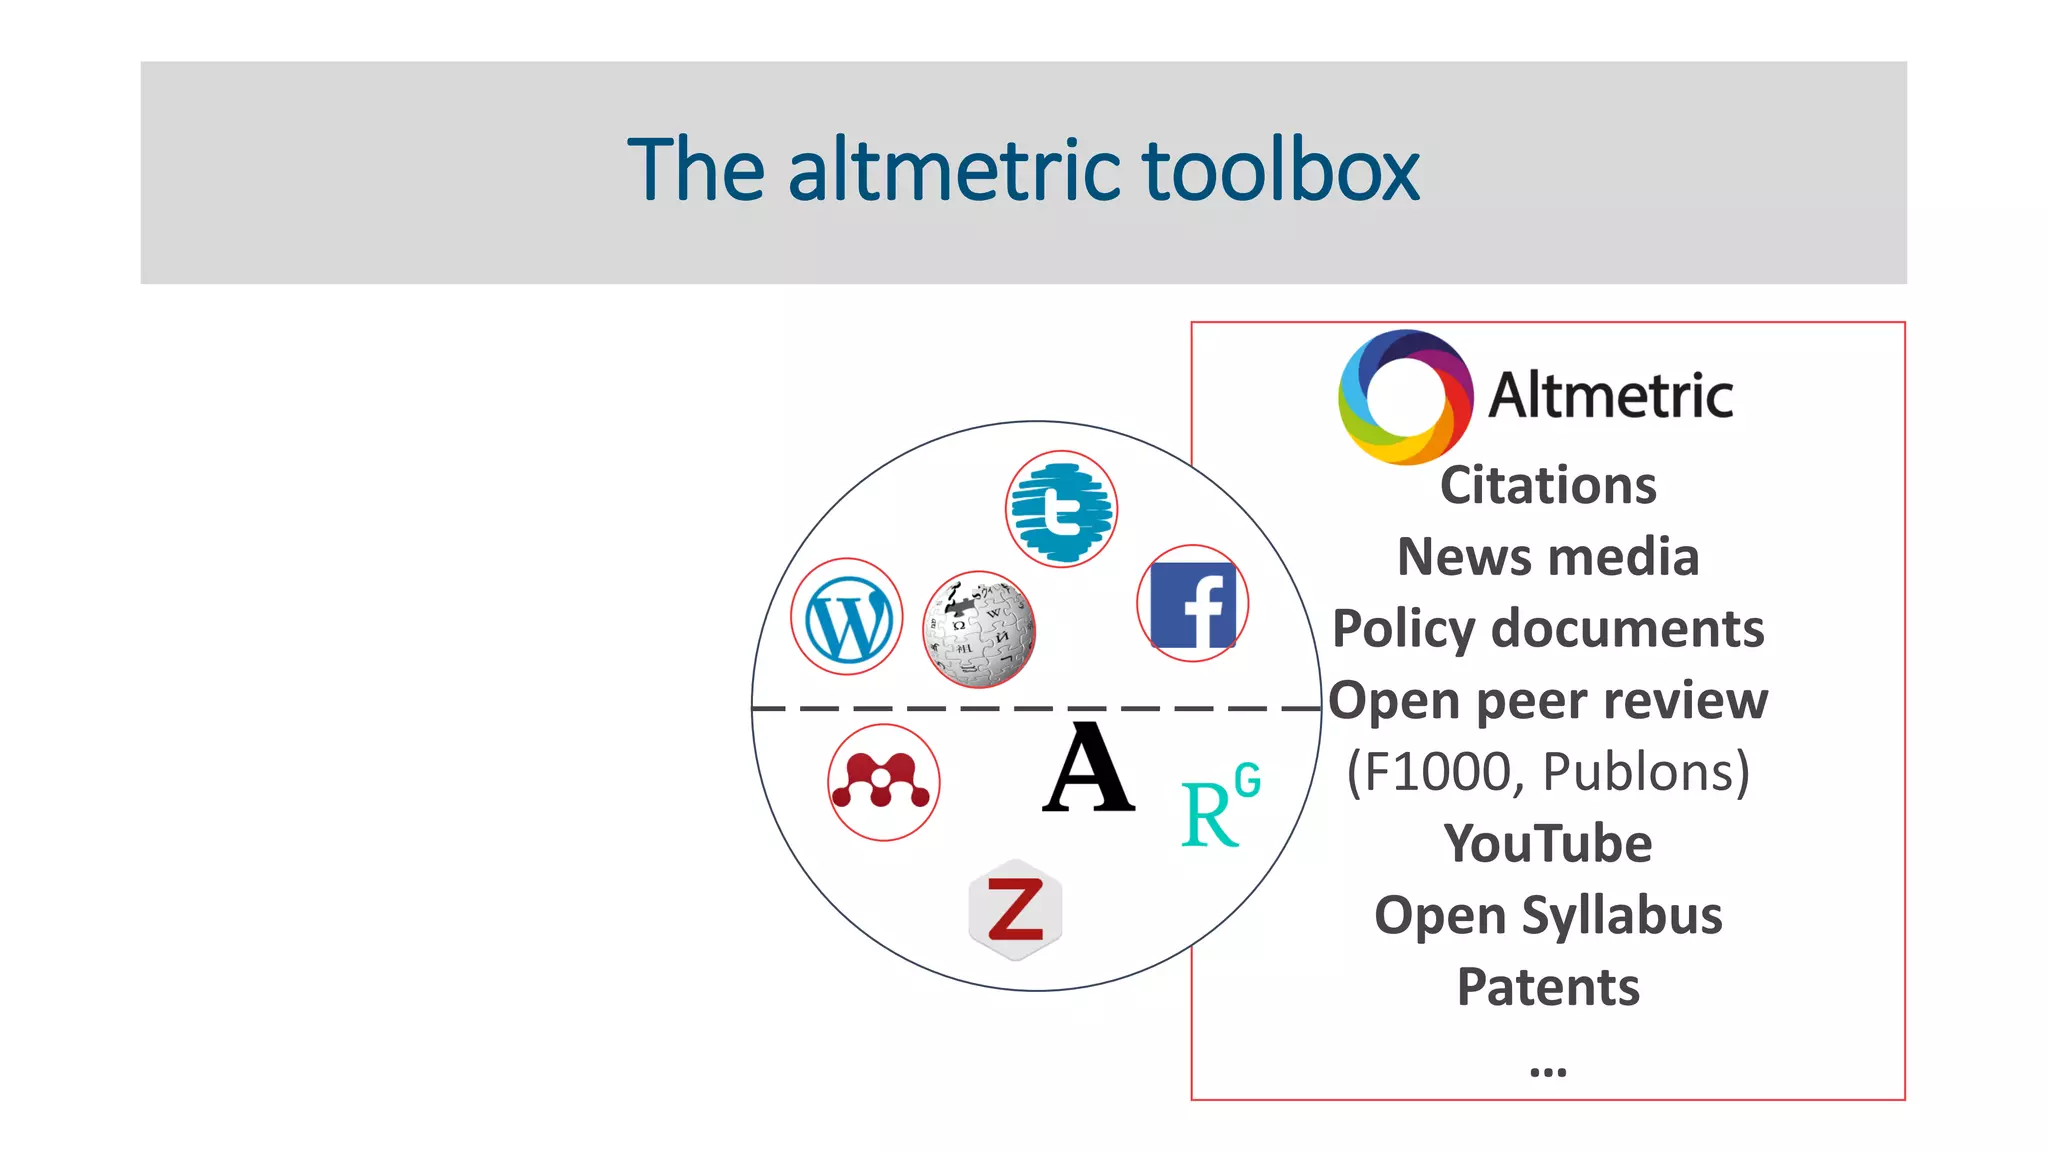
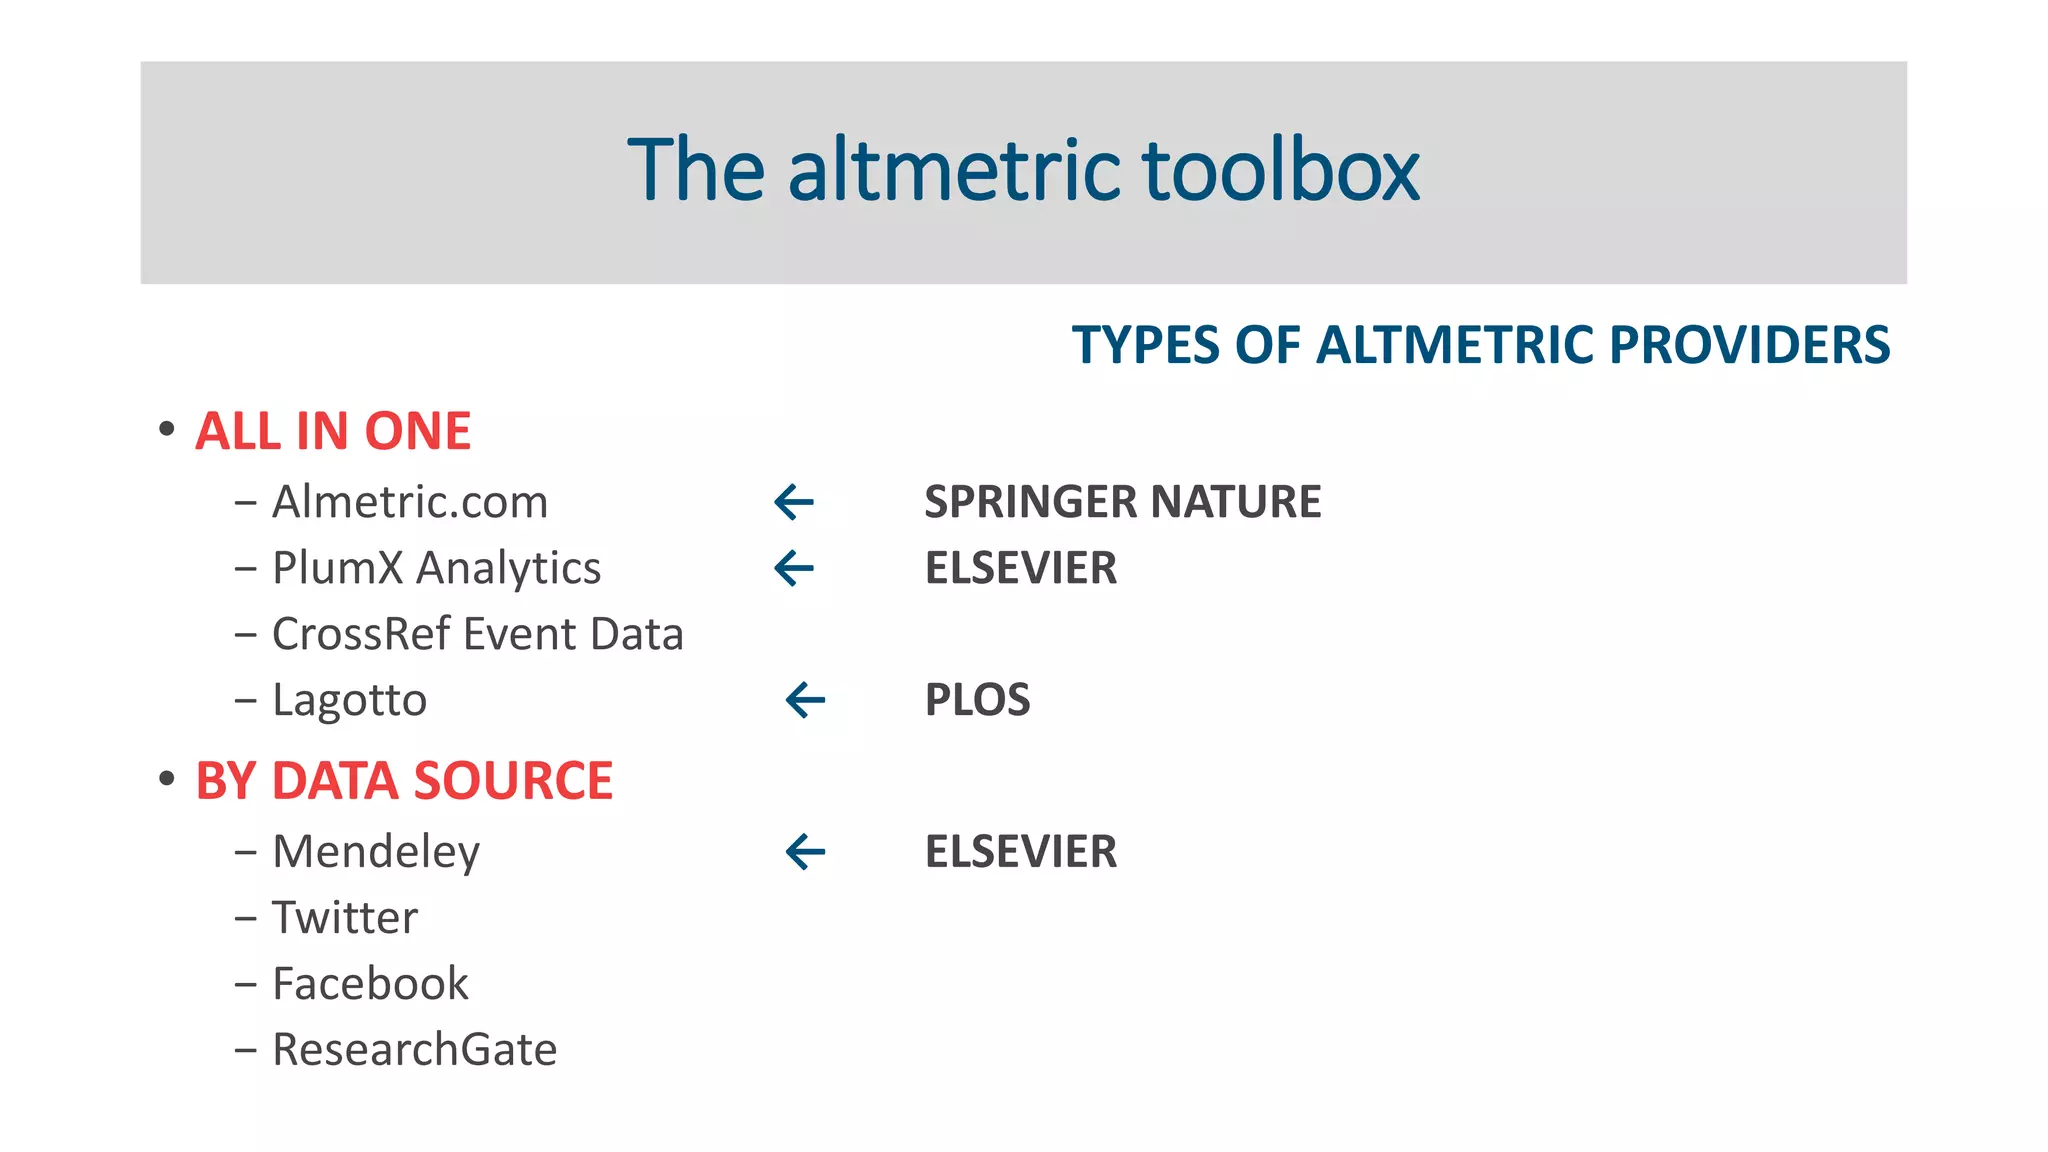
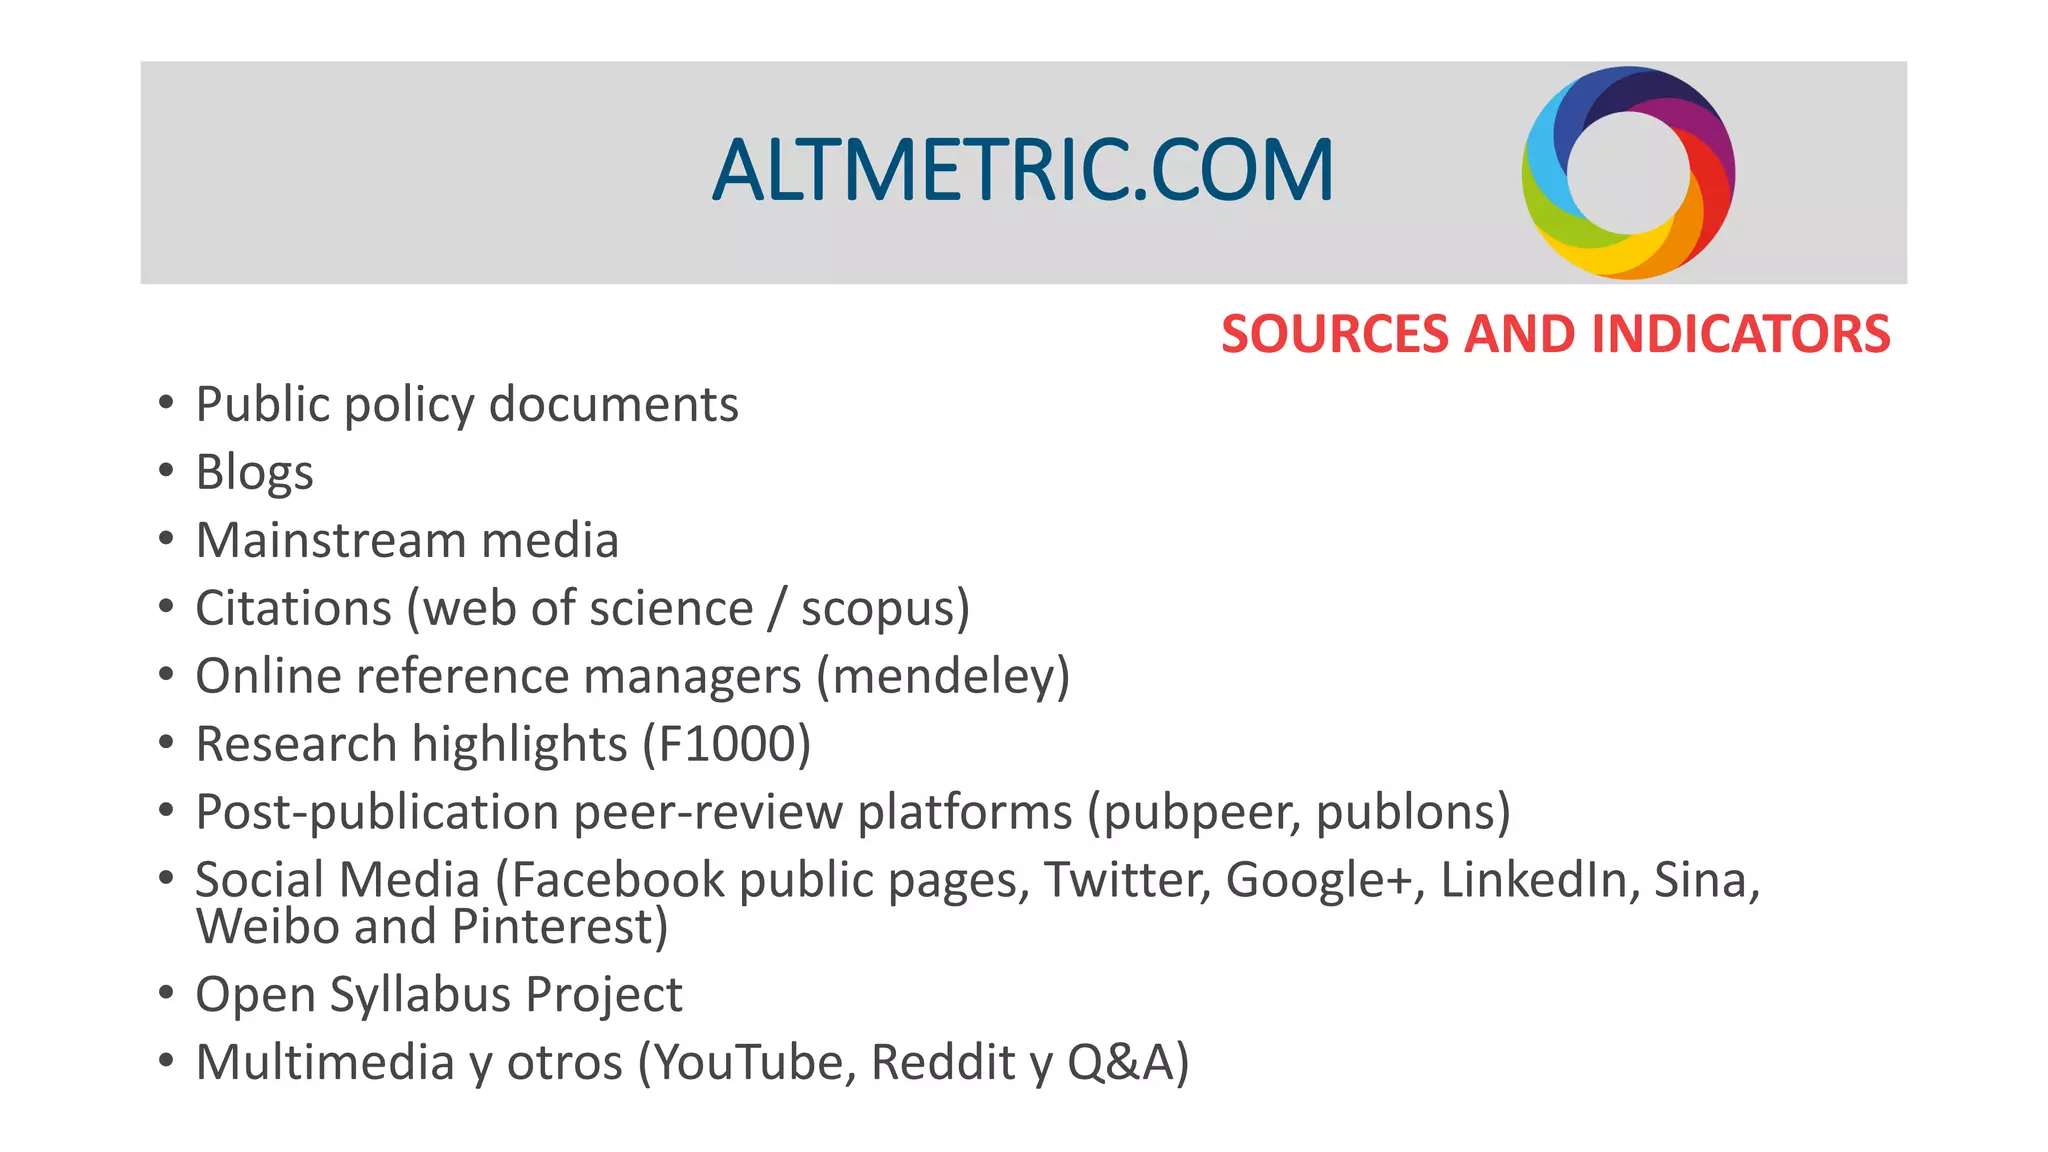
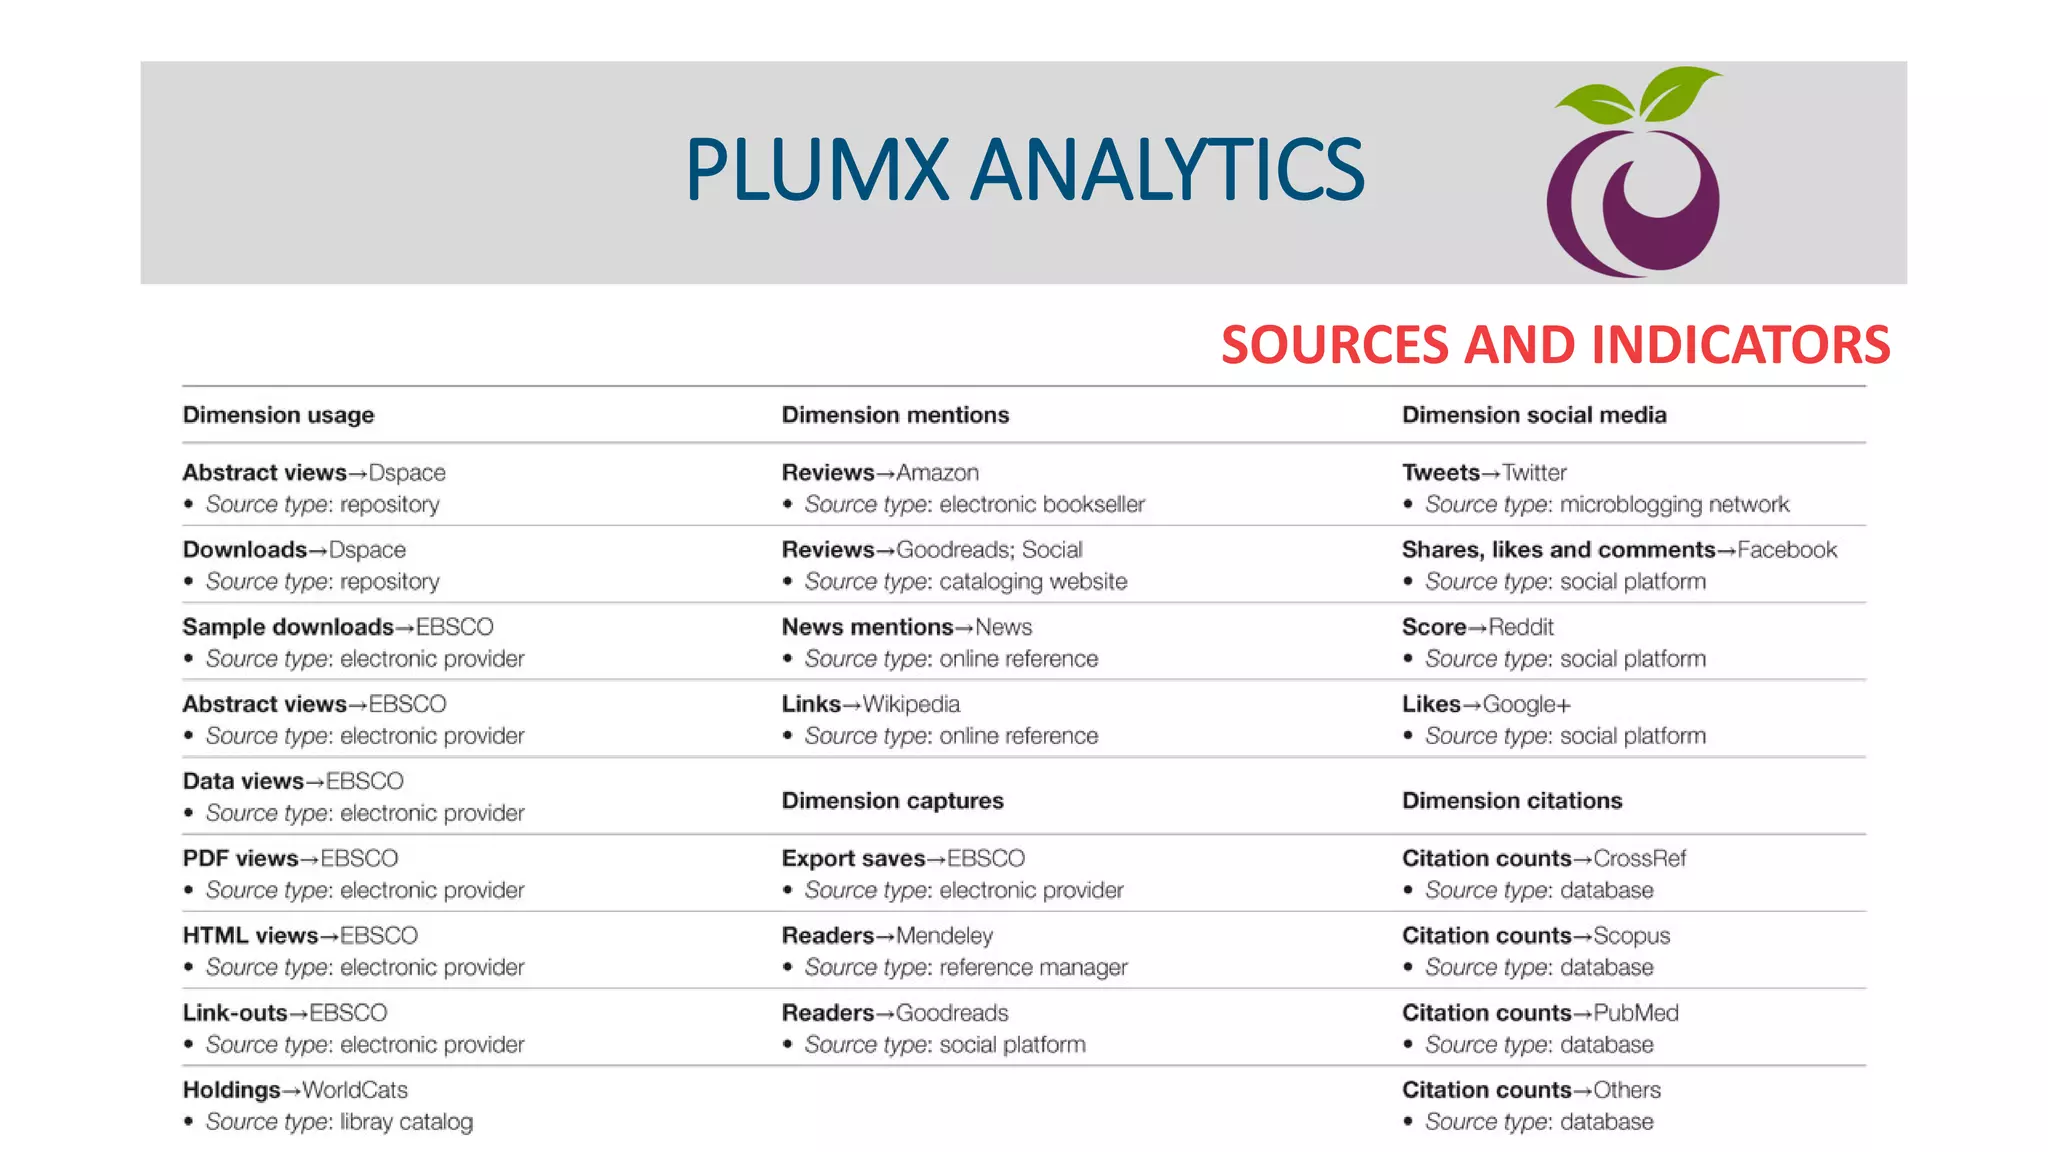
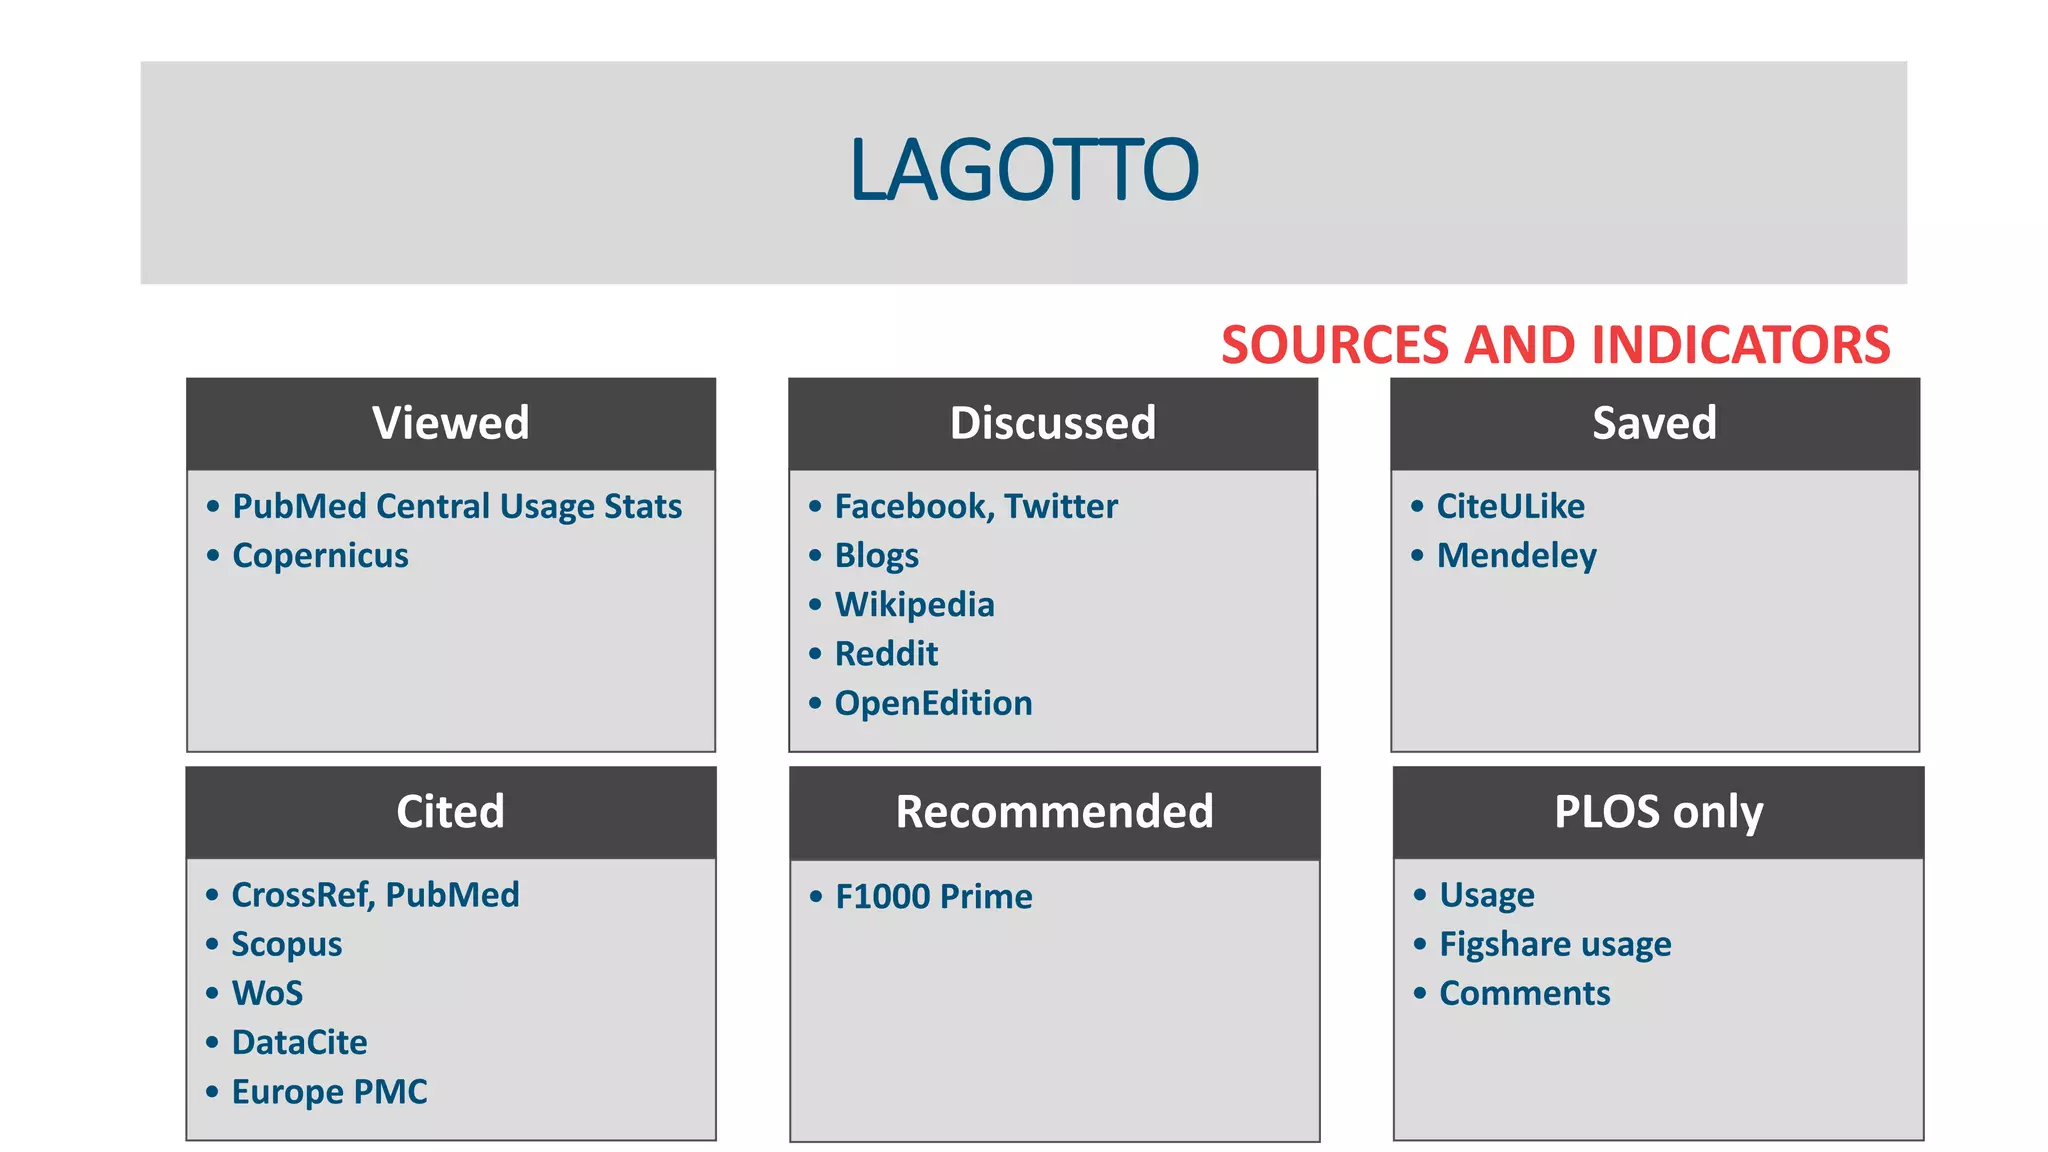
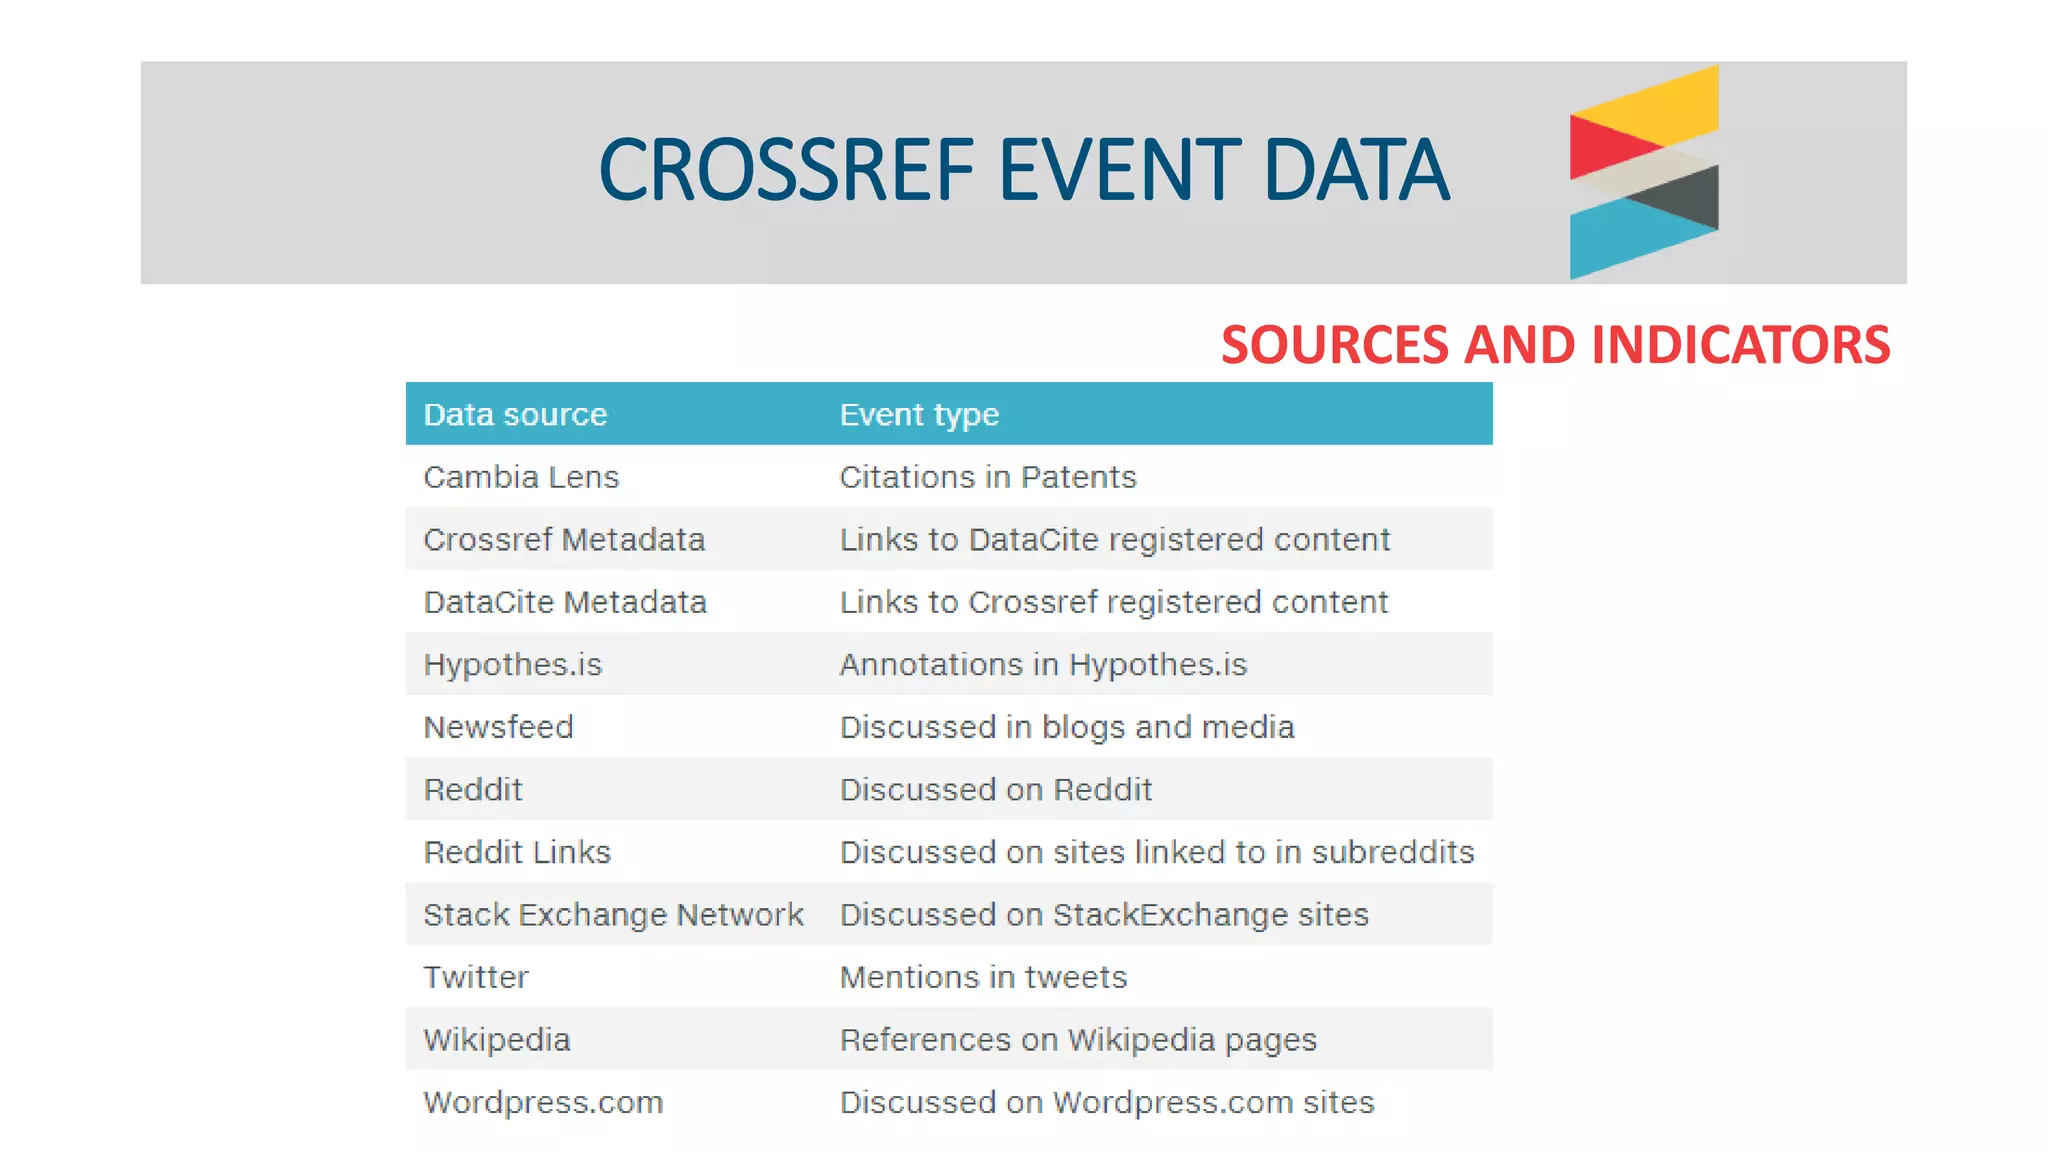
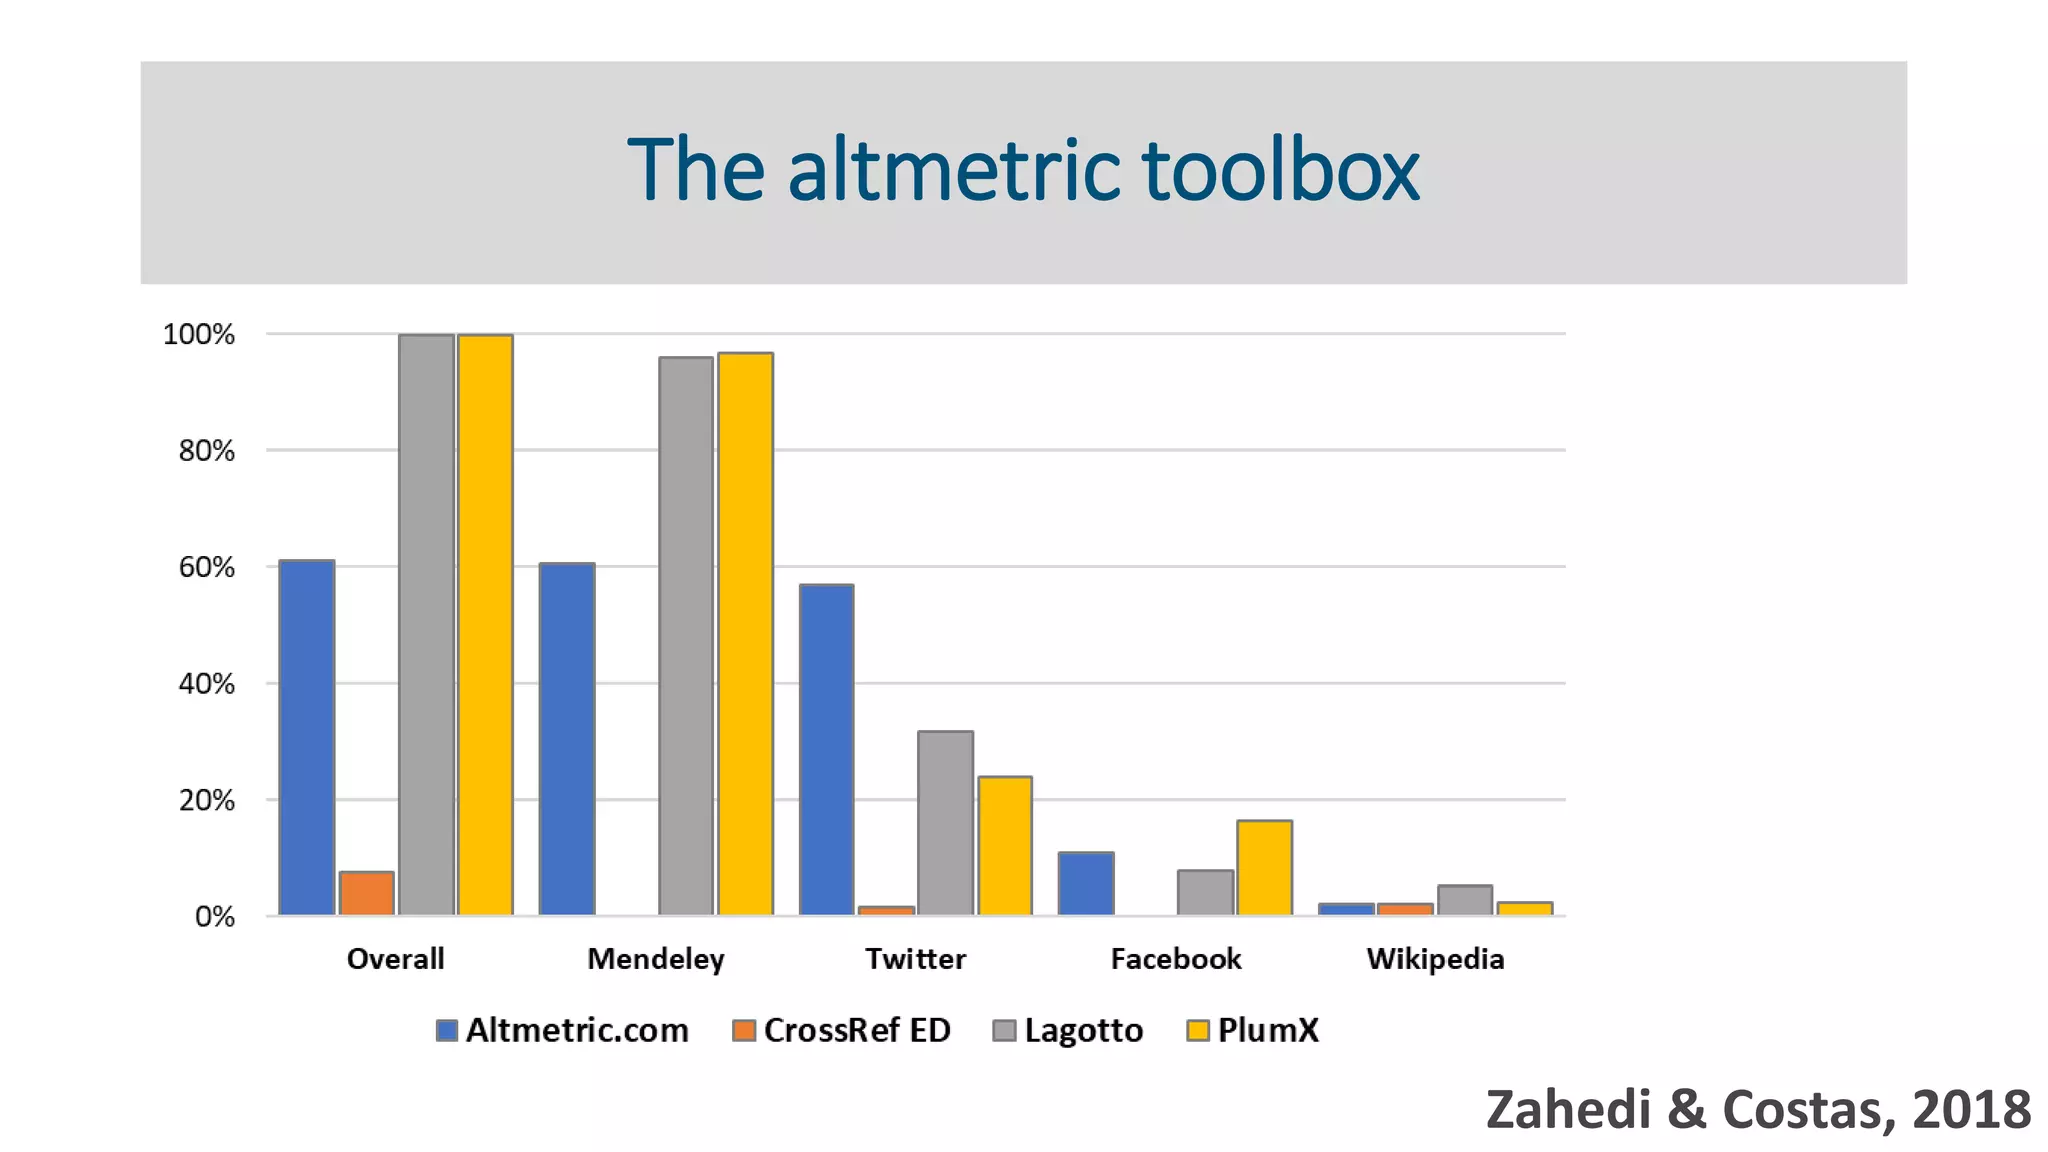
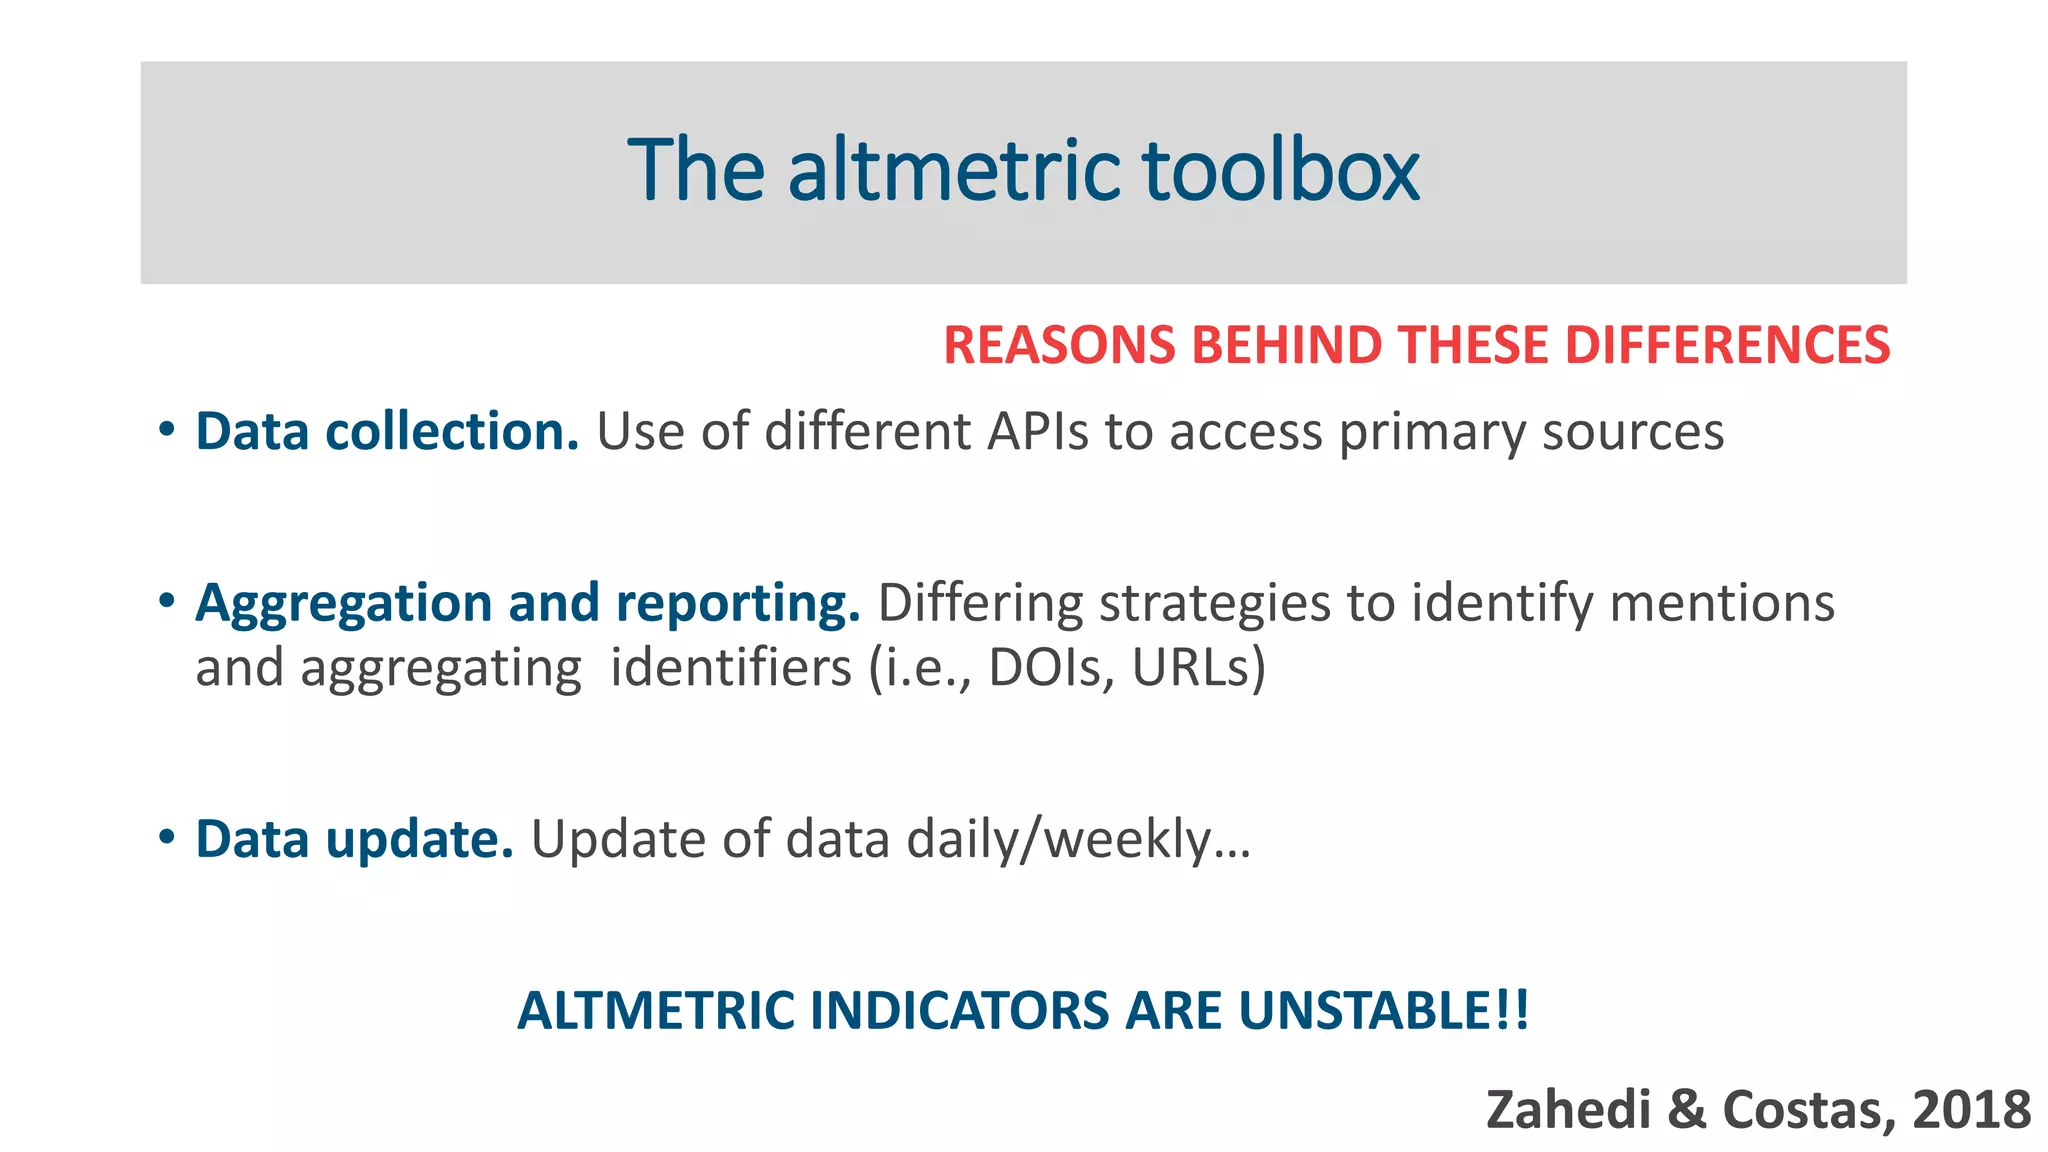
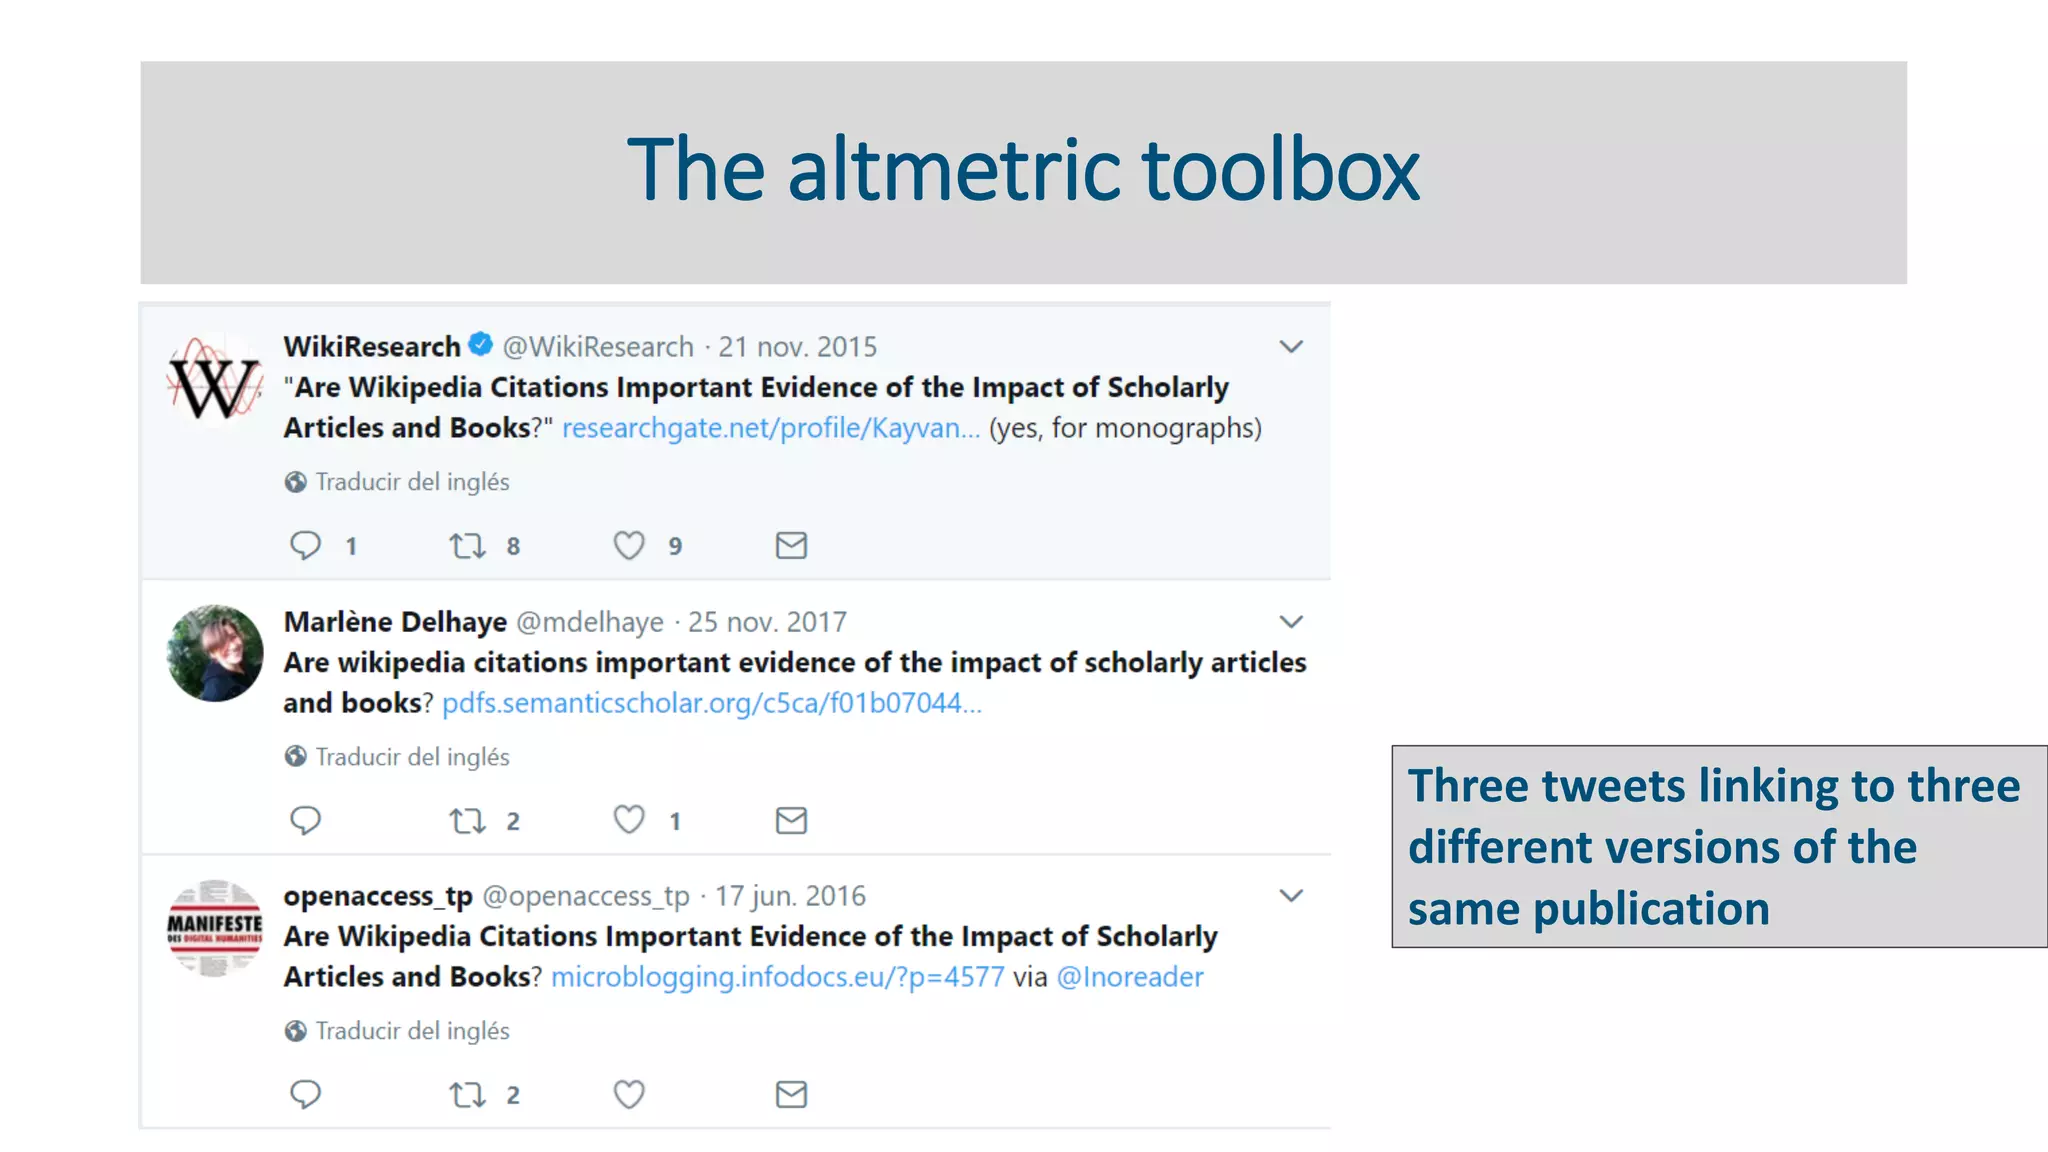
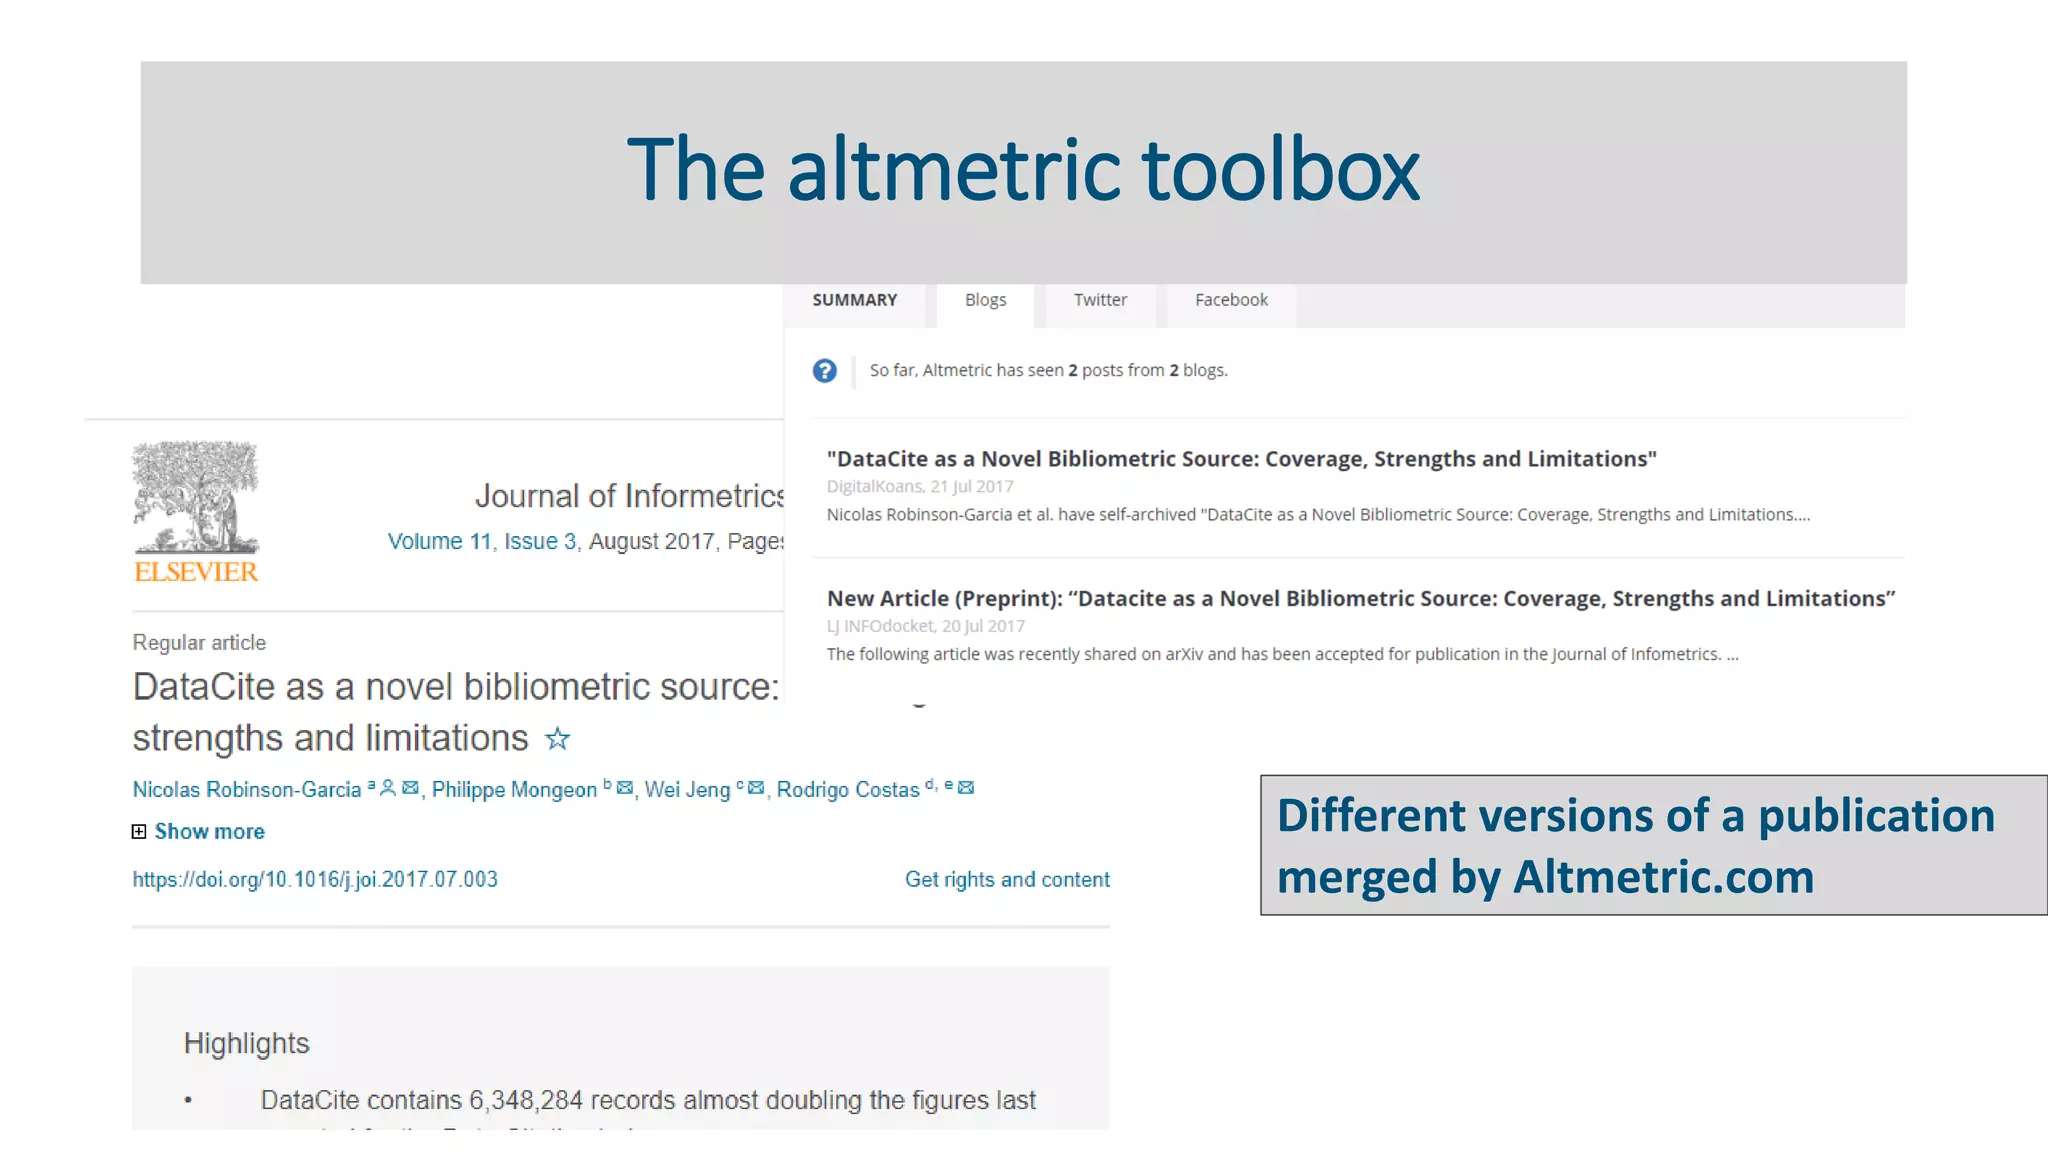
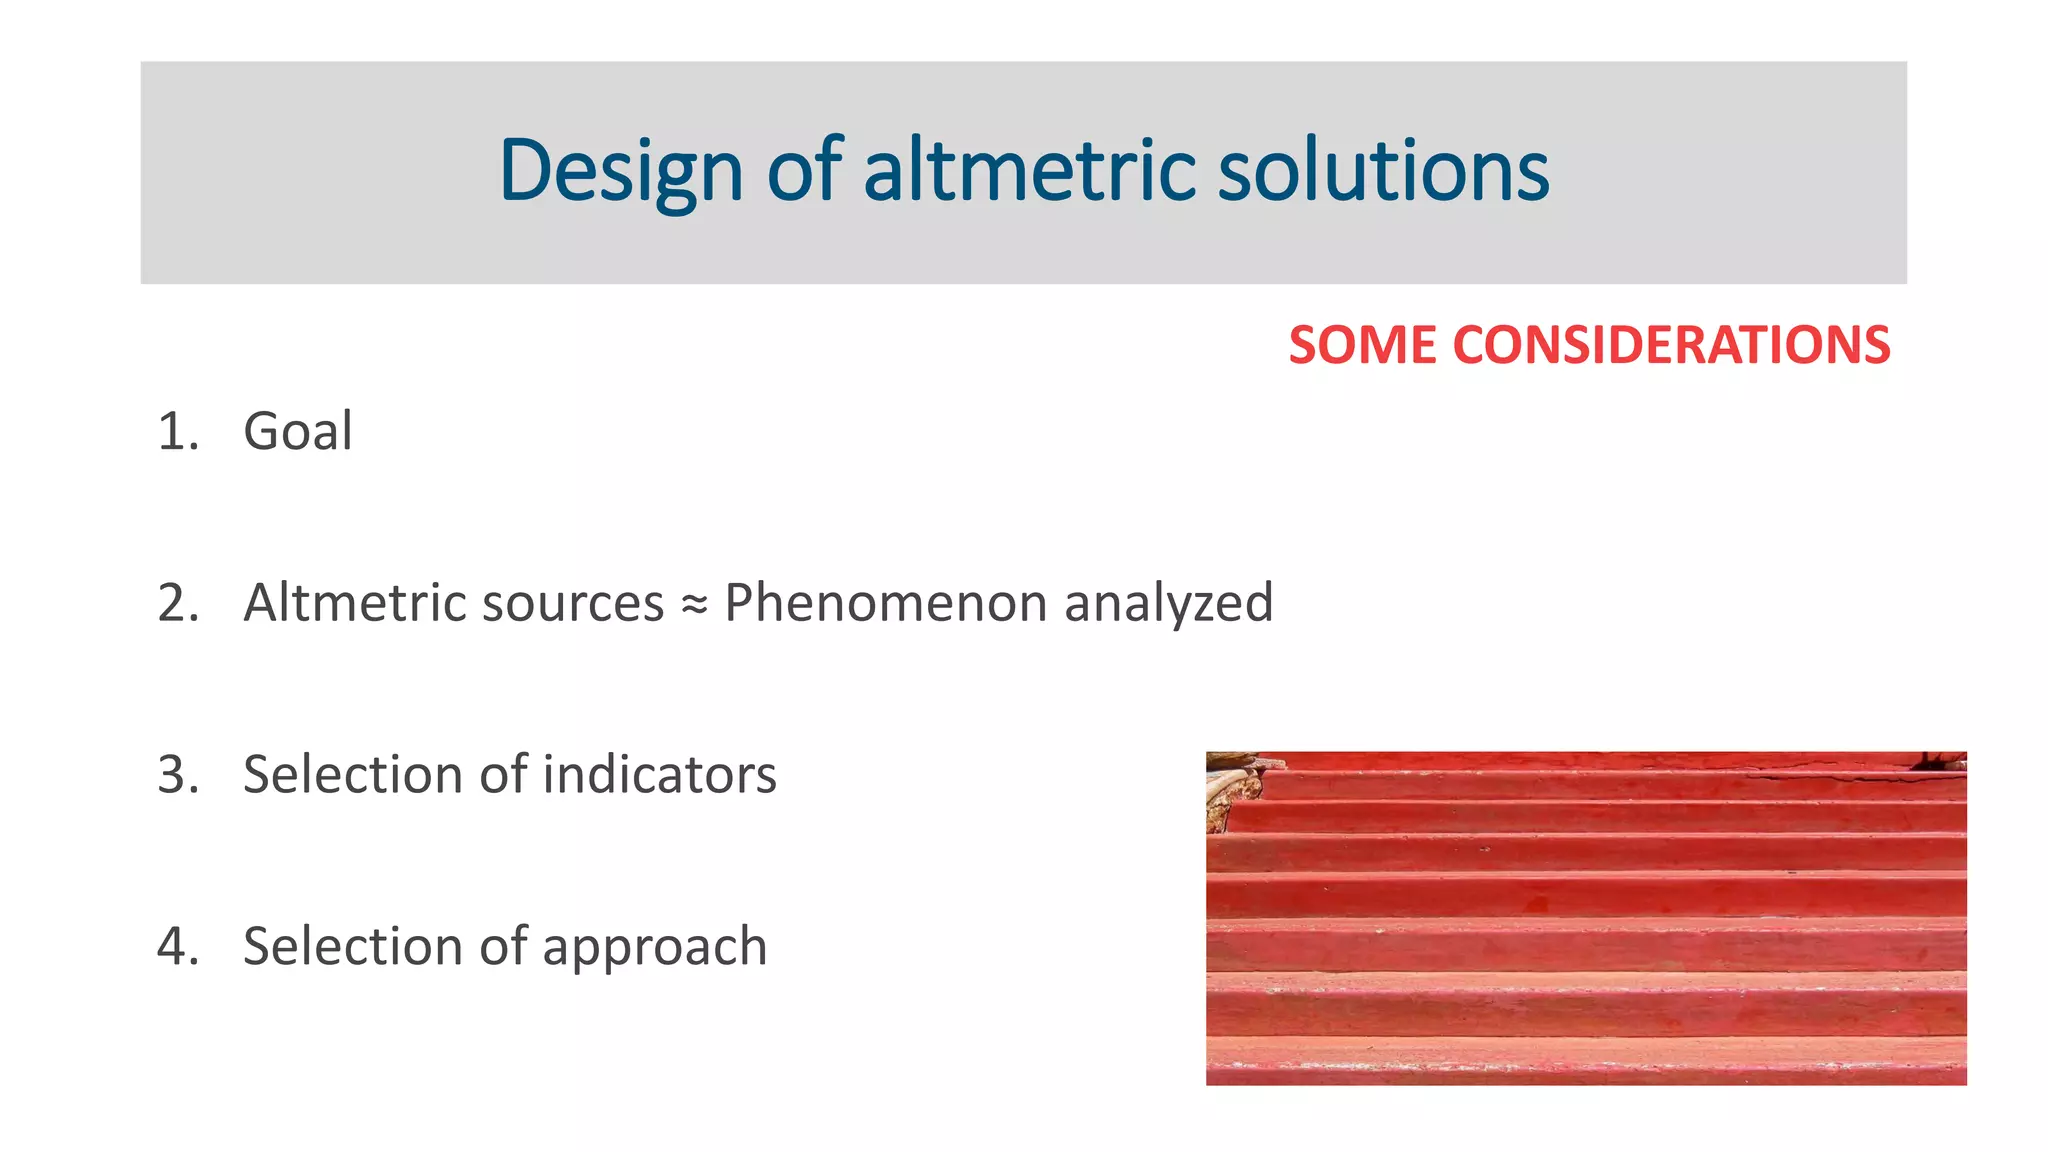
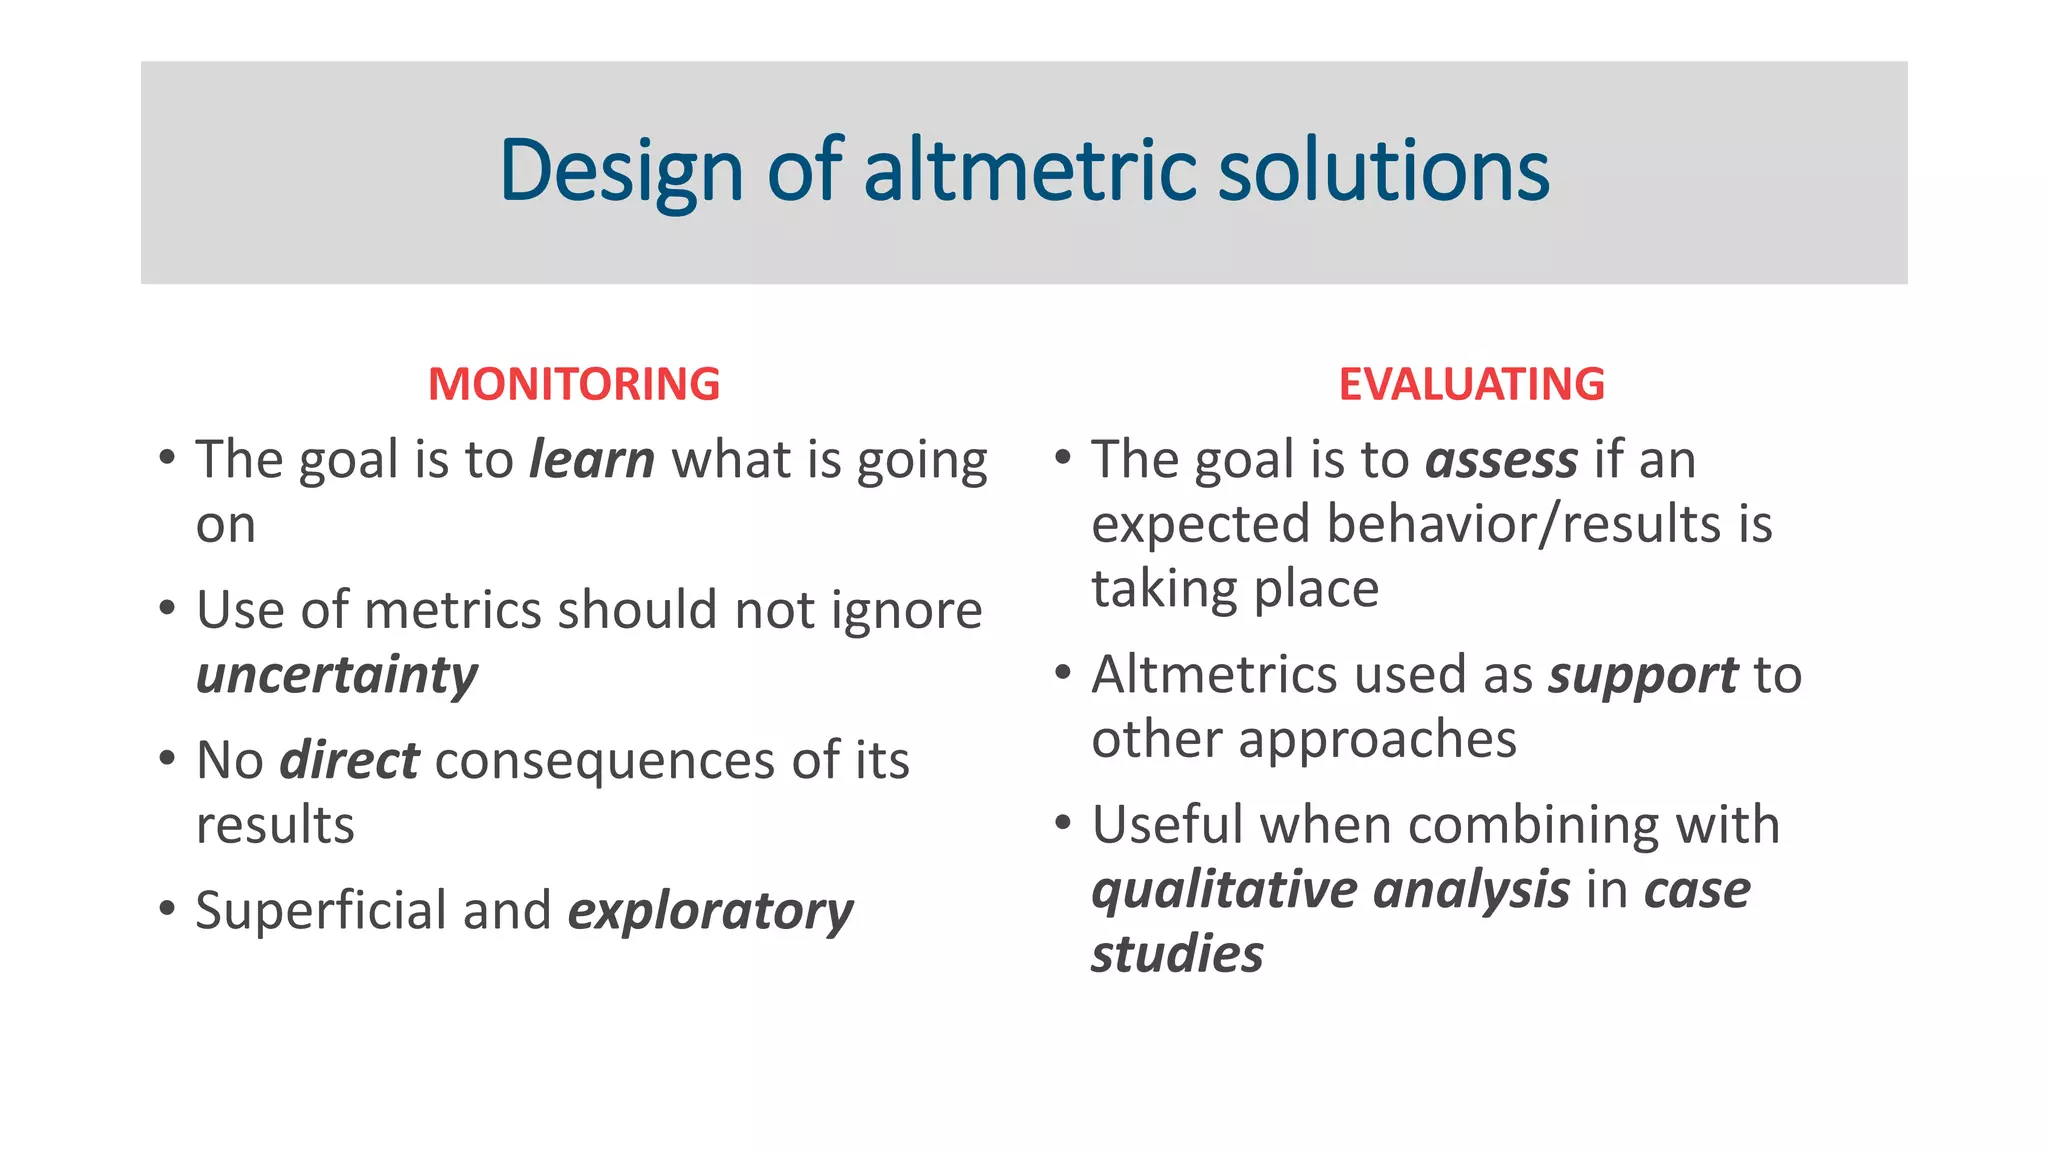
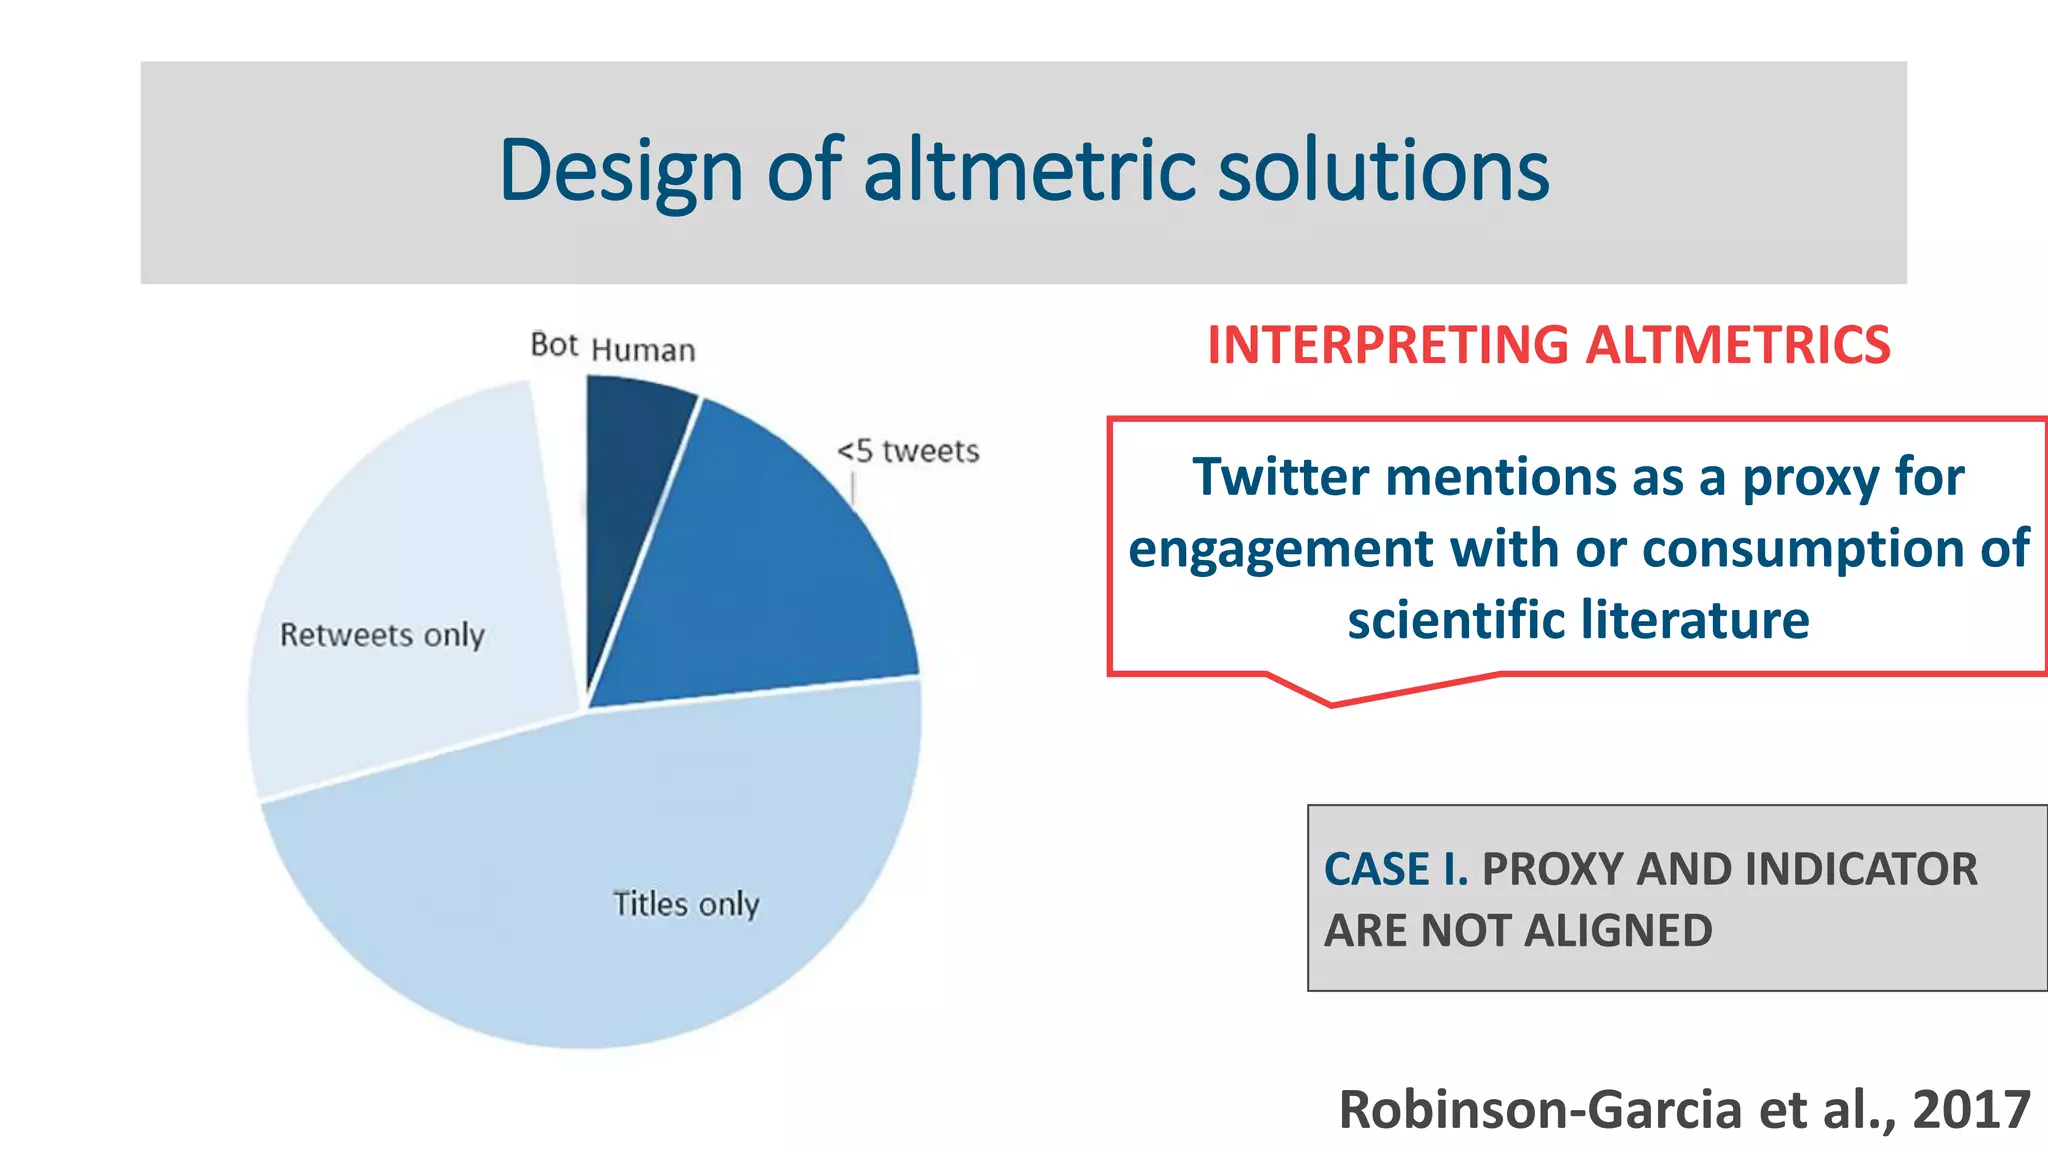
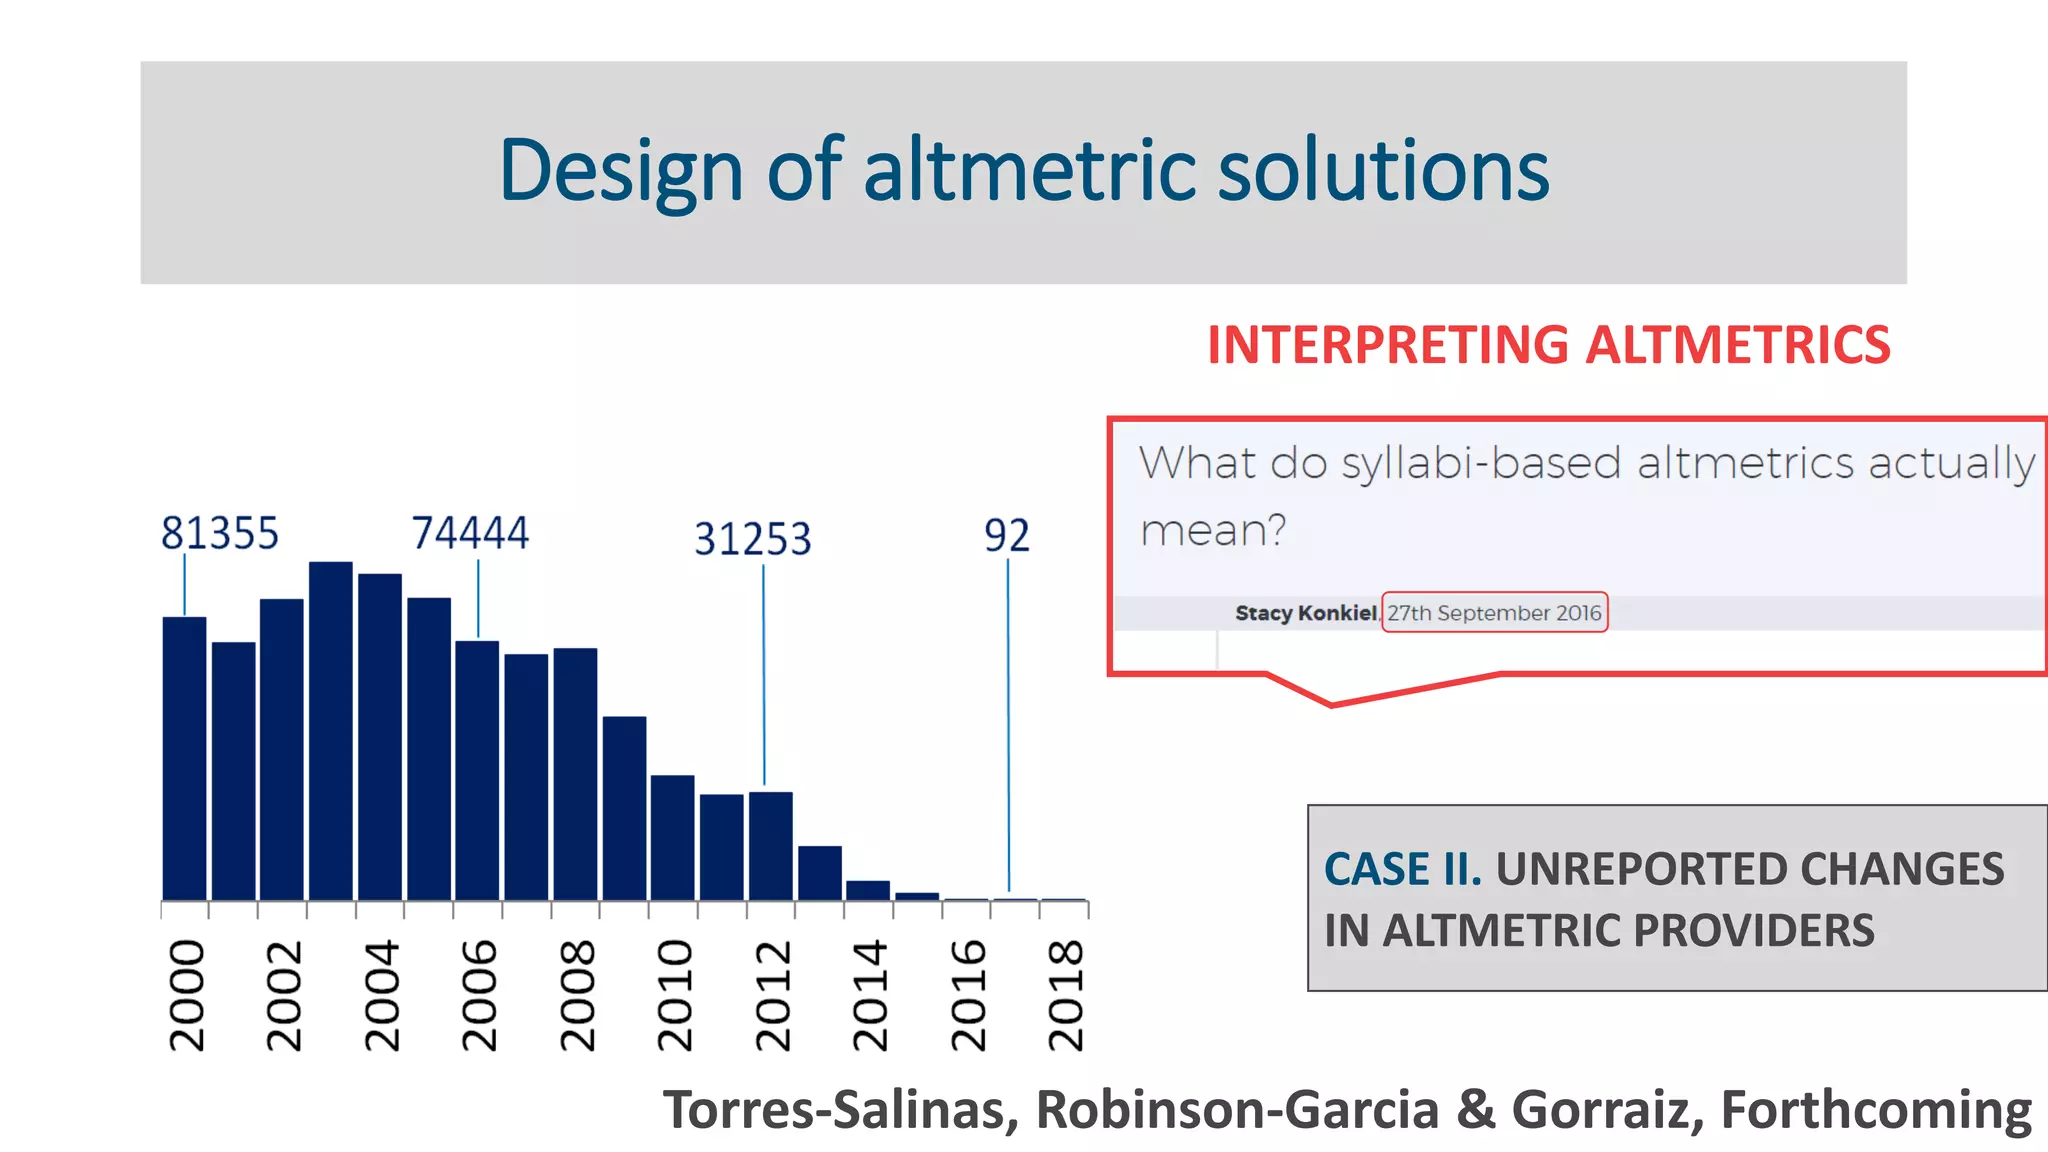
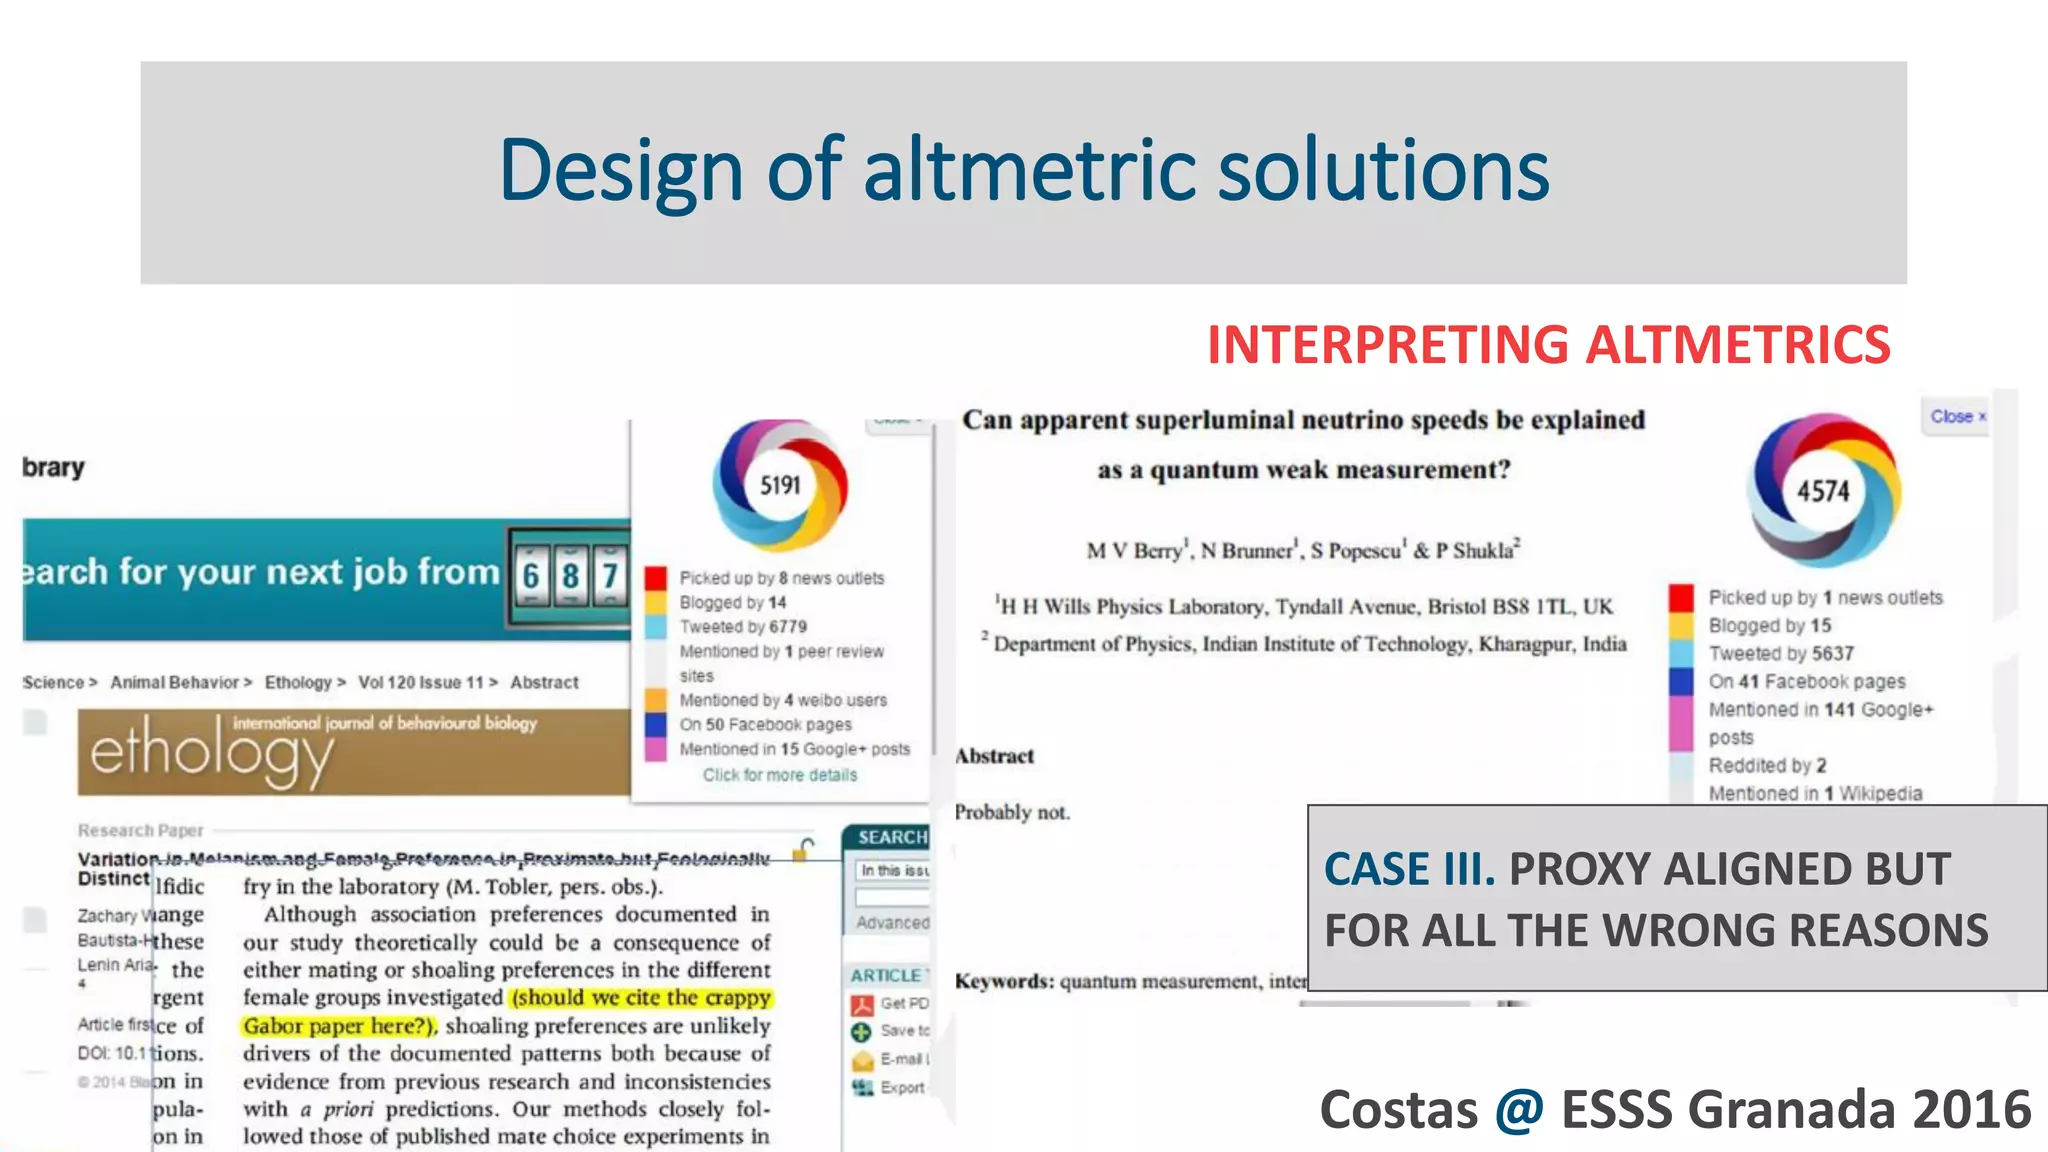
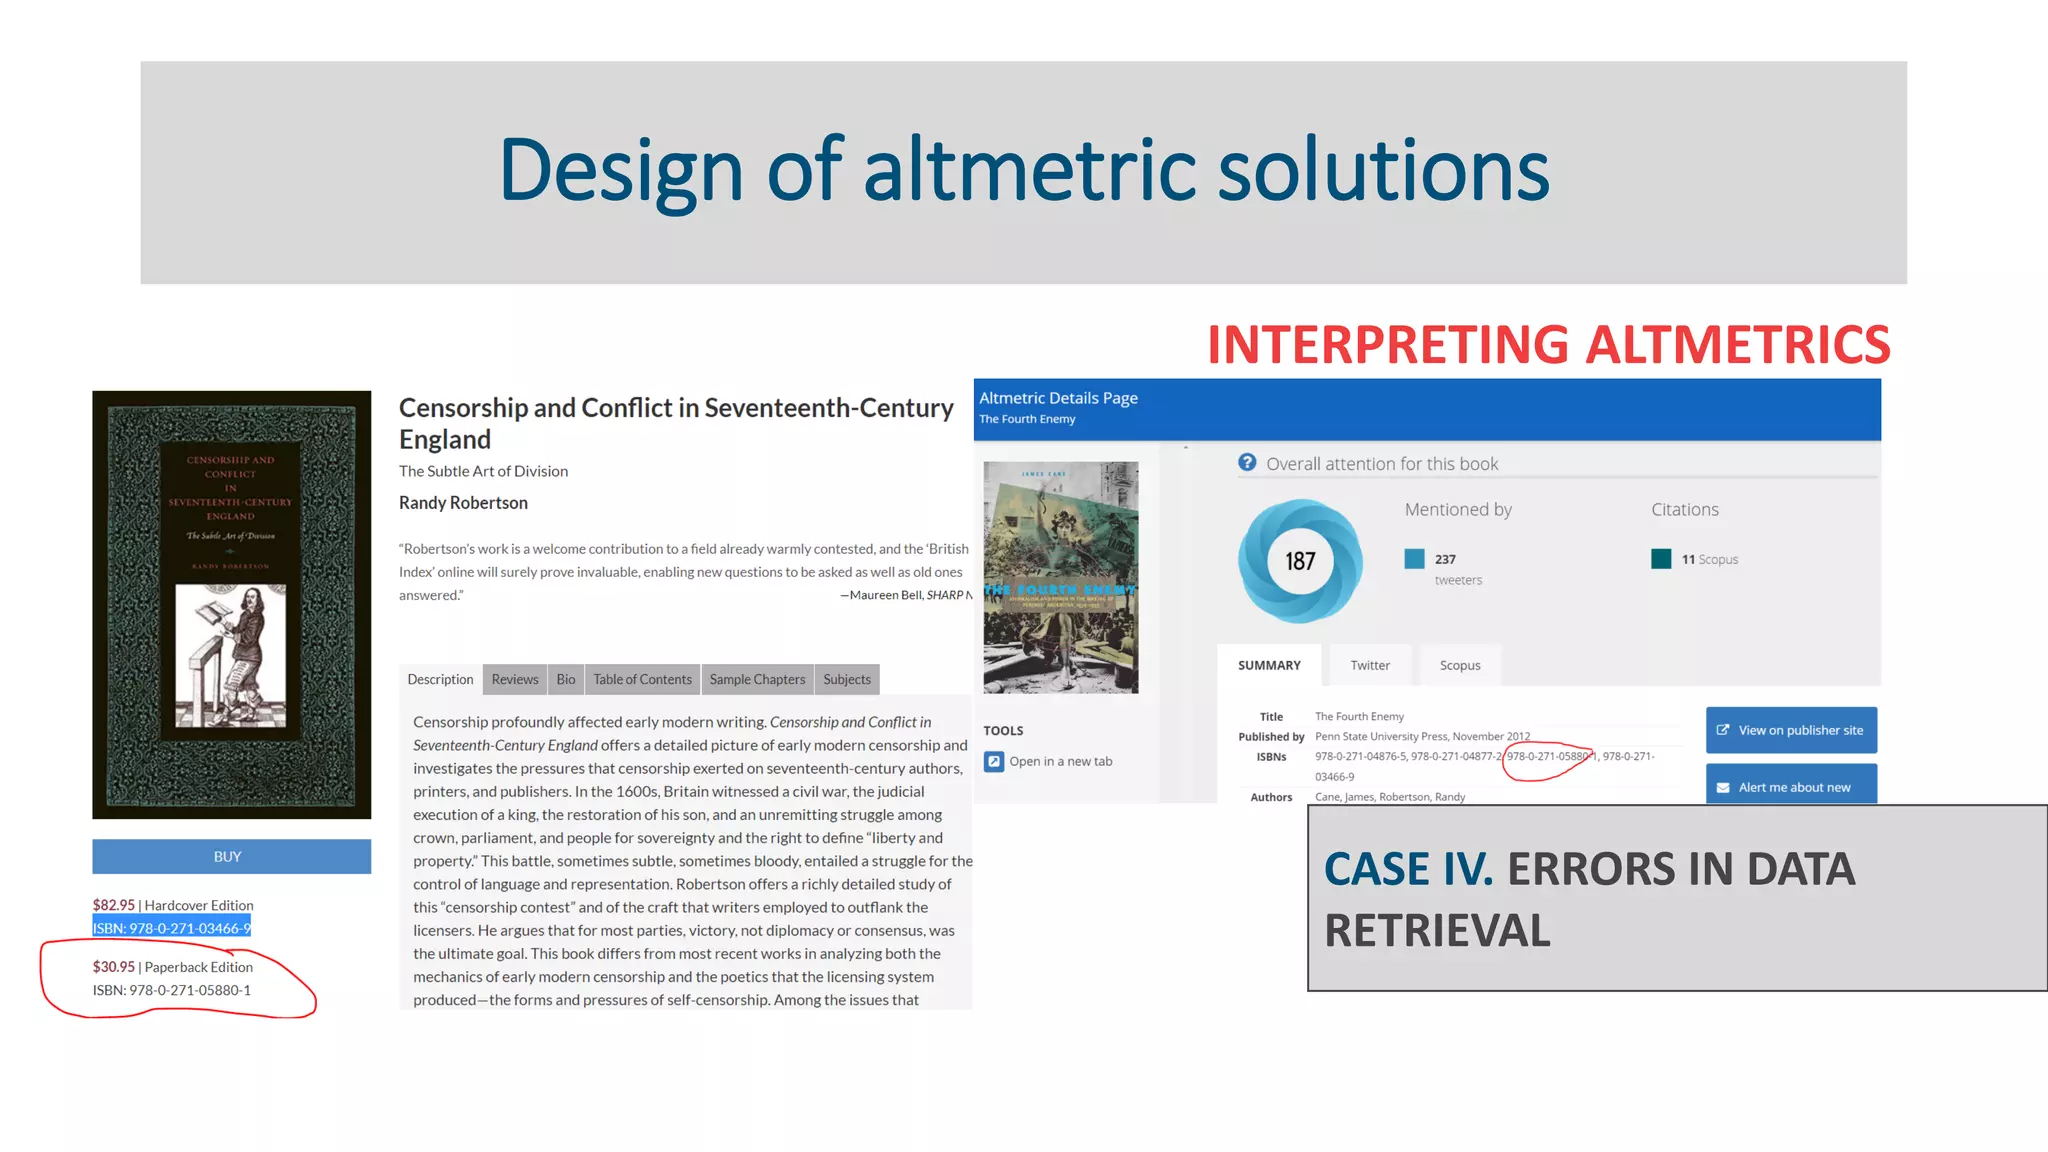
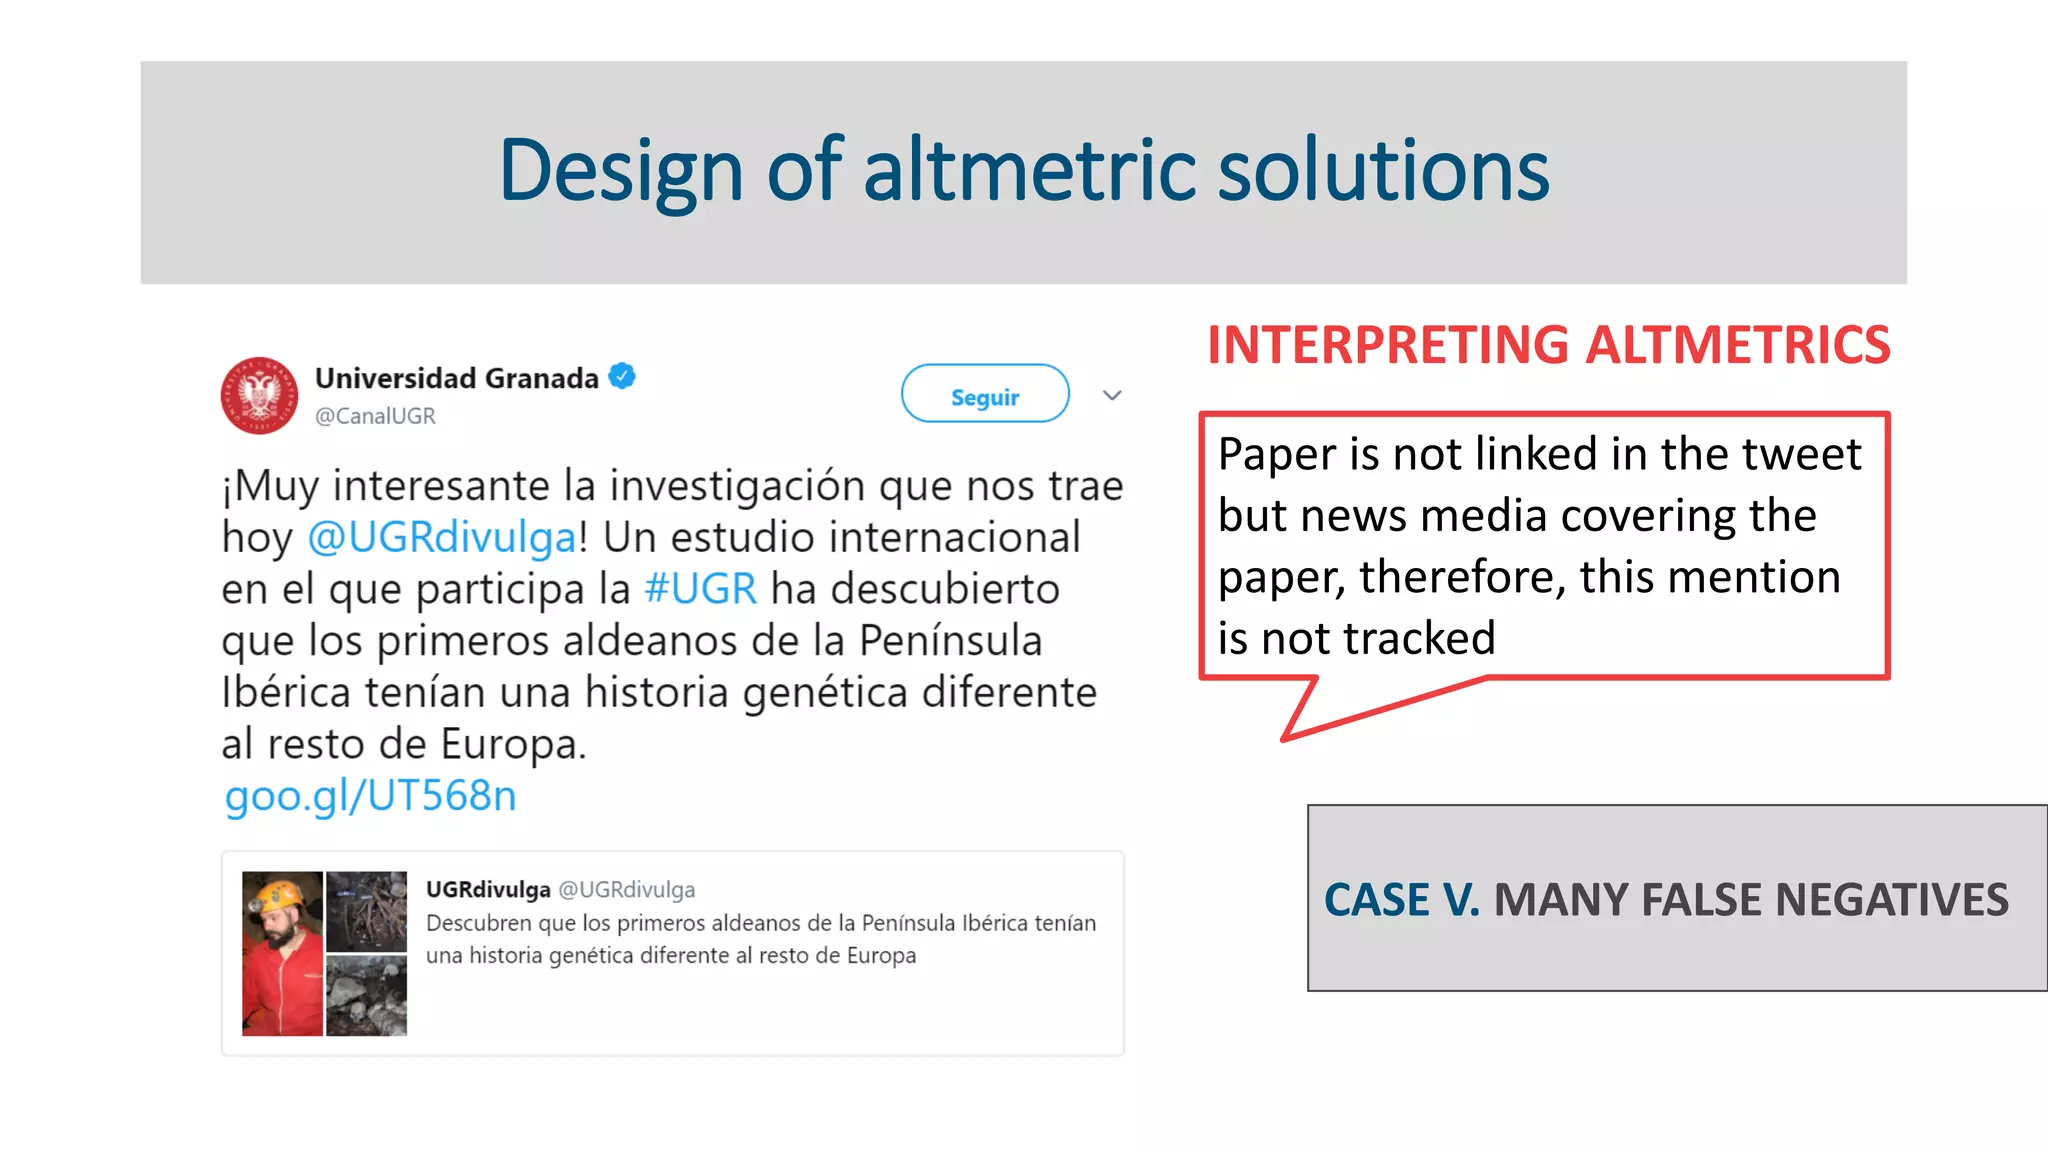
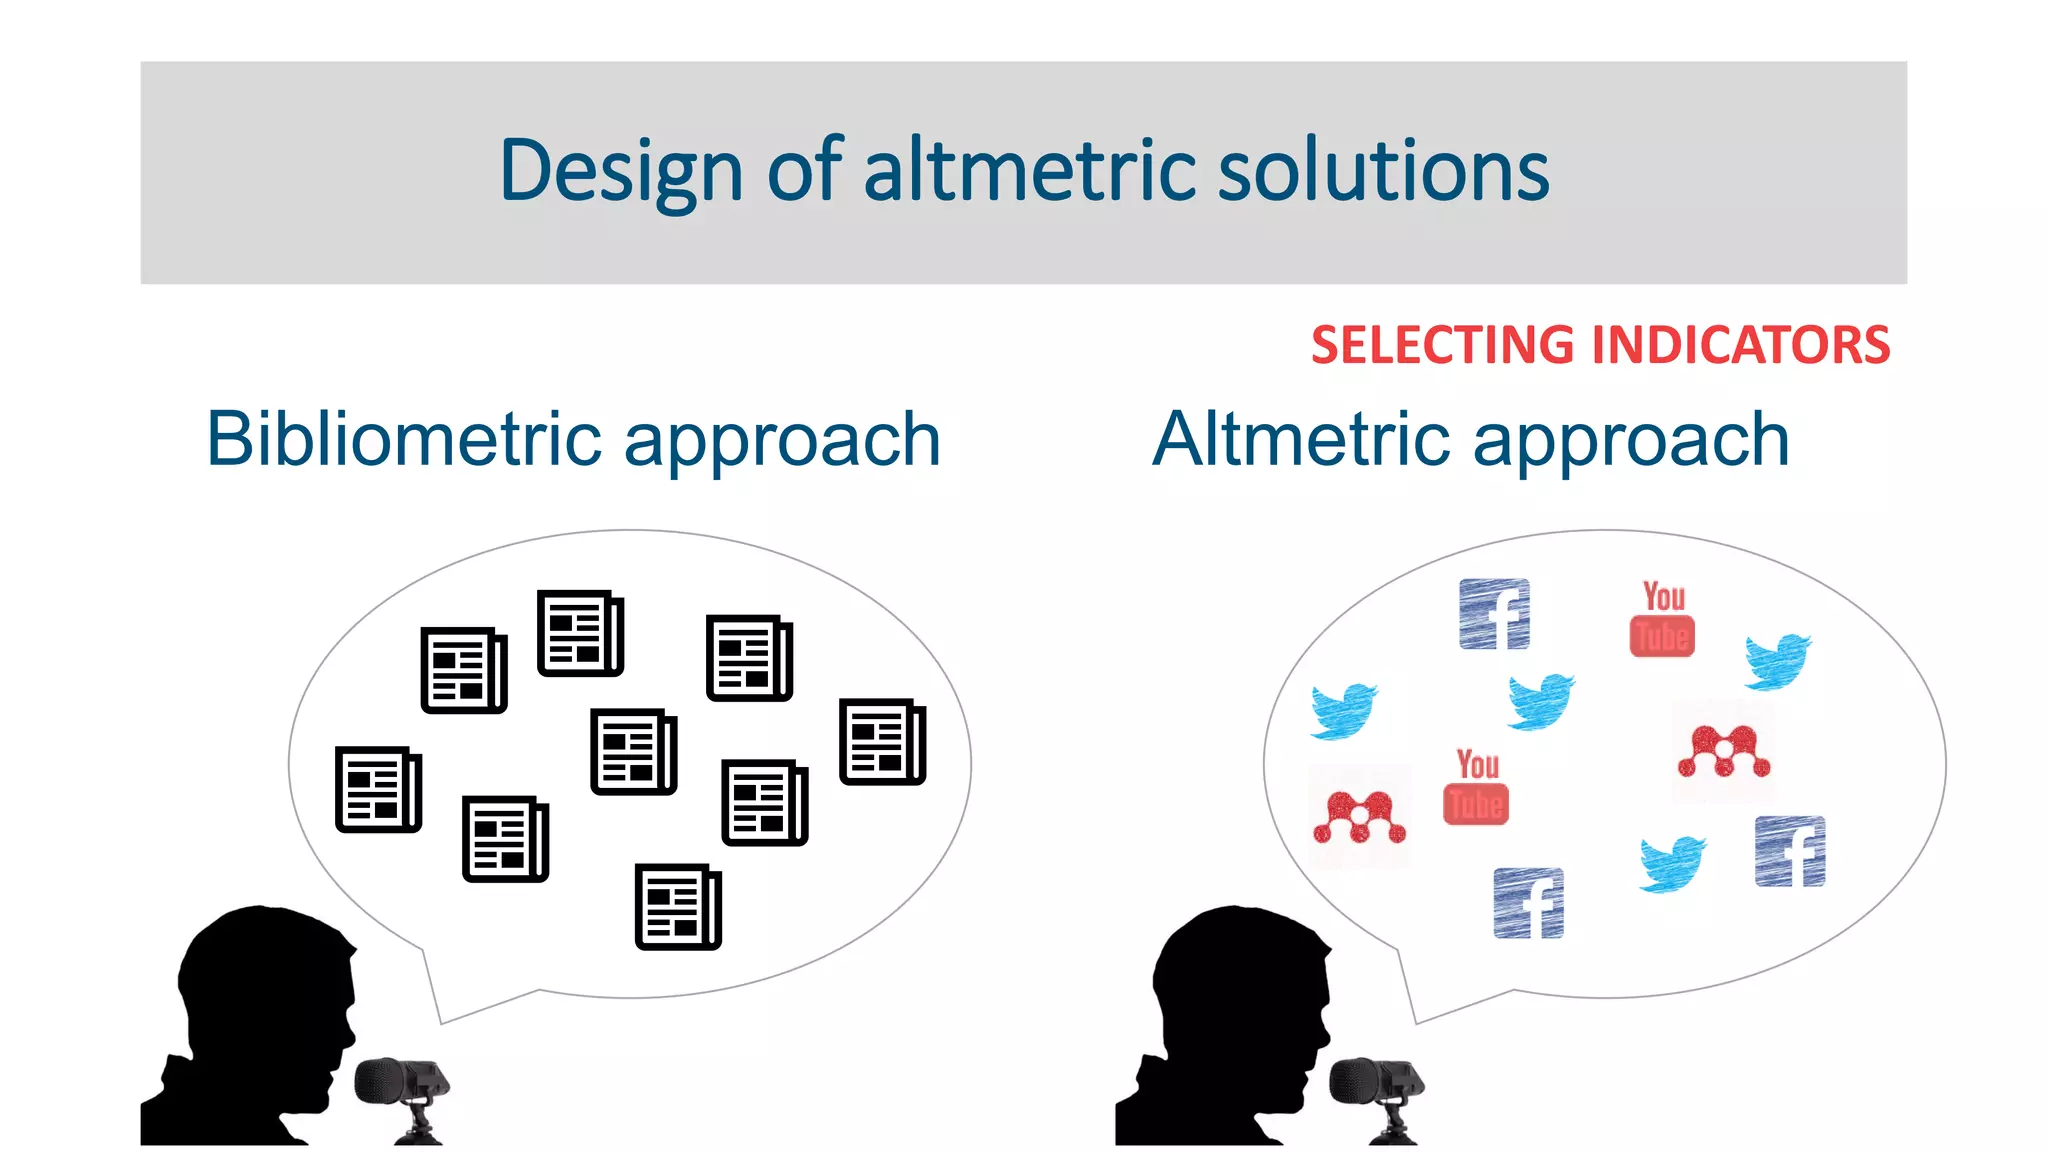
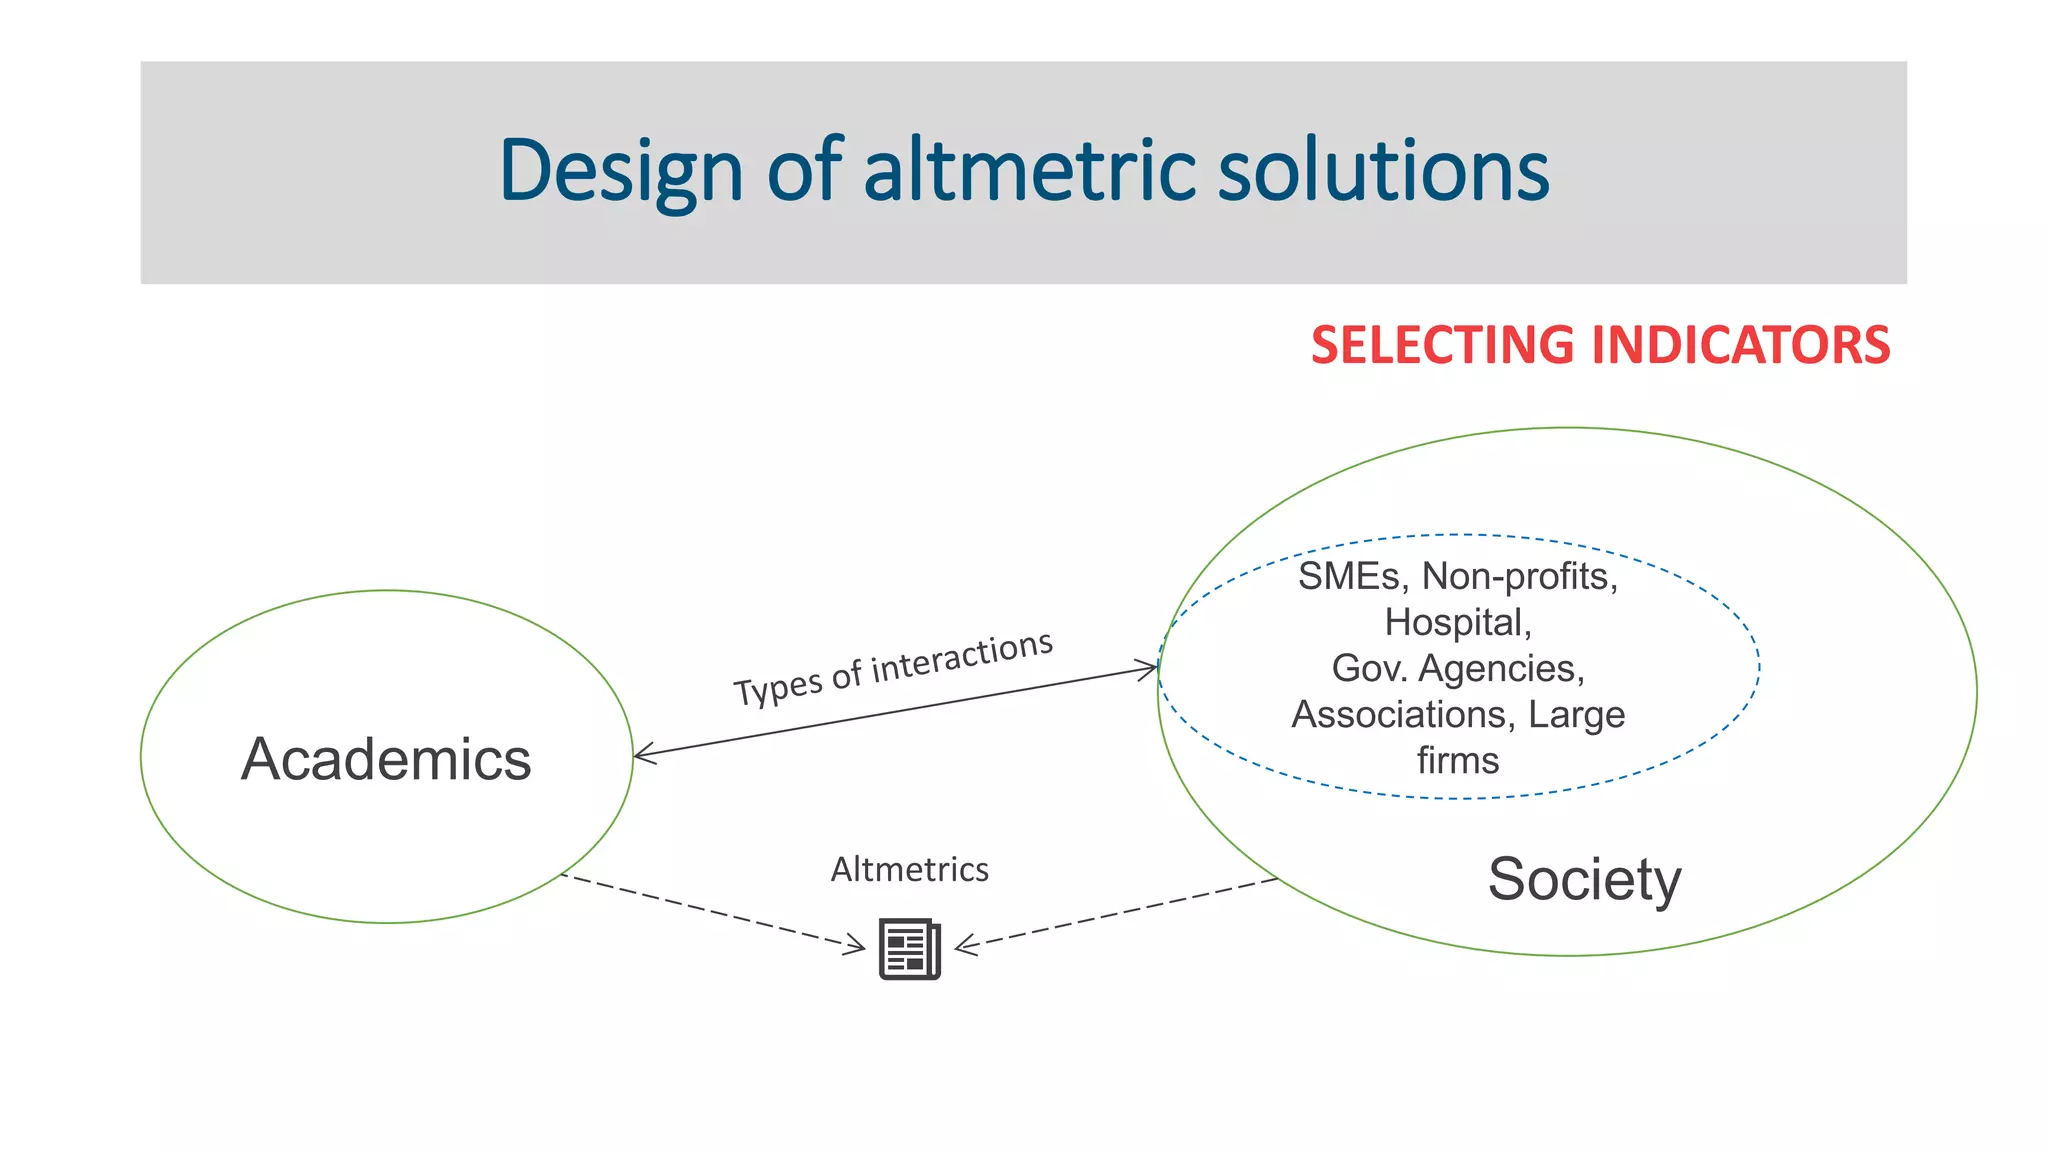
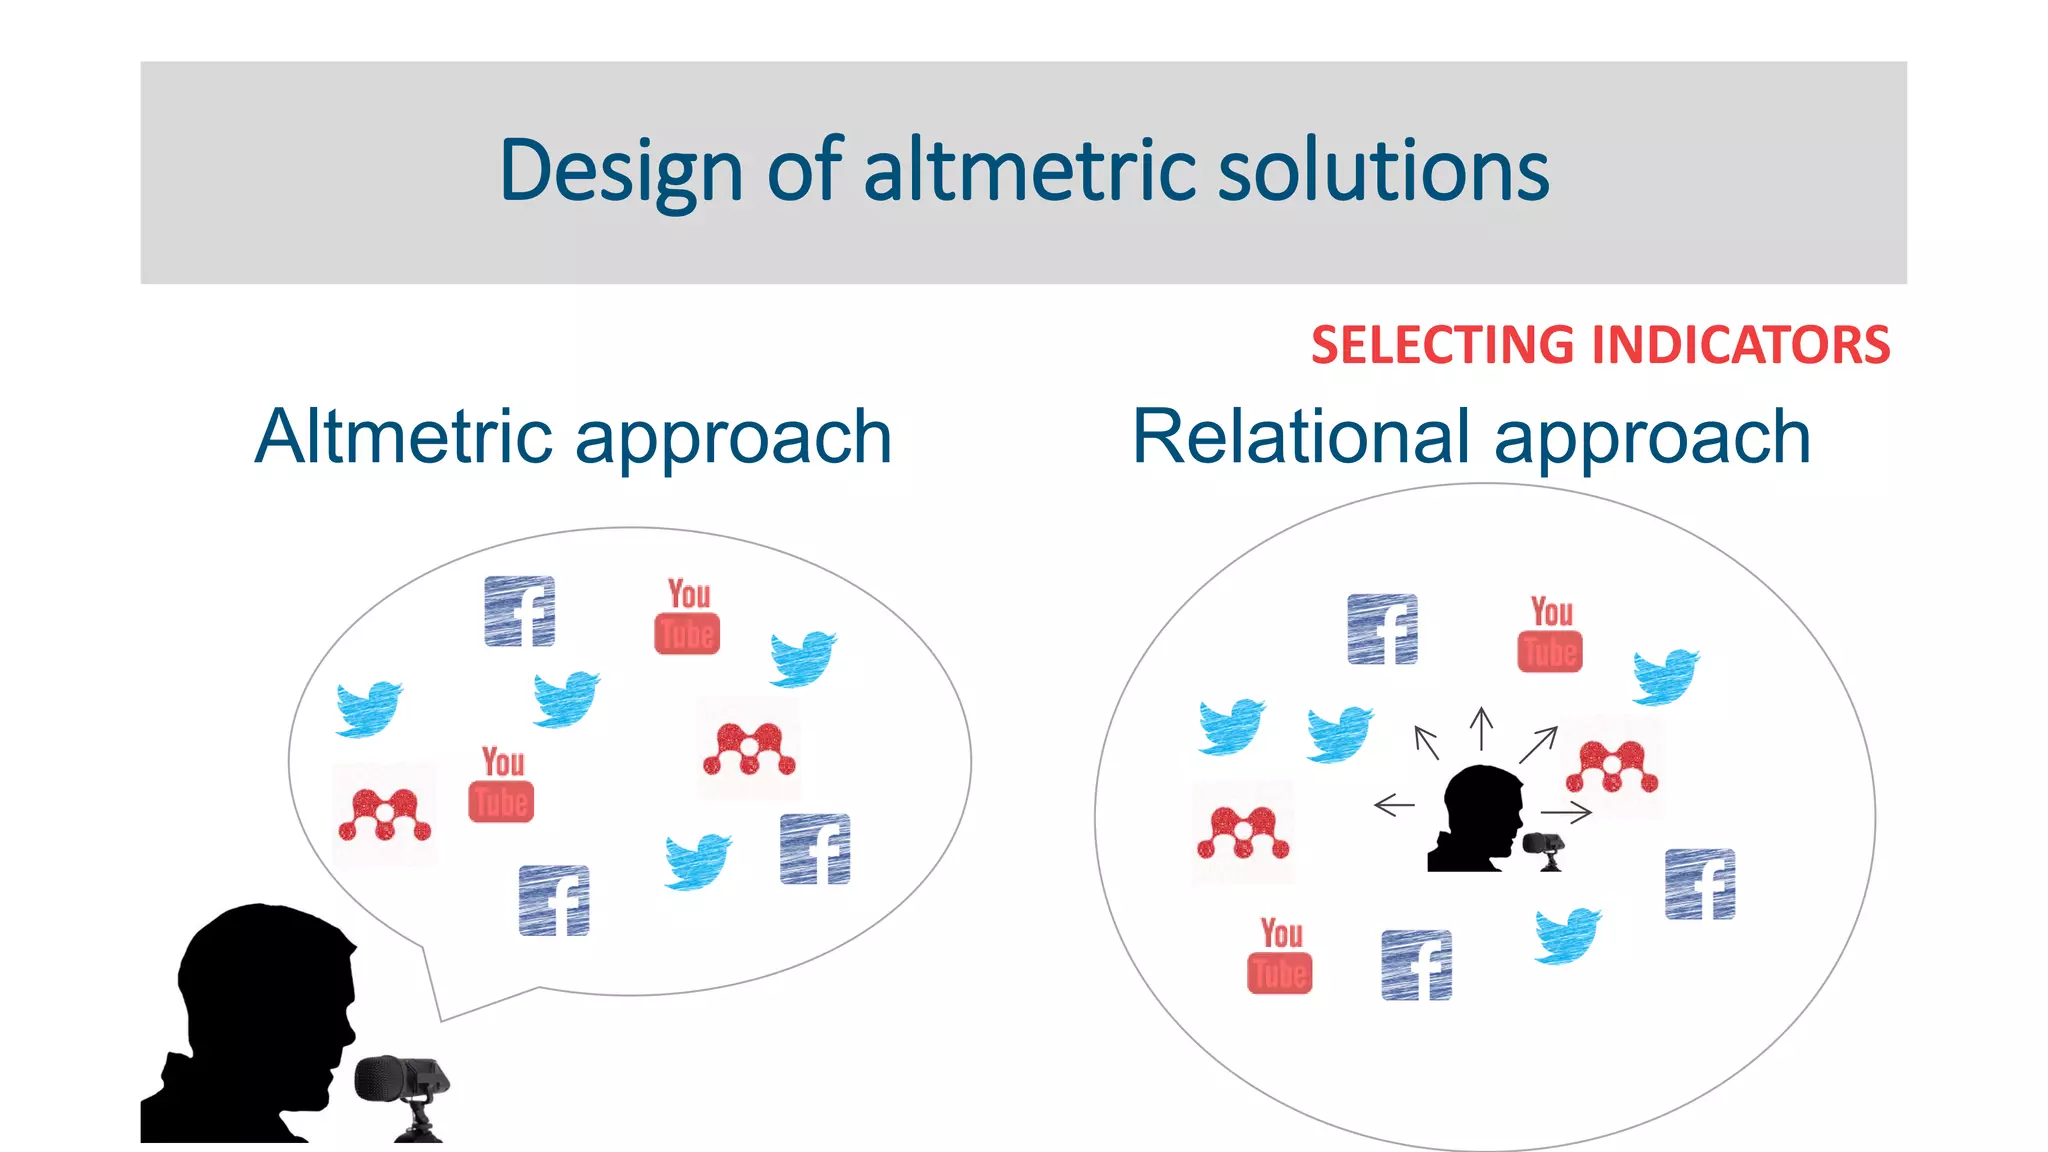
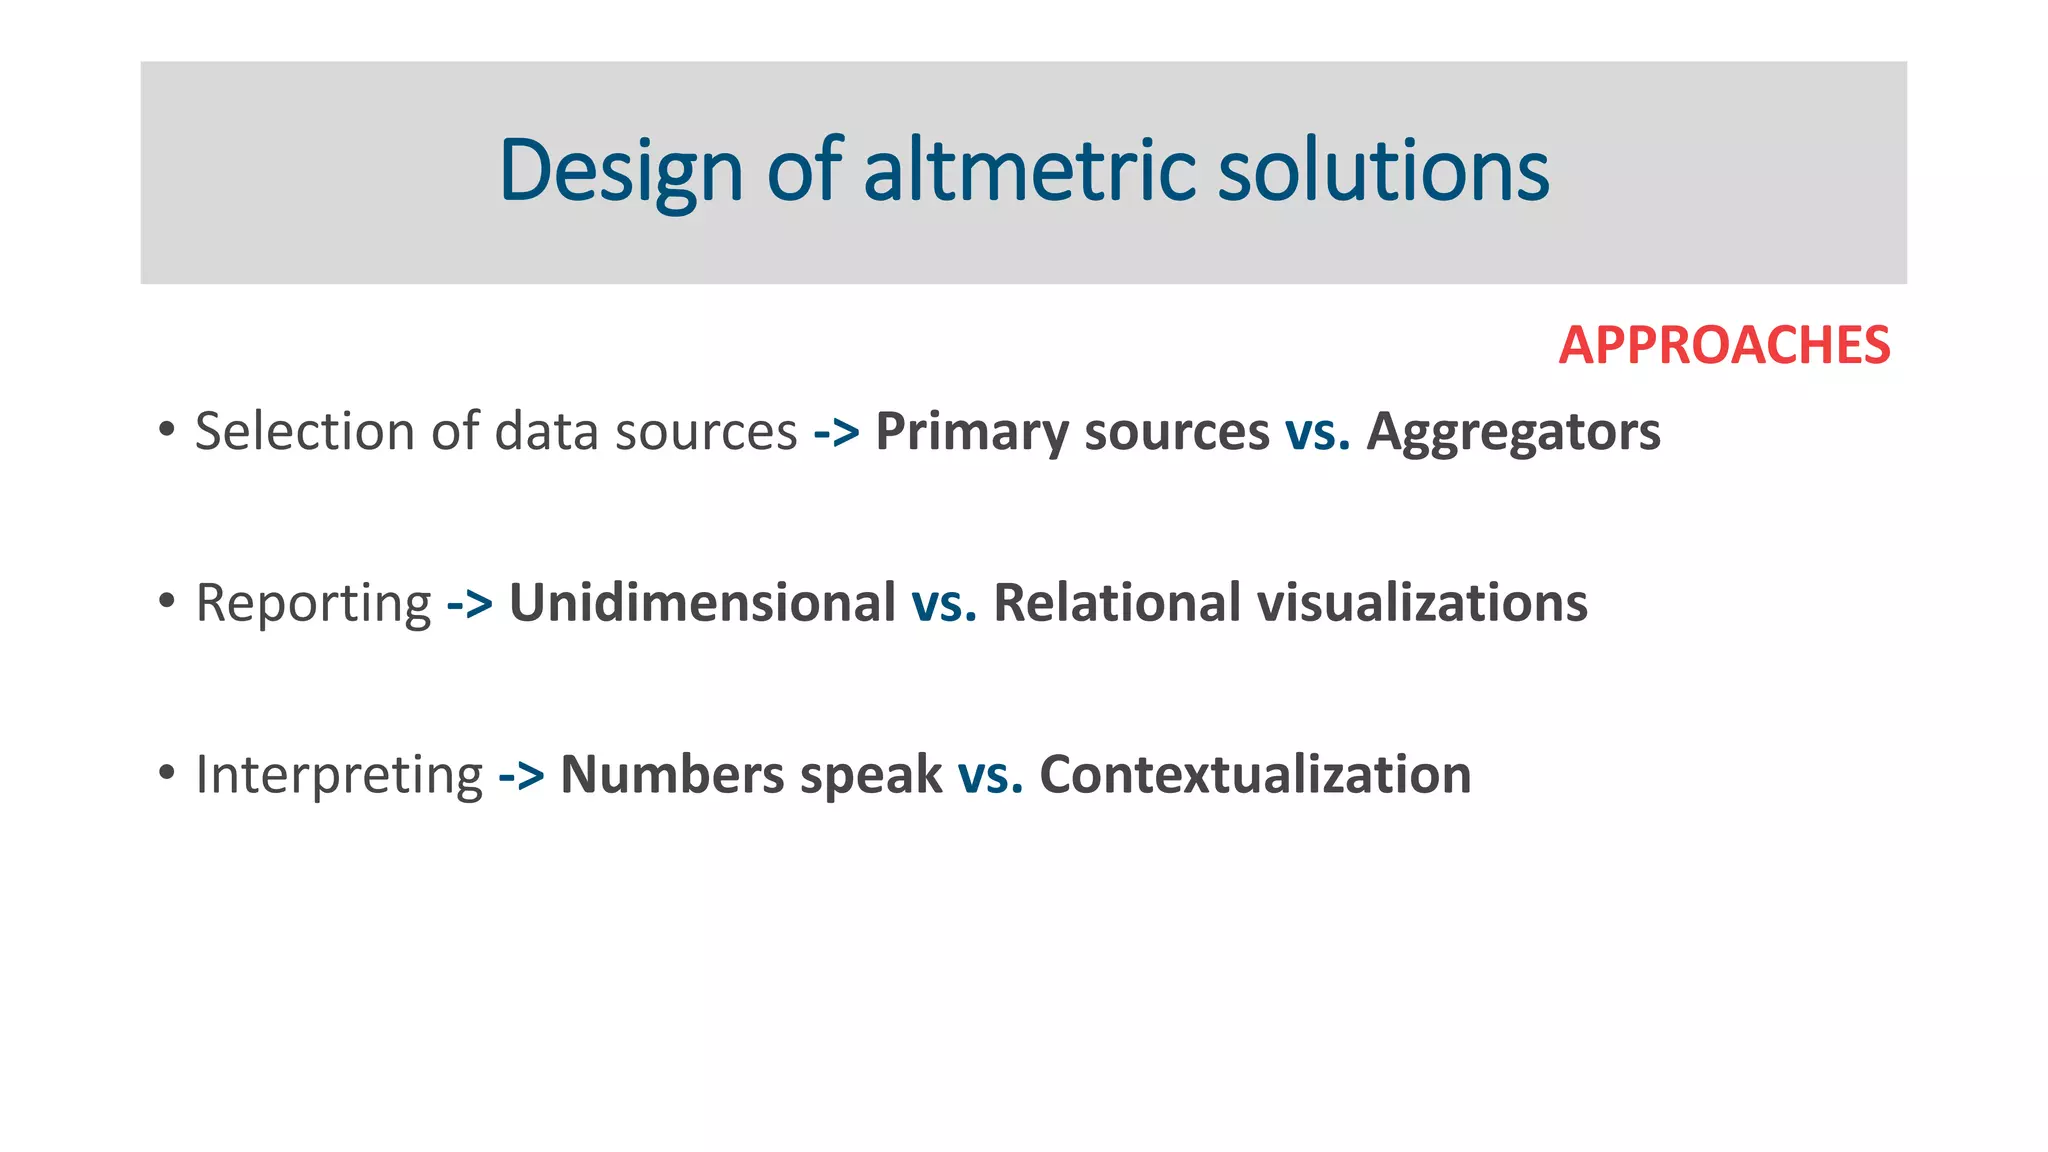
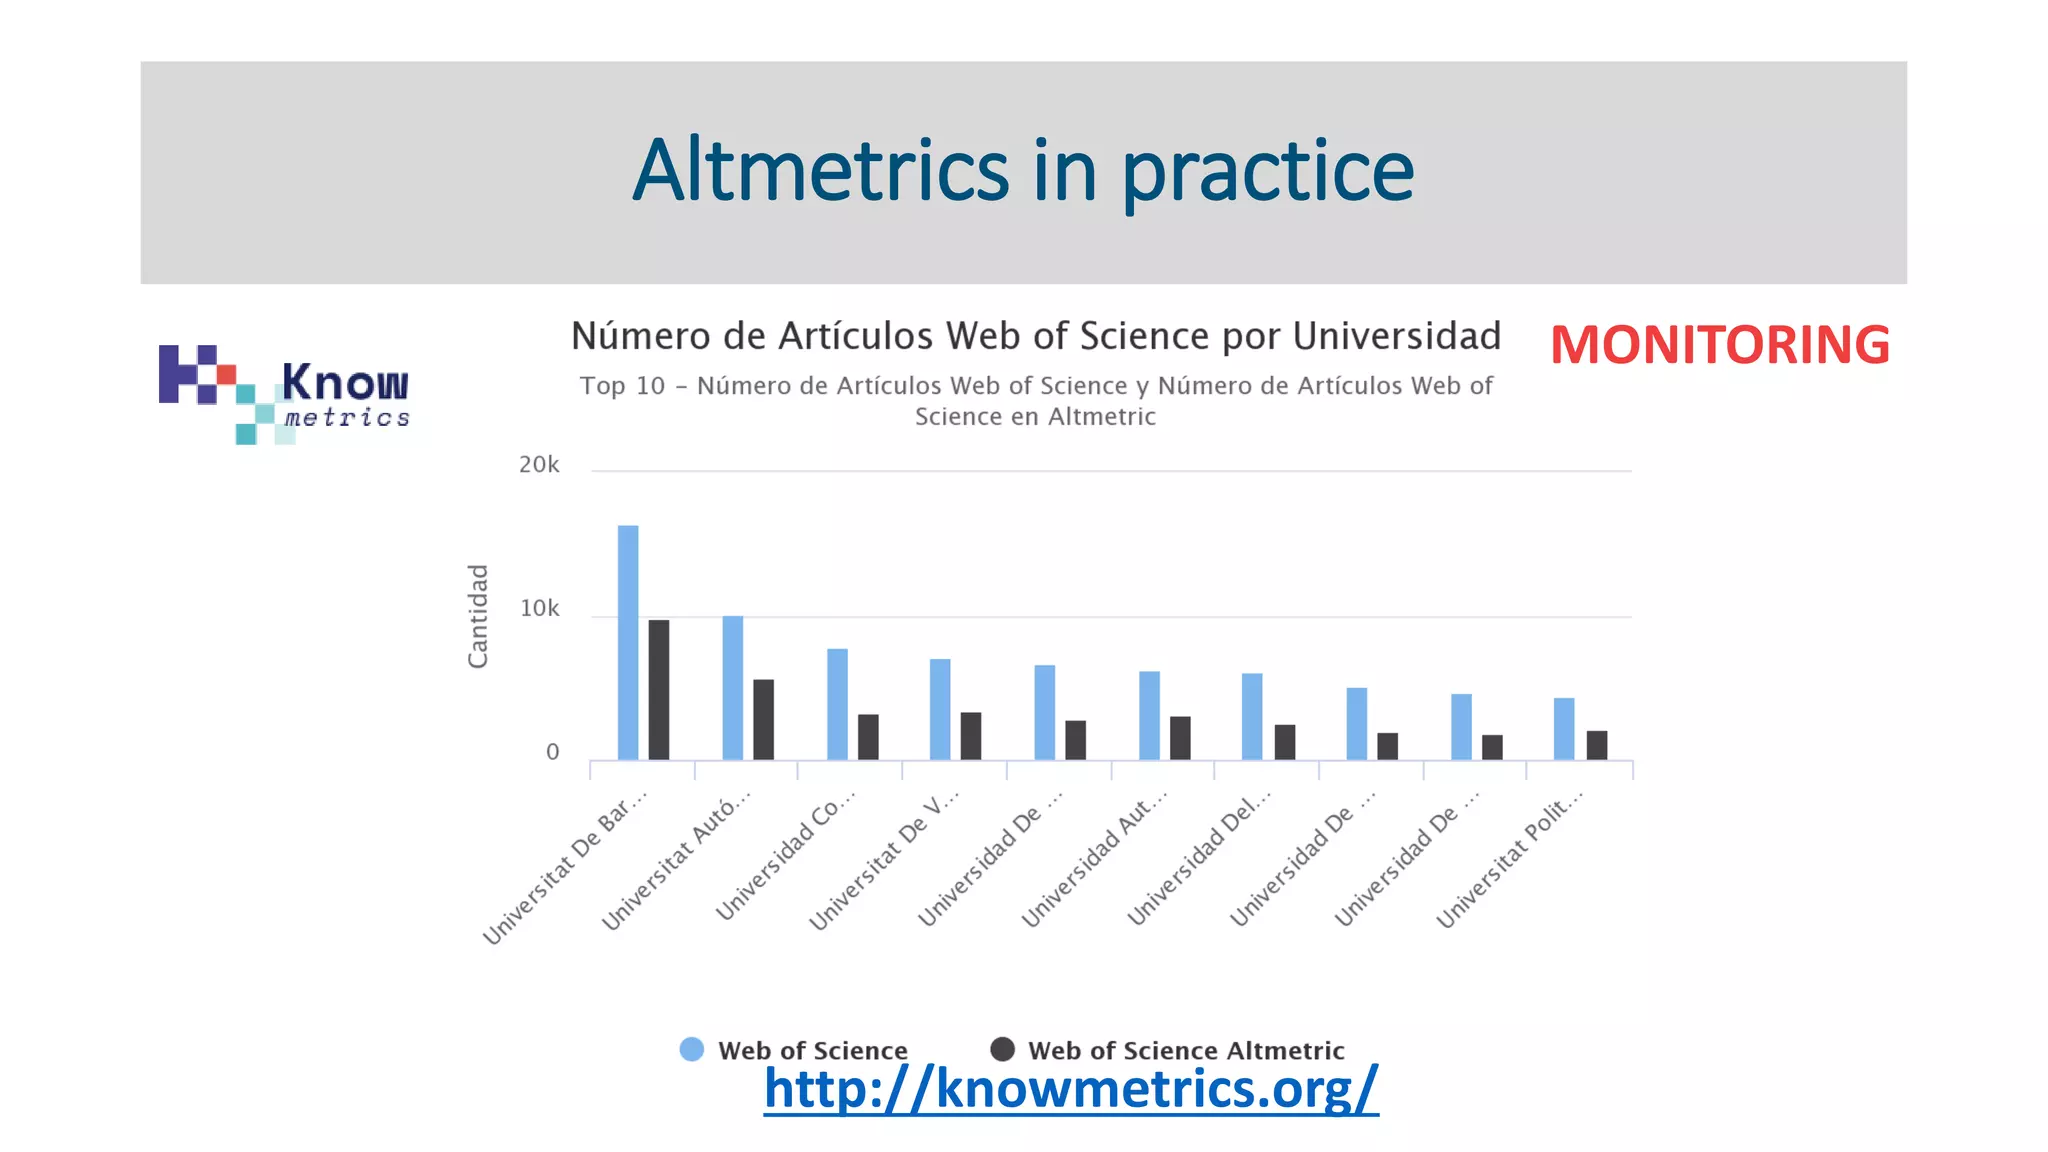
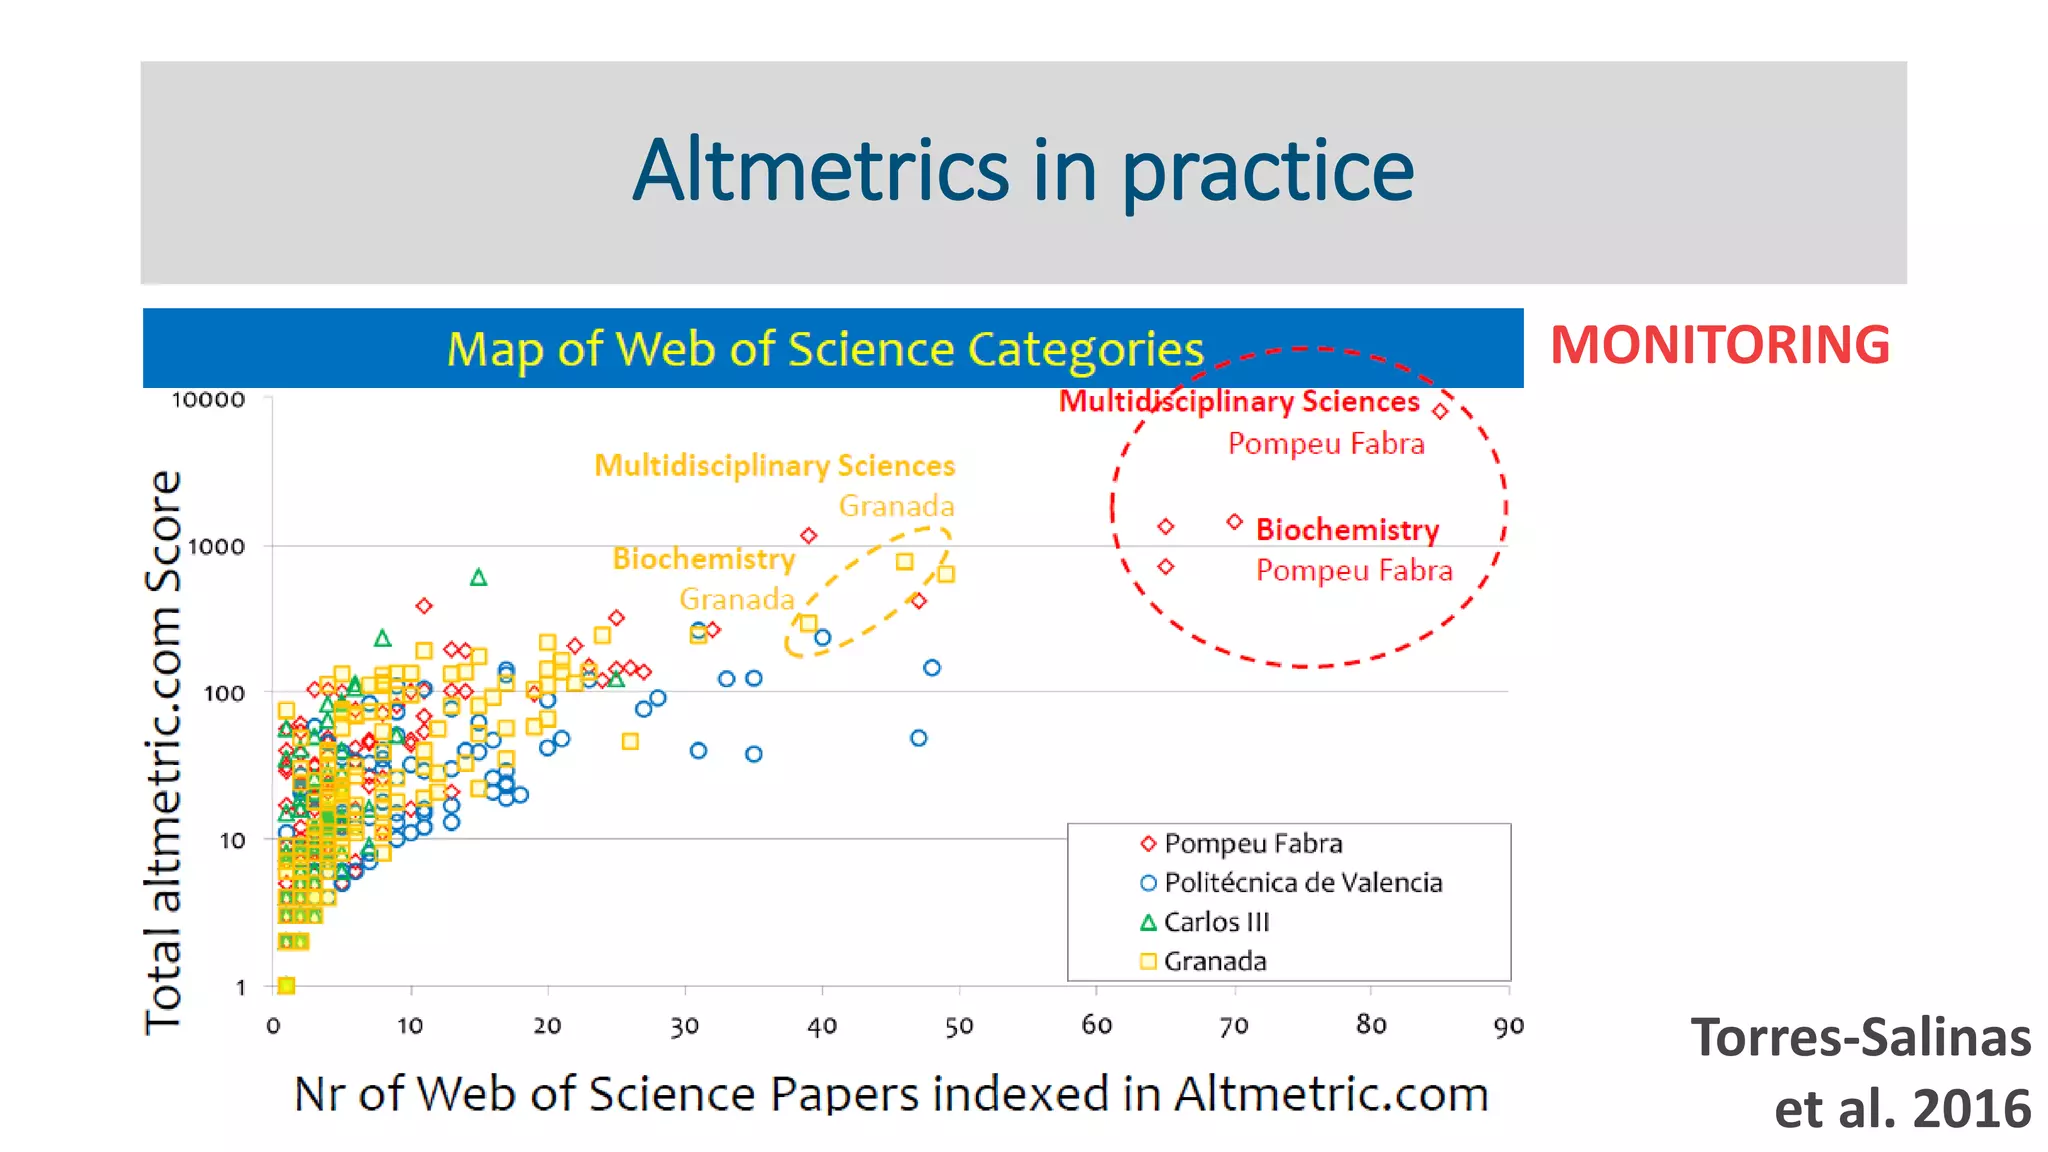
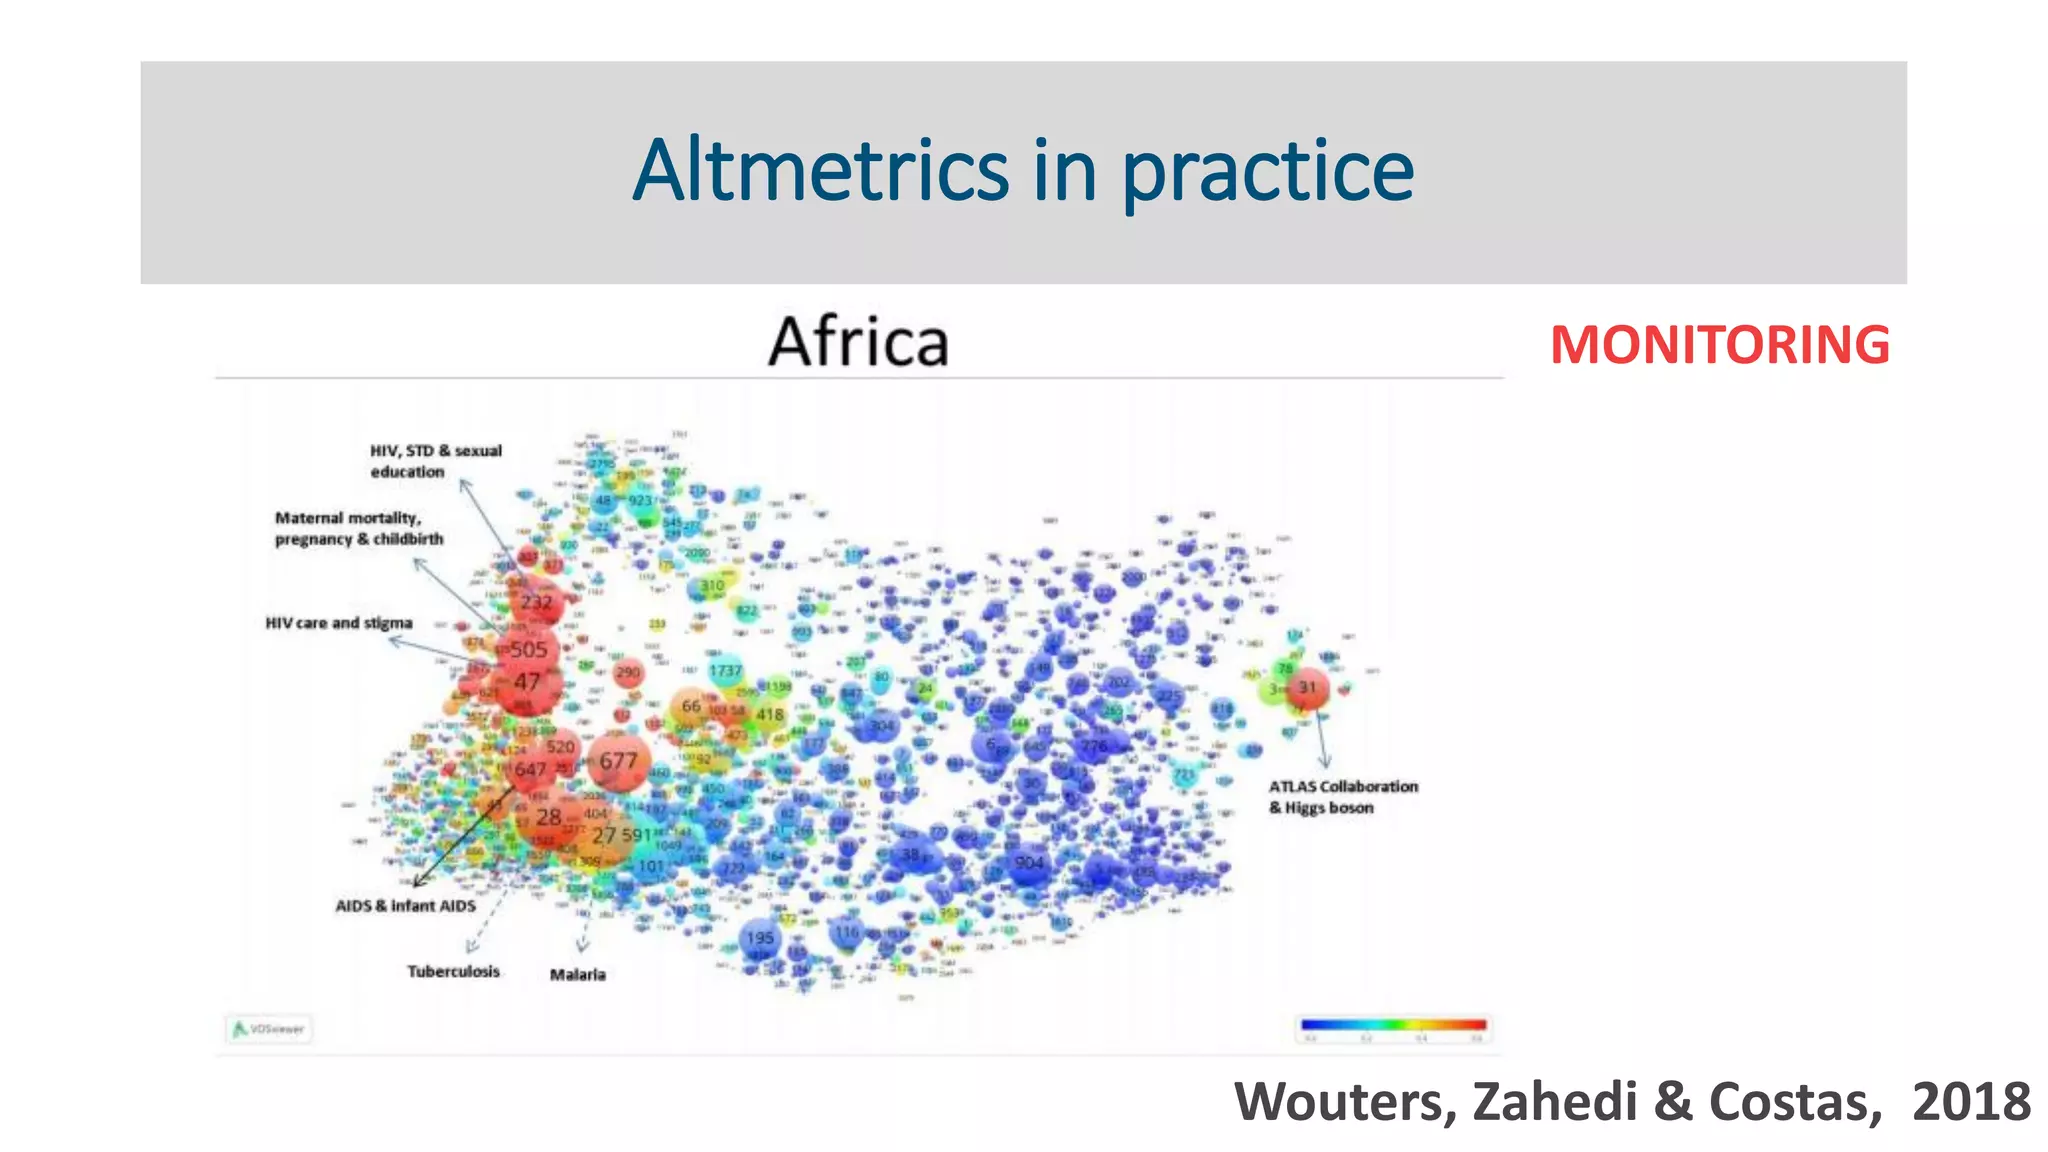
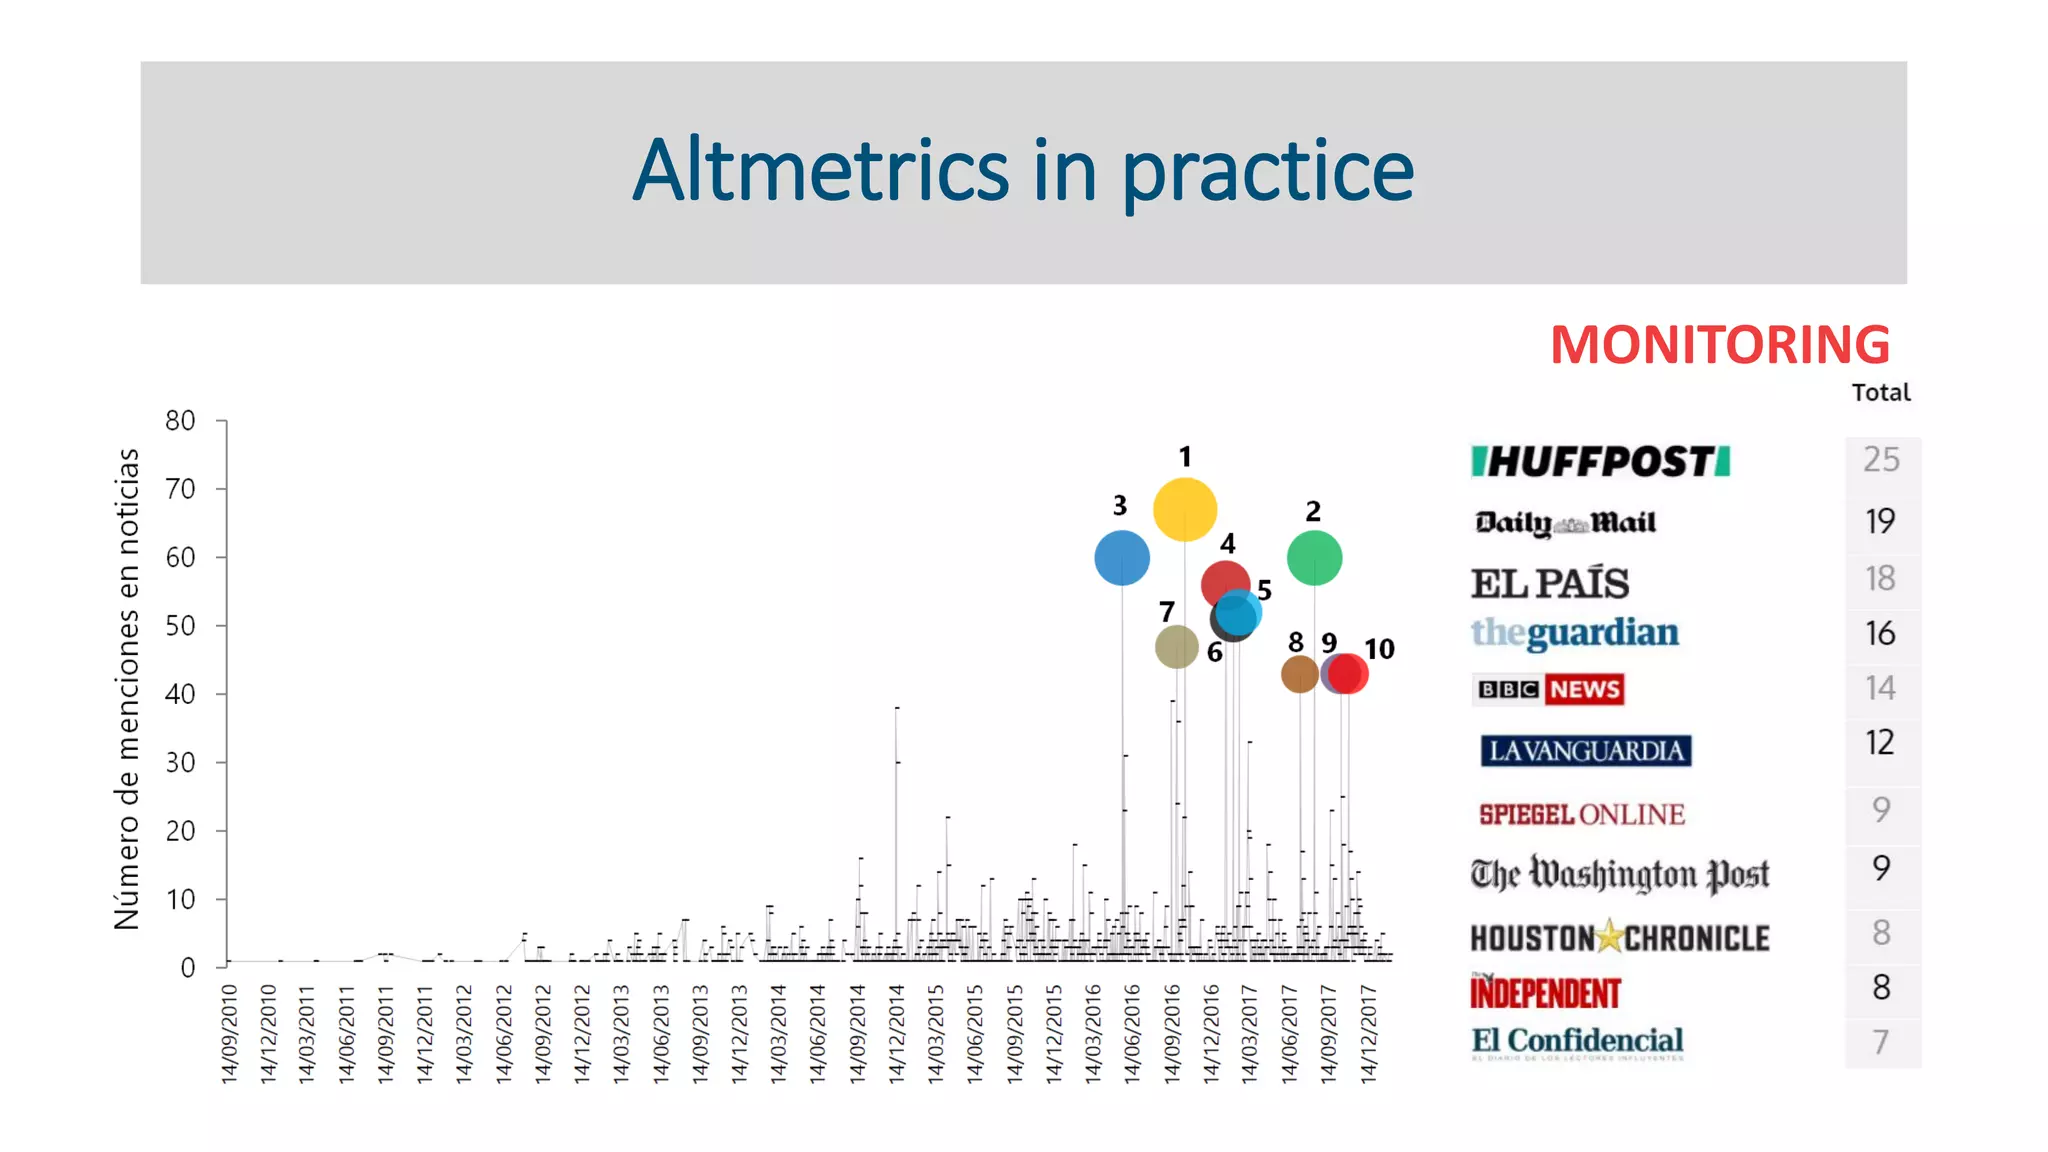
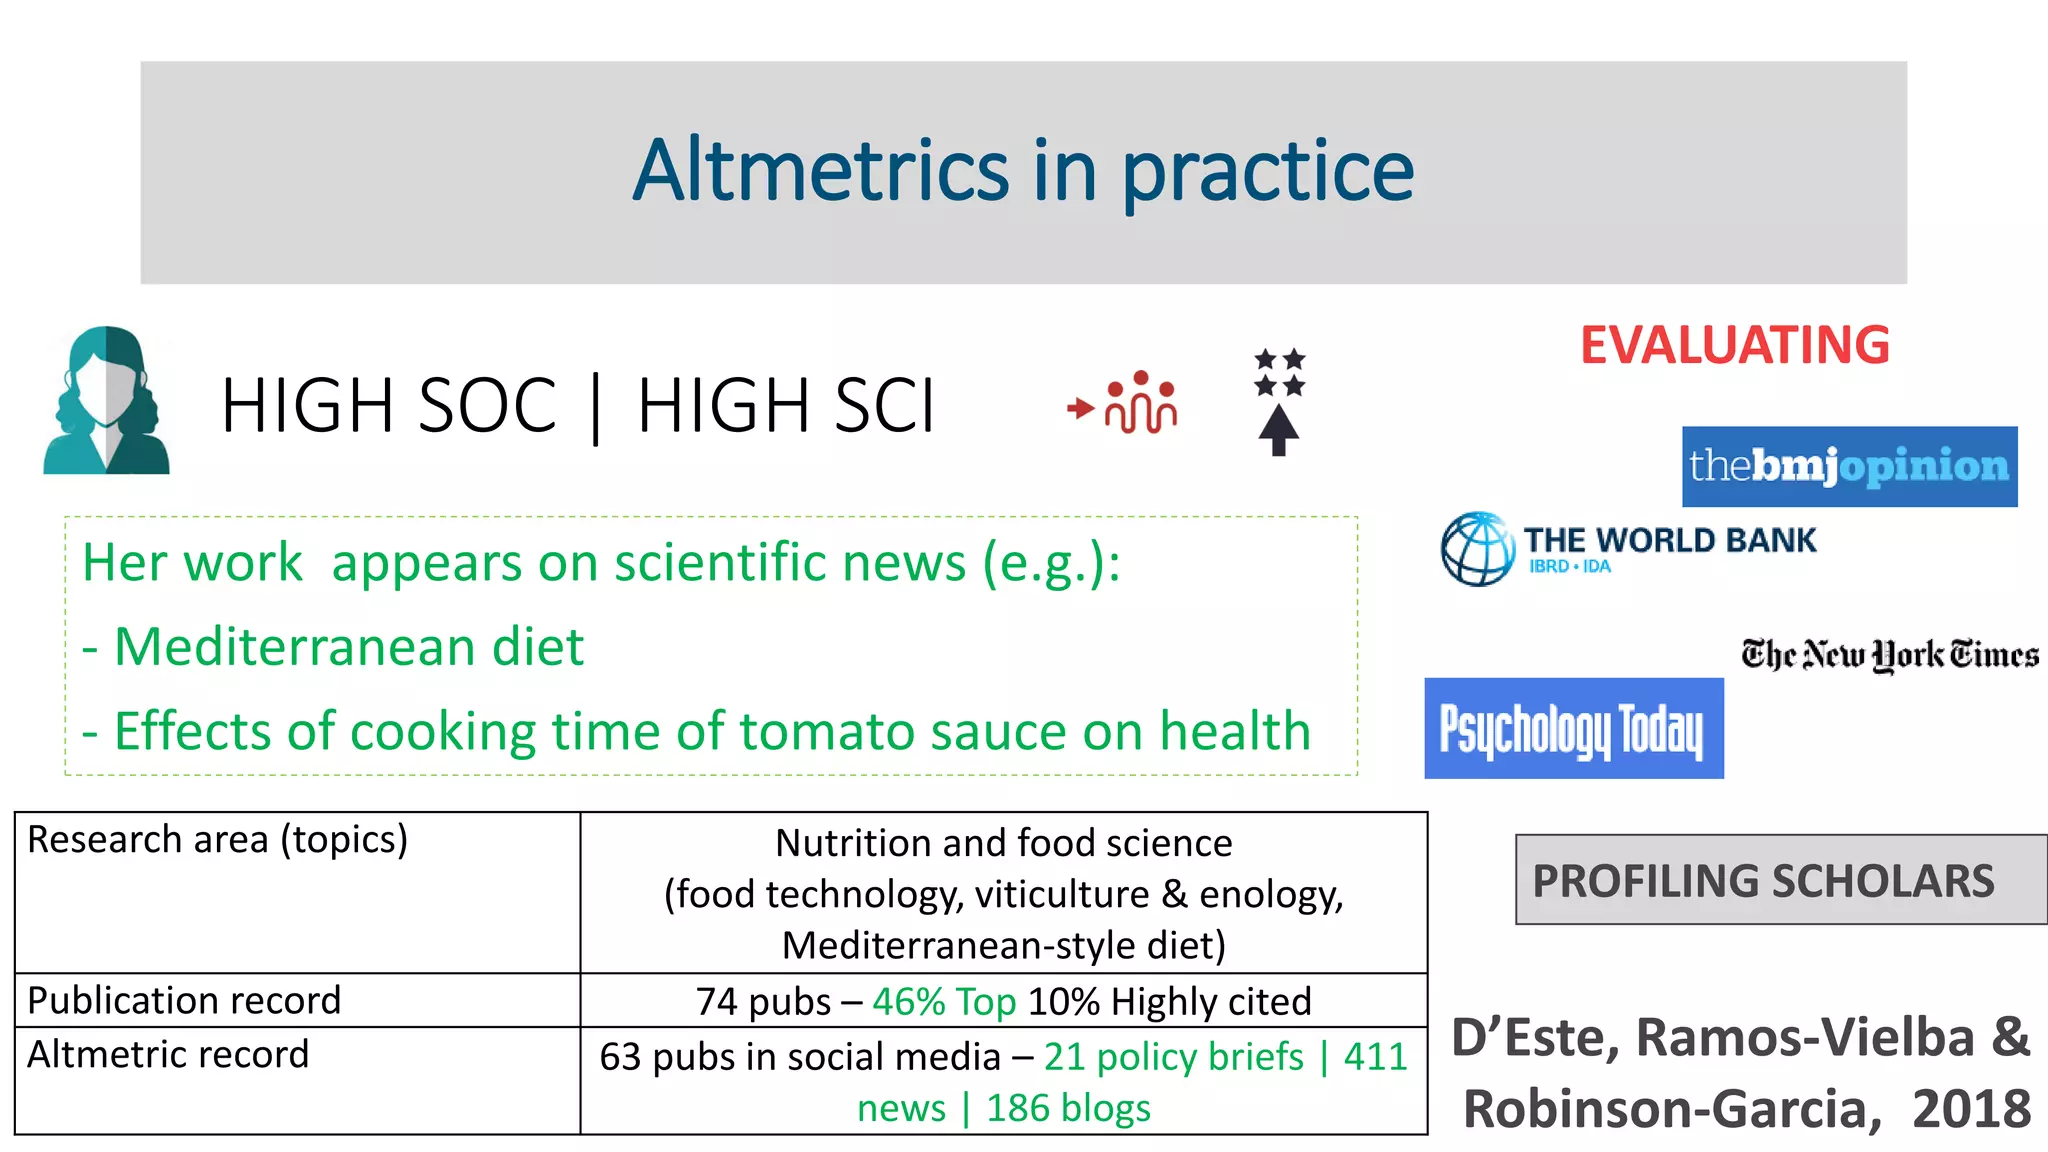
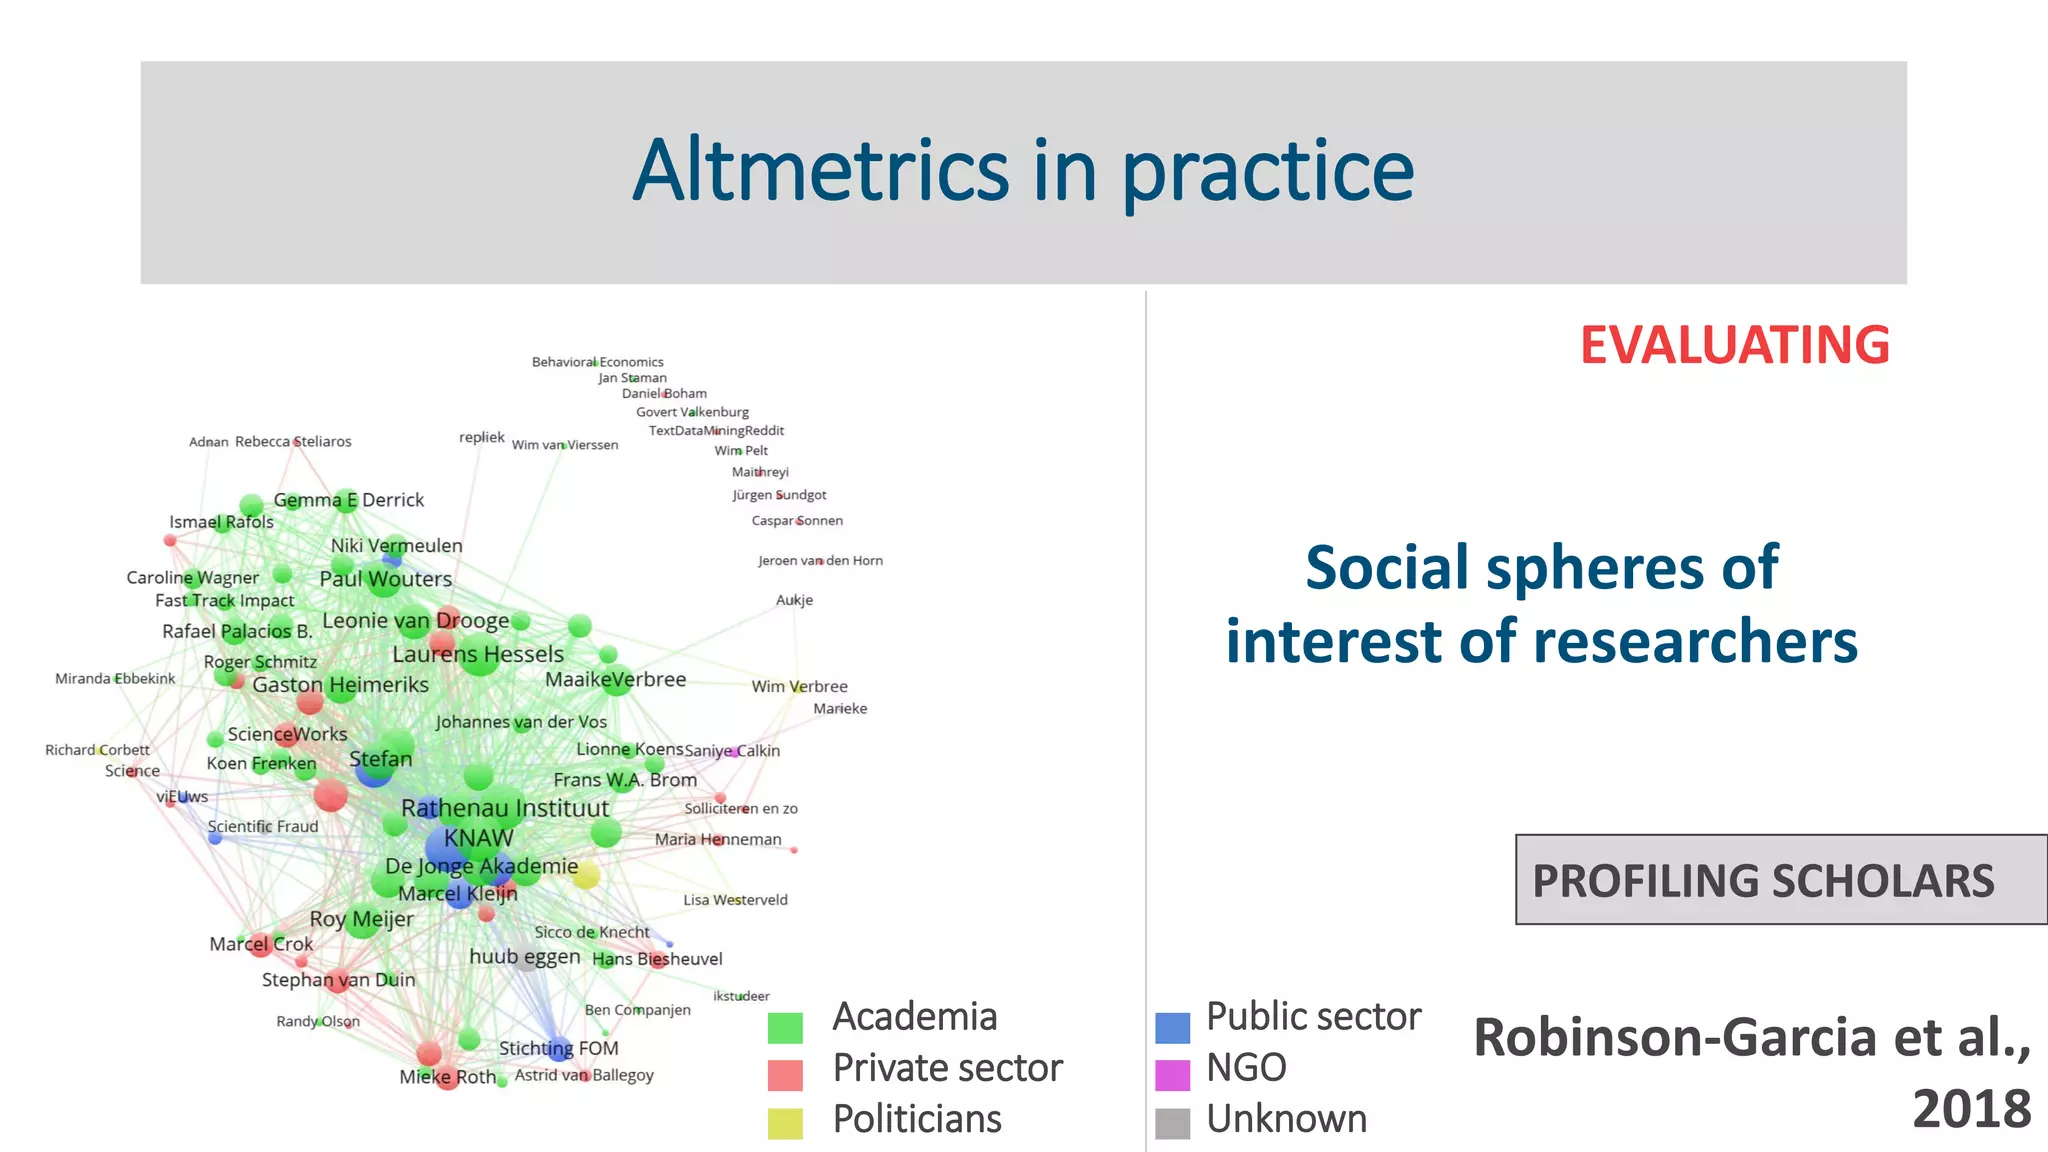
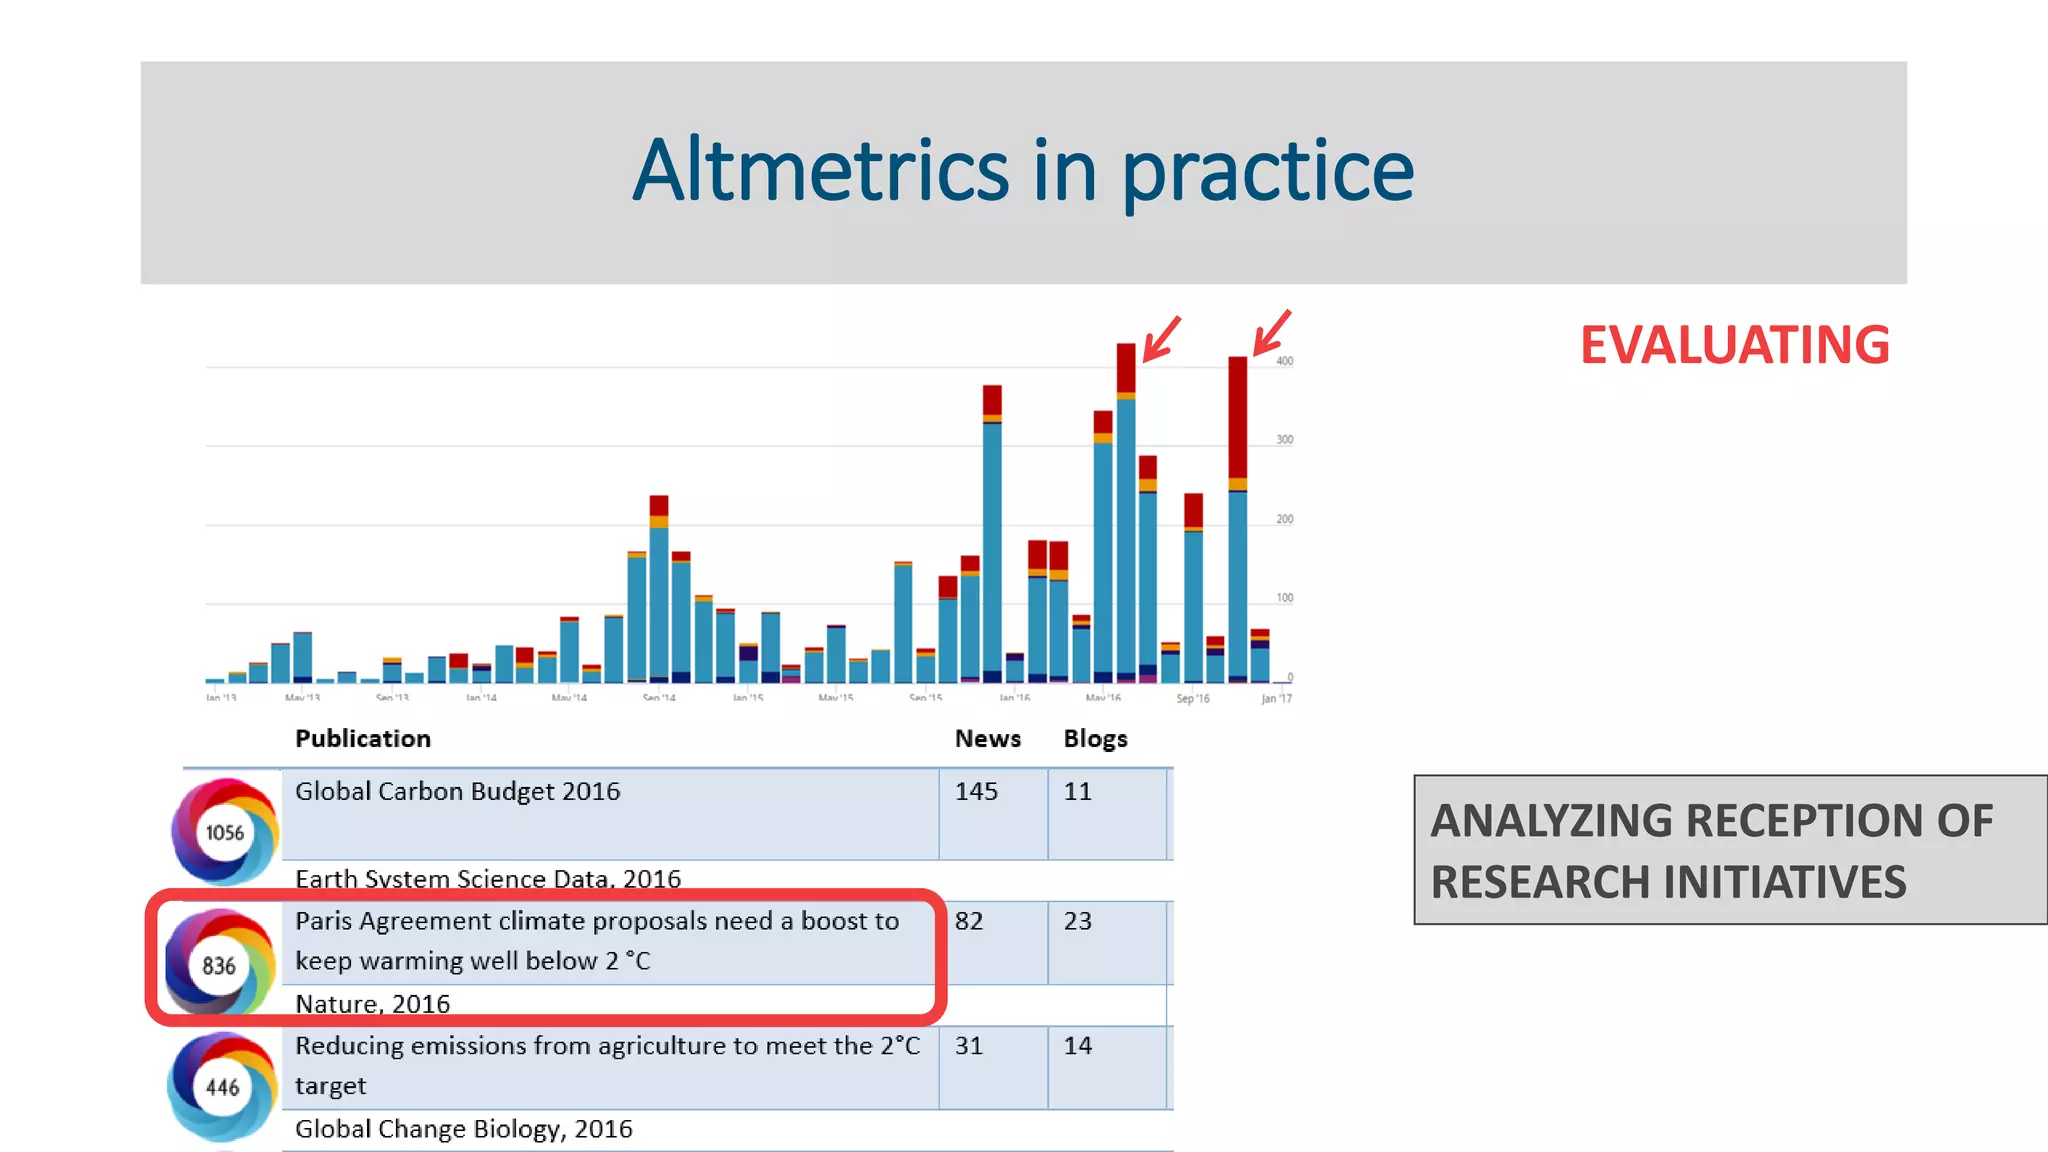
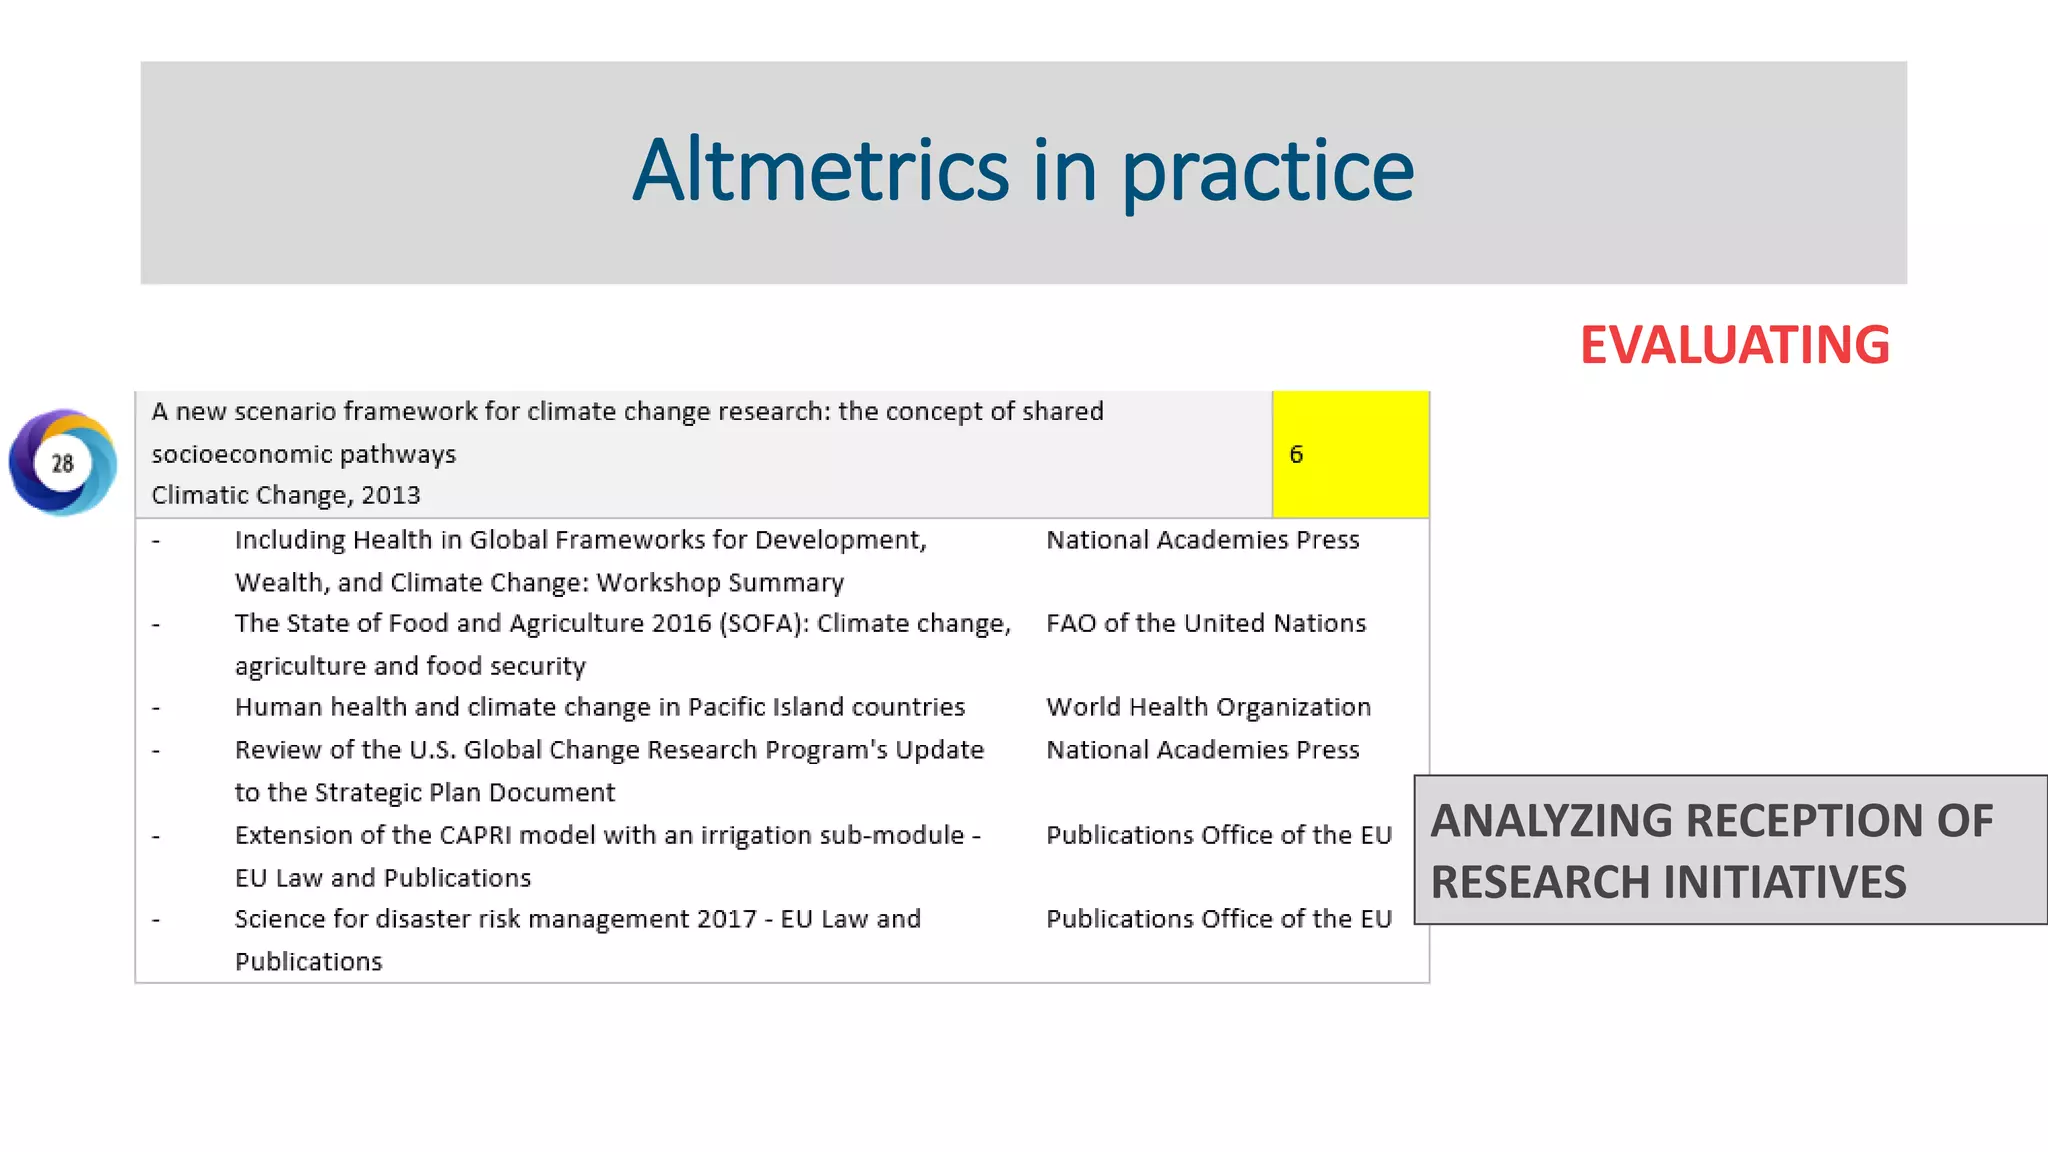
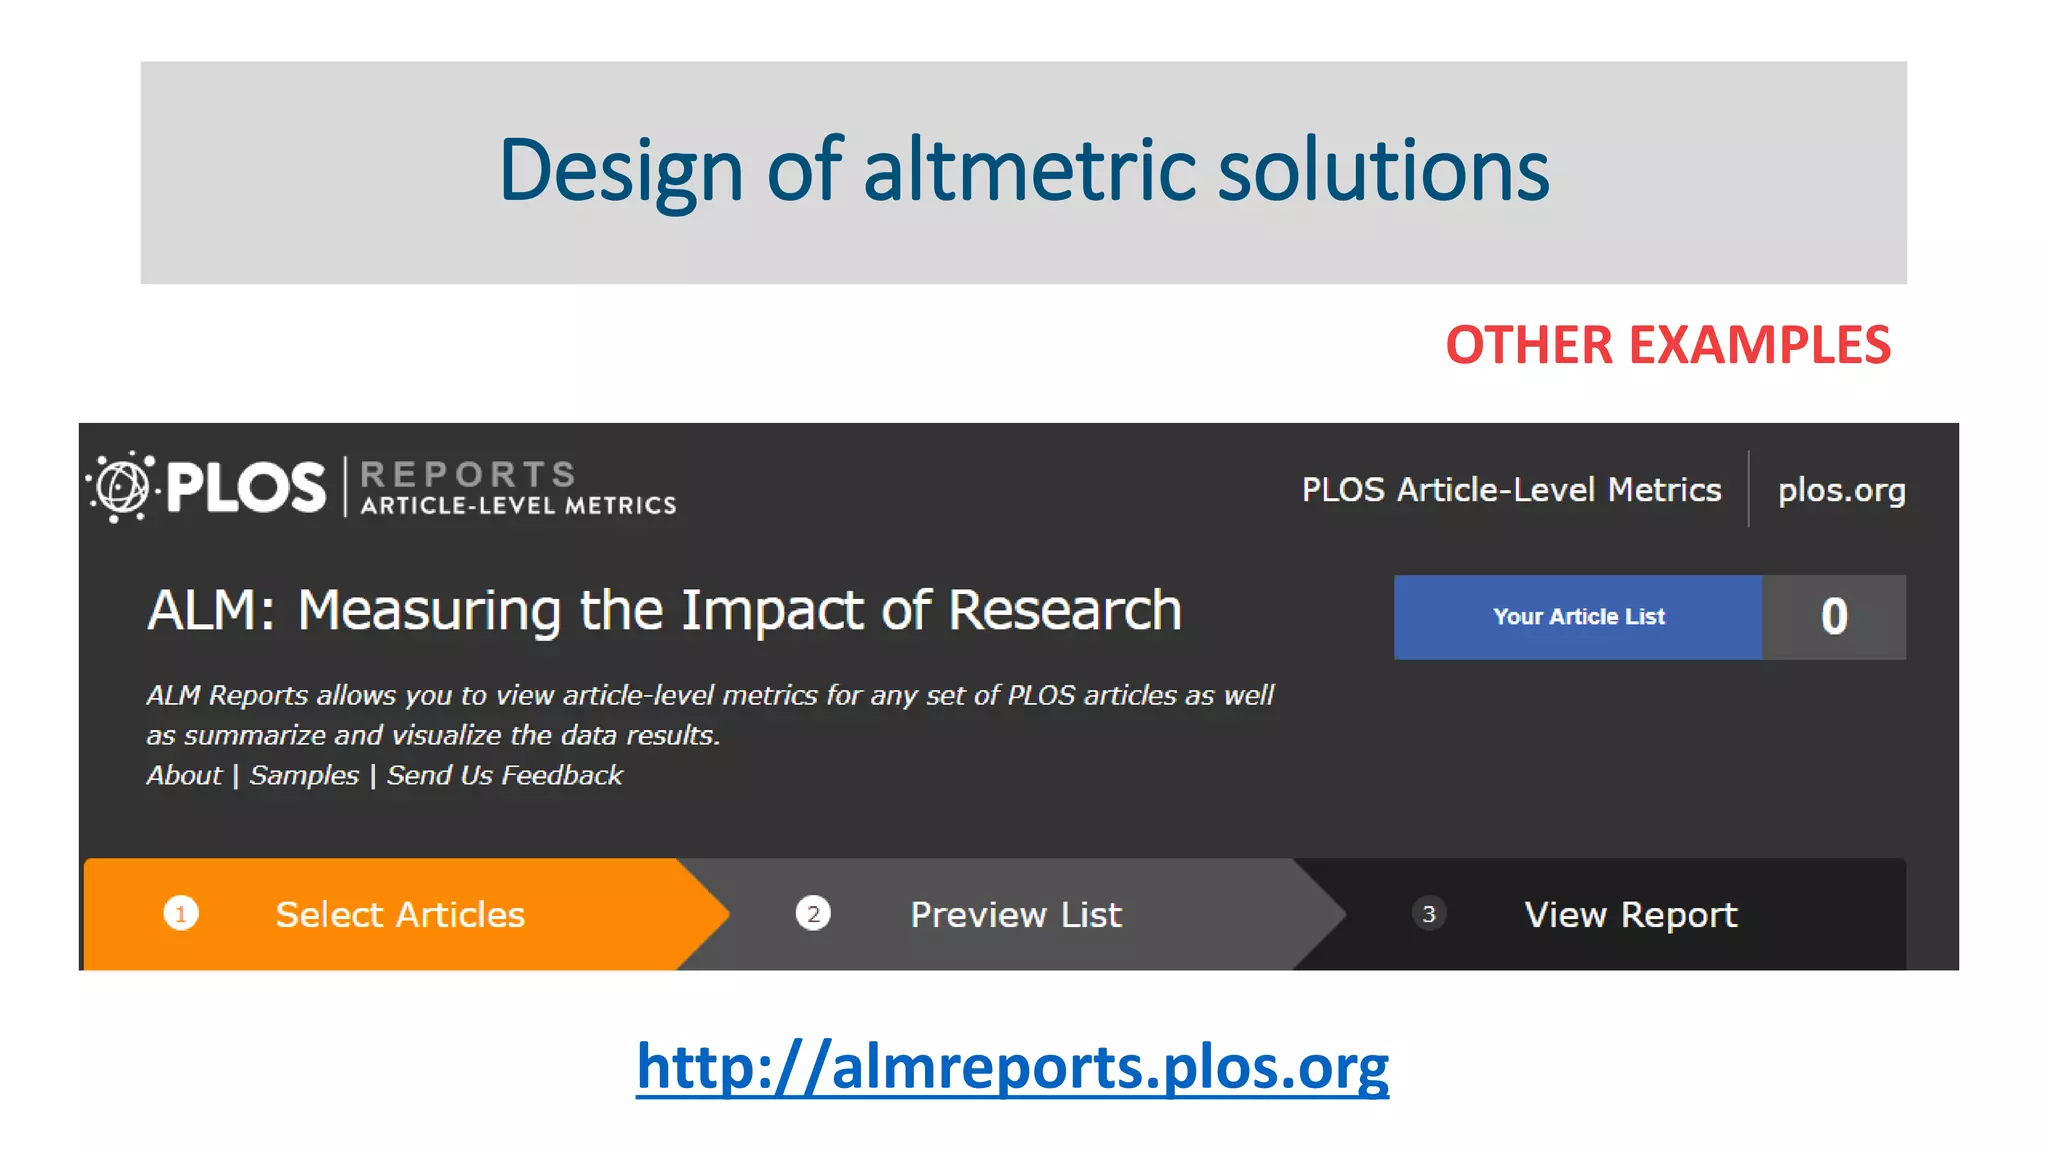
This document discusses practical applications of altmetrics data. It begins by outlining different altmetrics data providers and how they may provide differing results. It then discusses how to design altmetric solutions by selecting appropriate indicators and approaches based on goals and target audiences. Several examples are given of how altmetrics can be used for monitoring attention to research and evaluating impact through case studies and researcher profiling. Interpreting altmetrics data requires consideration of proxy alignment, changes in data collection, and errors.
Bibliometrics in practice: how to generate reports for institutions.Torres Salinas
In an institutional context and at a professional level, one of our main tasks is to carry out bibliometric reports; actually these studies are essential because they are used by managers to make decisions (distribution of funds, recruitment of personnel, planning of research lines, …). In this talk we will explain how to make a global bibliometric report of an institution, we use as a case study the University of Granada. We focus in these topics. 1) General considerations: target, selection of indicators, objetives, …) 2) what sources of information can be used. 3) How to contextualize and interpret the indicators. 4) How to compare the results with other institutions (Benchmarking). 5) How to make graphs and tables. 6) dissemination of results and data
Bibliometric solutions for identifying potential collaboratorsTorres Salinas
EC3metrics participa en la “European Summer School for Scientometrics” (ESSS) 2017 que tiene lugar en Berlín (Alemania) del 17 al 22 de septiembre de 2017. Este evento se viene celebrando anualmente desde 2010 y está organizado por la University of Vienna, el German Centre for Higher Education Research and Science Studies (DZHW alemán), la Katholieke Universiteit Leuven y EC3metrics, que desde 2017 es miembro del comité organizador. ESSS es una iniciativa que se creó en 2010 en respuesta a una falta de formación en cienciometría, -especialmente en los países de habla alemana- y por el aumento de esta demanda por parte de responsables políticos, directores, gestores de investigación, científicos, especialistas en información y bibliotecarios. Así, siguiendo el modelo de eventos anteriores, este año el tema del curso será “Identificación de focos de investigación. Perfiles institucionales y nacionales y colaboraciones estratégicas” (Identification of Research focuses. National & Institutional Profiles and Strategic Partnerships).
Daniel Torres-Salinas y Nicolás Robinson-García son miembros del comité organizador en representación de EC3metrics. Asimismo, participan como docentes. El próximo jueves 21 de septiembre, Nicolás Robinson-García y Daniel Torres-Salinas presentarán el seminario “Bibliometric solutions for identifying potential collaborators”.
Abstract: Bibliometric indicators and methodologies are commonly used for benchmarking institutions and individuals, and analyzing their research performance. Their potential for identifying partners and promoting collaboration is many times overseen by research institutions. In this presentation we will discuss different indicators and methodologies that can be used to spot institutions, research groups and individuals working on similar research fronts. By using different visualization techniques, we will provide examples on how to present these data in an appealing way which can inform university and research managers. These types of analyses are useful when searching for potential partners or designing strategies to establish scientific collaboration networks.
Bibliometrics in practice: how to generate reports for institutions - v2.0 / ...Torres Salinas
In an institutional context and at a professional level, one of our main tasks is to carry out bibliometric reports. These studies are essential because they are used by managers to make decisions (distribution of funds, recruitment of personnel, planning of research lines, etc.). In this talk we will explain how to make a global bibliometric report of an institution, we use as a case study the University of Granada. We focus on these topics: 1) General considerations: target, selection of indicators, objectives, etc.); 2) what sources of information can be used; 3) How to contextualize and interpret the indicators; 4) How to compare the results with other institutions (Benchmarking); 5) How to make graphs and tables; and 6) Dissemination of results and data.
Scientometric Mapping of Library and Information Science in Web of Science 8638812142
This is a presentation on Scientometric Study done in Library and Information Science Research as per the data downloaded from Web of Science. This is a presentation of MPhil dissertation submitted to Department of Library and Information Science, Mizoram University under Prof SN Singh.
Societal Impact
Nicolas Robinson Garcia, INGENIO (UPV-CSIC), Universitat Politècnica de València, Spain / Daniel Torres-Salinas, Universidad de Navarra and Universidad de Granada (EC3metrics & Medialab UGR), Spain
Recently there is an increasing pressure on the development of indicators and methodologies that can offer evidences of the societal impact of researchers’ activity. This presentation will offer a comprehensive overview on the definition of societal impact, types of impact, and the attribution problem when searching for potential indicators. A special attention will be given to altmetric indicators and their potential role in tracing social engagement and its relation with societal impact. Examples of potential uses and current lines of work will be presented.
***************************
Scientometric procedures are increasingly used to analyse developments and trends in science and technology. Decisions to be taken often have severe implications. Consequently data handling, indicator construction and interpretation require competent expert knowledge, which is currently only available to a limited extent for all stakeholders in Central Europe not the least due to lacking training opportunities. Responding to the lack of a pertinent scientometrics education (especially in German speaking countries) and to the increasing demand (particularly of research quality managers), the University of Vienna (A), the German Centre for Higher Education Research and Science Studies - DZHW (D) and the Katholieke Universiteit Leuven (B) joined cooperatively to found the European Summer School for Scientometrics (esss) in 2010.
Lecture presented by Marian Ramos Eclevia at PAARL's Summer Conference on the theme "Library Analytics: Data-driven Library Management", held at Pearl Hotel, Manila on 20-22 April 2016
Citation analysis: State of the art, good practices, and future developmentsLudo Waltman
Presentation at Bibliometrics & Research Assessment: A Symposium for Librarians & Information Professionals. Bethesda, MD, United States, October 31, 2016.
Digital Scholar Webinar: Recruiting Research Participants Online Using RedditSC CTSI at USC and CHLA
This 50-minute presentation introduces r/SampleSize, a community on the website Reddit that allows for online participant recruitment without compulsory or immediate payment. It will provide an overview of best practices for recruiting participants on r/SampleSize. It will also compare r/SampleSize to Amazon Mechanical Turk (MTurk), a widely used crowdsourcing platform for recruiting research participants.
Presented at the University of Canterbury Gradfest, "Where to publish" is a short presentation designed to help new postgraduate students think about new and non-traditional modes of publishing, such as Institutional and disciplinary repositories, the difference between gold and green Open Access, and other ways to make research more visible.
Comparing scientific performance across disciplines: Methodological and conce...Ludo Waltman
Presentation at the 7th International Conference on Information Technologies and Information Society (ITIS2015) in Novo Mestro, Slovenia on November 5, 2015.
Bibliometrische visualisaties voor het bijhouden van wetenschappelijke litera...Nees Jan van Eck
Het is van essentieel belang dat onderzoekers een actueel overzicht hebben van de literatuur in hun onderzoeksveld. Gegeven het enorme aantal publicaties dat wekelijks in wetenschappelijke tijdschriften verschijnt kan het bijhouden van alle relevante literatuur en het verkrijgen van een goed overzicht van een onderzoeksveld echter een uitdaging zijn en veel tijd kosten. Bibliometrische visualisaties ondersteunen deze taak. Dit soort visualisaties bieden een intuïtief overzicht van de relevante literatuur in een onderzoeksveld. Zo kunnen onderzoekers een beter inzicht krijgen in de structuur en de ontwikkeling van een veld en een indruk krijgen van de belangrijkste bijdragen in het veld.
By Sander Janssen, Research Team Leader of Earth Observation and Environmental Informatics at Alterra, Wageningen UR,
12 April 2017- 14:00 CET
--The webinar was held as part of ASIRA (Access to Scientific Information Resources in Agriculture) Online Course for Low-Income Countries--
This presentation focus on the political context of open data publishing, methodological frameworks for estimating the impacts of open data and highlight the Open Data Journal for Agricultural Research as publication channel for open data sets. It will also build on personal reflections on publishing open data from Dr. Janssen’s own research career.
For more on the topic: http://aims.fao.org/activity/blog/join-free-webinar-publishing-open-data-agricultural-research
Public engagement while you sleep? How altmetrics can help researchers broade...UoLResearchSupport
Slides from a seminar delivered for pepnet at the University of Leeds 28 Nov 2018. Thanks to Charlotte Perry-Houts for extra content:
From peer reviewed journal articles, to assorted reports and grey literature, to datasets comprising numerical, textual or multimedia files; we generate thousands of research outputs.
In this session, Kirsten Thompson (OD&PL) and Nick Sheppard (Library) will discuss strategies for increasing quality online engagement with that research. We will explore how you can use ‘alternative metrics’, more commonly known as ‘altmetrics’, to monitor such engagement. Altmetrics can help to showcase the reach of your work, supplement grant and tenure applications, identify new audiences, and connect with other researchers in your discipline.
In the age of “fake news”, academics have a responsibility to share their expertise beyond the Ivory Tower. We’ll show you how to ensure all these disparate outputs are properly curated in university repositories with a Digital Object Identifier (DOI). There will also be an opportunity to learn about and contribute to the Library led Data Management Engagement Award, a first-ever competition launched to elicit new and imaginative ideas for engaging researchers in the practices of good Research Data Management (RDM).
How altmetrics can help researchers broaden the reach of their work. Workshop facilitated by Kirsten Thompson and Nick Sheppard at the University of Leeds for the #PepnetLeeds network November 28th 2018.
How altmetrics can help researchers broaden the reach of their work
Slides from workshop to pepnet (Public Engagement network) at the University of Leeds on 28th November 2018
This presentation was provided by Chris Erdmann of Library Carpentries and by Judy Ruttenberg of ARL during the NISO virtual conference, Open Data Projects, held on Wednesday, June 13, 2018.
Presented at the “Science evaluation in the 21st century and its impact on scientific formation” session of the Biased Science and Alternatives for the Publication System Symposium - Rio de Janeiro, September 15 2014.
Assessing Digital Output in New Ways
Mike Taylor, Research Specialist, Elsevier Labs
Presented during NISO/BISG 8th Annual Changing Standards Landscape on June 27, 2014
Birgit Schmidt: RDA for Libraries from an International Perspectivedri_ireland
From "A National Approach to Open Research Data in Ireland", a workshop held on 8 September 2017 in National Library of Ireland, organised by The National Library of Ireland, the Digital Repository of Ireland, the Research Data Alliance and Open Research Ireland.
Trust and Accountability: experiences from the FAIRDOM Commons Initiative.Carole Goble
Presented at Digital Life 2018, Bergen, March 2018. In the Trust and Accountability session.
In recent years we have seen a change in expectations for the management and availability of all the outcomes of research (models, data, SOPs, software etc) and for greater transparency and reproduciblity in the method of research. The “FAIR” (Findable, Accessible, Interoperable, Reusable) Guiding Principles for stewardship [1] have proved to be an effective rallying-cry for community groups and for policy makers.
The FAIRDOM Initiative (FAIR Data Models Operations, http://www.fair-dom.org) supports Systems Biology research projects with their research data, methods and model management, with an emphasis on standards and sensitivity to asset sharing and credit anxiety. Our aim is a FAIR Research Commons that blends together the doing of research with the communication of research. The Platform has been installed by over 30 labs/projects and our public, centrally hosted FAIRDOMHub [2] supports the outcomes of 90+ projects. We are proud to support projects in Norway’s Digital Life programme.
2018 is our 10th anniversary. Over the past decade we learned a lot about trust between researchers, between researchers and platform developers and curators and between both these groups and funders. We have experienced the Tragedy of the Commons but also seen shifts in attitudes.
In this talk we will use our experiences in FAIRDOM to explore the political, economic, social and technical, social practicalities of Trust.
[1] Wilkinson et al (2016) The FAIR Guiding Principles for scientific data management and stewardship Scientific Data 3, doi:10.1038/sdata.2016.18
[2] Wolstencroft, et al (2016) FAIRDOMHub: a repository and collaboration environment for sharing systems biology research Nucleic Acids Research, 45(D1): D404-D407. DOI: 10.1093/nar/gkw1032
Reputation, impact, and the role of libraries in the world of open scienceKeith Webster
An overview of the relationship between open science, research assessment, university rankings, and the role of librarians in advancing the research university
FAIR for the future: embracing all things dataARDC
FAIR for the future: embracing all things data - Natasha Simons, Keith Russell and Liz Stokes, presented at Taylor & Francis Scholarly Summits in Sydney 11 Feb 2019 and Melbourne 14 Feb 2019.
Data ecosystems: turning data into public valueSlim Turki, Dr.
Africa Information Highway Live Exchange #Session 7
8 October 2021
The AIH Live Exchange between the Africa Information Highway Team, partners and countries is a free monthly webinar hosted by the African Development Bank to discuss topics related to government data and statistics. This webinar series is the main platform for countries to share their experiences and best practices around open data including using their Open Data Platform of the AIH.
This session is co-organized with the Luxembourg Institute of Science and Technology (LIST) which is a mission-driven Research and Technology Organization (RTO) that develops advanced technologies and delivers innovative products and services to industry and society. These innovations can also be used to solve several societal challenges, particularly in the areas of the environment, security, education and culture, sustainable development, as well as the efficient use of resources.
Official statistical data are recognized as high-value datasets for the society and economy, to enrich research, inform decision making or develop new products and services. The use of these authoritative data sources contributes to building a society with more empowered people, better policies, more effective and accountable decision-making, greater participation and stronger democratic mechanisms.
Official statistics are produced to be used and re-used to make an impact on society through a higher degree of openness and transparency while ensuring confidentiality and, at the same time, providing equal access to information to citizens.
The value of data lies in its use and re-use. In this interactive webinar, you will learn new techniques to improve the use and re-use of your statistical data, going beyond the provision logic and adopting the ecosystem mindset. You will:
● Sharpen your capacity at identifying and engaging users and re-users and stakeholders (data ecosystem mapping)?
● Effectively tackle technical and organizational barriers to stimulate data use and re-use?
● Smartly orchestrate a self-sustainable data ecosystem to increase the impact of statistical data.
This session is an opportunity for Regional members countries to '' Sharpen their skills in making data used and re-used by developing an ecosystem mindset to effectively build sustainable community of users around their Open Data Platform thus promoting transparency and better decision-making”
¿Cómo preparar y afrontar con éxito una estancia de investigación internacional?Nicolas Robinson-Garcia
Presentación para la jornada "MOTIVADxS I: un encuentro UGR para jóvenes investigadorxs" organizada por el Vicerrectorado de Investigación de la Universidad de Granada
Presentación impartida en la II Reunión de servicios de evaluación científica en los vicerrectorados de investigación celebrado el 31 de enero en la Universidad de Córdoba
Read| The latest issue of The Challenger is here! We are thrilled to announce that our school paper has qualified for the NATIONAL SCHOOLS PRESS CONFERENCE (NSPC) 2024. Thank you for your unwavering support and trust. Dive into the stories that made us stand out!
June 3, 2024 Anti-Semitism Letter Sent to MIT President Kornbluth and MIT Cor...Levi Shapiro
Letter from the Congress of the United States regarding Anti-Semitism sent June 3rd to MIT President Sally Kornbluth, MIT Corp Chair, Mark Gorenberg
Dear Dr. Kornbluth and Mr. Gorenberg,
The US House of Representatives is deeply concerned by ongoing and pervasive acts of antisemitic
harassment and intimidation at the Massachusetts Institute of Technology (MIT). Failing to act decisively to ensure a safe learning environment for all students would be a grave dereliction of your responsibilities as President of MIT and Chair of the MIT Corporation.
This Congress will not stand idly by and allow an environment hostile to Jewish students to persist. The House believes that your institution is in violation of Title VI of the Civil Rights Act, and the inability or
unwillingness to rectify this violation through action requires accountability.
Postsecondary education is a unique opportunity for students to learn and have their ideas and beliefs challenged. However, universities receiving hundreds of millions of federal funds annually have denied
students that opportunity and have been hijacked to become venues for the promotion of terrorism, antisemitic harassment and intimidation, unlawful encampments, and in some cases, assaults and riots.
The House of Representatives will not countenance the use of federal funds to indoctrinate students into hateful, antisemitic, anti-American supporters of terrorism. Investigations into campus antisemitism by the Committee on Education and the Workforce and the Committee on Ways and Means have been expanded into a Congress-wide probe across all relevant jurisdictions to address this national crisis. The undersigned Committees will conduct oversight into the use of federal funds at MIT and its learning environment under authorities granted to each Committee.
• The Committee on Education and the Workforce has been investigating your institution since December 7, 2023. The Committee has broad jurisdiction over postsecondary education, including its compliance with Title VI of the Civil Rights Act, campus safety concerns over disruptions to the learning environment, and the awarding of federal student aid under the Higher Education Act.
• The Committee on Oversight and Accountability is investigating the sources of funding and other support flowing to groups espousing pro-Hamas propaganda and engaged in antisemitic harassment and intimidation of students. The Committee on Oversight and Accountability is the principal oversight committee of the US House of Representatives and has broad authority to investigate “any matter” at “any time” under House Rule X.
• The Committee on Ways and Means has been investigating several universities since November 15, 2023, when the Committee held a hearing entitled From Ivory Towers to Dark Corners: Investigating the Nexus Between Antisemitism, Tax-Exempt Universities, and Terror Financing. The Committee followed the hearing with letters to those institutions on January 10, 202
Introduction to AI for Nonprofits with Tapp NetworkTechSoup
Dive into the world of AI! Experts Jon Hill and Tareq Monaur will guide you through AI's role in enhancing nonprofit websites and basic marketing strategies, making it easy to understand and apply.
Instructions for Submissions thorugh G- Classroom.pptxJheel Barad
This presentation provides a briefing on how to upload submissions and documents in Google Classroom. It was prepared as part of an orientation for new Sainik School in-service teacher trainees. As a training officer, my goal is to ensure that you are comfortable and proficient with this essential tool for managing assignments and fostering student engagement.
The French Revolution, which began in 1789, was a period of radical social and political upheaval in France. It marked the decline of absolute monarchies, the rise of secular and democratic republics, and the eventual rise of Napoleon Bonaparte. This revolutionary period is crucial in understanding the transition from feudalism to modernity in Europe.
For more information, visit-www.vavaclasses.com
Operation “Blue Star” is the only event in the history of Independent India where the state went into war with its own people. Even after about 40 years it is not clear if it was culmination of states anger over people of the region, a political game of power or start of dictatorial chapter in the democratic setup.
The people of Punjab felt alienated from main stream due to denial of their just demands during a long democratic struggle since independence. As it happen all over the word, it led to militant struggle with great loss of lives of military, police and civilian personnel. Killing of Indira Gandhi and massacre of innocent Sikhs in Delhi and other India cities was also associated with this movement.
Unit 8 - Information and Communication Technology (Paper I).pdfThiyagu K
This slides describes the basic concepts of ICT, basics of Email, Emerging Technology and Digital Initiatives in Education. This presentations aligns with the UGC Paper I syllabus.
2. Objectives
➢ Analyze differences by altmetric data provider and
consequences from using one or the other
➢ Discuss critically which information of interest can be
obtained from the different altmetrics
➢ Develop creative solutions to respond to current demands
making use of altmetric data
3. Agenda
I. The altmetric toolbox
➢ Indicators
➢ Data collection and processing
II. Design of altmetric solutions
➢ Demands that can/not be addressed
➢ Interpreting altmetrics
III. Altmetrics in practice
➢ Monitoring attention
➢ Supporting case studies
4. The altmetric toolbox
WHICH ALTMETRIC PROVIDER SHOULD WE USE?
• Altmetric providers cover a wide and heterogenenous set of
indicators
• This set of indicators varies by altmetric provider
• Altmetric providers offer differing results for same indicators
• These differences are due to the data collection process
5. The altmetric toolbox
“Altmetrics is the study and use of scholarly
impact measures based on activity in online
tools and environments”
Priem, Groth & Taraborelli, 2012
9. The altmetric toolbox
TYPES OF ALTMETRIC PROVIDERS
• ALL IN ONE
− Almetric.com ← SPRINGER NATURE
− PlumX Analytics ← ELSEVIER
− CrossRef Event Data
− Lagotto ← PLOS
• BY DATA SOURCE
− Mendeley ← ELSEVIER
− Twitter
− Facebook
− ResearchGate
10. The altmetric toolbox
Social media
• Twitter, Facebook, Google Plus… Tweets, retweets, likes, users
Reference managers
• Mendeley, Zotero, ReadCube… Bookmarks, collections, readers
Research blogging
• Publishers, institutional, personal… Mentions, comments, links
OA content
• PLOS journals, DataCite, Github… Downloads, comments, views
SOURCES INDICATORS
11. ALTMETRIC.COM
SOURCES AND INDICATORS
• Public policy documents
• Blogs
• Mainstream media
• Citations (web of science / scopus)
• Online reference managers (mendeley)
• Research highlights (F1000)
• Post-publication peer-review platforms (pubpeer, publons)
• Social Media (Facebook public pages, Twitter, Google+, LinkedIn, Sina,
Weibo and Pinterest)
• Open Syllabus Project
• Multimedia y otros (YouTube, Reddit y Q&A)
16. The altmetric toolbox
REASONS BEHIND THESE DIFFERENCES
• Data collection. Use of different APIs to access primary sources
• Aggregation and reporting. Differing strategies to identify mentions
and aggregating identifiers (i.e., DOIs, URLs)
• Data update. Update of data daily/weekly…
ALTMETRIC INDICATORS ARE UNSTABLE!!
Zahedi & Costas, 2018
19. Design of altmetric solutions
SOME CONSIDERATIONS
1. Goal
2. Altmetric sources ≈ Phenomenon analyzed
3. Selection of indicators
4. Selection of approach
20. Design of altmetric solutions
MONITORING
• The goal is to learn what is going
on
• Use of metrics should not ignore
uncertainty
• No direct consequences of its
results
• Superficial and exploratory
EVALUATING
• The goal is to assess if an
expected behavior/results is
taking place
• Altmetrics used as support to
other approaches
• Useful when combining with
qualitative analysis in case
studies
21. Design of altmetric solutions
INTERPRETING ALTMETRICS
CASE I. PROXY AND INDICATOR
ARE NOT ALIGNED
Twitter mentions as a proxy for
engagement with or consumption of
scientific literature
Robinson-Garcia et al., 2017
22. Design of altmetric solutions
INTERPRETING ALTMETRICS
CASE II. UNREPORTED CHANGES
IN ALTMETRIC PROVIDERS
Torres-Salinas, Robinson-Garcia & Gorraiz, Forthcoming
23. Design of altmetric solutions
INTERPRETING ALTMETRICS
CASE III. PROXY ALIGNED BUT
FOR ALL THE WRONG REASONS
Costas @ ESSS Granada 2016
24. Design of altmetric solutions
INTERPRETING ALTMETRICS
CASE IV. ERRORS IN DATA
RETRIEVAL
25. Design of altmetric solutions
INTERPRETING ALTMETRICS
CASE V. MANY FALSE NEGATIVES
Paper is not linked in the tweet
but news media covering the
paper, therefore, this mention
is not tracked
29. Design of altmetric solutions
APPROACHES
• Selection of data sources -> Primary sources vs. Aggregators
• Reporting -> Unidimensional vs. Relational visualizations
• Interpreting -> Numbers speak vs. Contextualization
34. Altmetrics in practice
EVALUATING
PROFILING SCHOLARS
HIGH SOC | HIGH SCI
D’Este, Ramos-Vielba &
Robinson-Garcia, 2018
Research area (topics) Nutrition and food science
(food technology, viticulture & enology,
Mediterranean-style diet)
Publication record 74 pubs – 46% Top 10% Highly cited
Altmetric record 63 pubs in social media – 21 policy briefs | 411
news | 186 blogs
Her work appears on scientific news (e.g.):
- Mediterranean diet
- Effects of cooking time of tomato sauce on health
35. Altmetrics in practice
EVALUATING
PROFILING SCHOLARS
Robinson-Garcia et al.,
2018
Public sector
NGO
Unknown
Academia
Private sector
Politicians
Social spheres of
interest of researchers
40. References
D’Este, P., Ramos-Vielba, I., Robinson-Garcia, N. Reconciling scientific impact and societal relevance: The role of pro-social motivation
and productive interactions. XVI Triple Helix Conference, Sept. 5-8, Manchester, United Kingdom
Priem, J., Groth, P., & Taraborelli, D. (2012). The Altmetrics Collection. PLOS ONE, 7(11), e48753.
https://doi.org/10.1371/journal.pone.0048753
Robinson-Garcia, N., van Leeuwen, T. N., & Rafols, I. (2018). Using Almetrics for Contextualised Mapping of Societal Impact: From Hits
to Networks. Science and Public Policy. https://doi.org/10.1093/scipol/scy024
Robinson-Garcia, N., Costas, R., Isett, K., Melkers, J., & Hicks, D. (2017). The unbearable emptiness of tweeting—About journal articles.
PLOS ONE, 12(8), e0183551. https://doi.org/10.1371/journal.pone.0183551
Torres-Salinas, D., Gumpenberger, C., & Gorraiz, J. (2017). PlumX As a Potential Tool to Assess the Macroscopic Multidimensional
Impact of Books. Frontiers in Research Metrics and Analytics, 2. https://doi.org/10.3389/frma.2017.00005
Torres-Salinas, D., Robinson-Garcia, N., & Gorraiz, J. (2017). Filling the citation gap: measuring the multidimensional impact of the
academic book at institutional level with PlumX. Scientometrics, 113(3), 1371–1384.
Torres-Salinas, D., Robinson-Garcia, N., & Jiménez-Contreras, E. (2016). Can we use altmetrics at the institutional level? A case study
analysing the coverage by research areas of four Spanish universities. In STI 2016 Conference: Peripheries, frontiers and beyond.
Valencia. Retrieved from http://arxiv.org/abs/1606.00232
Wouters, P., Zahedi, Z., & Costas, R. (2018). Social media metrics for new research evaluation. In W. Glänzel, H. F. Moed, U. Schmoch, &
M. Thelwall (Eds.), Handbook of Quantitative Science and Technology Research. Springer. Retrieved from
https://arxiv.org/abs/1806.10541
Zahedi, Z., & Costas, R. (2018). General discussion of data quality challenges in social media metrics: Extensive comparison of four
major altmetric data aggregators. PLOS ONE, 13(5), e0197326. https://doi.org/10.1371/journal.pone.0197326