Download to read offline
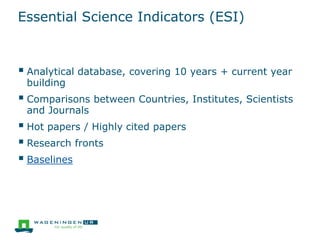
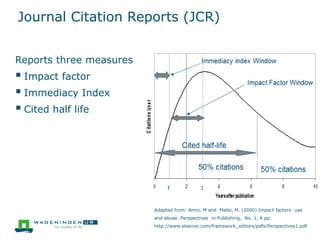
![Self citations
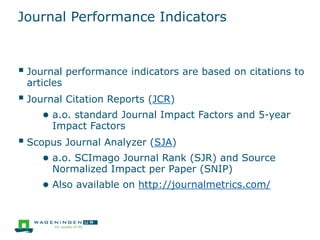
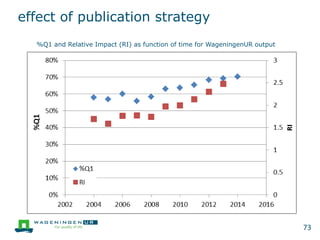
The model [...] implies that external citations are
enhanced by self-citations, so that we have the
“chain reaction:” Larger size leads to more self-
citations, which lead to more external citations.
van Raan, A. F. J. (2008). Self-citation as an impact-reinforcing mechanism in the
science system. Journal of the American Society for Information Science and
Technology 59(10): 1631-1643.](https://image.slidesharecdn.com/publishingandimpact20160216ef-160217102901/85/Publishing-and-impact-presentation-for-PhD-Infoirmation-Literacy-course-42-320.jpg)
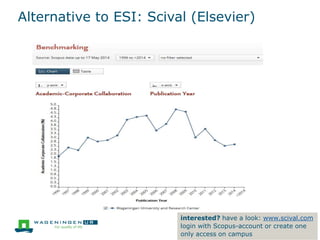


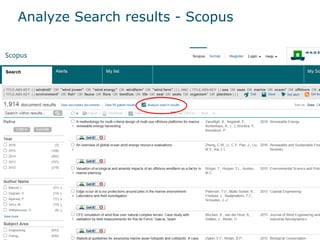
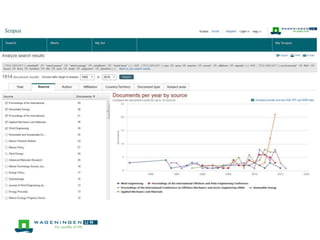
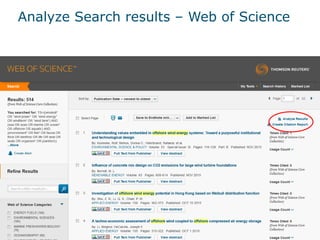
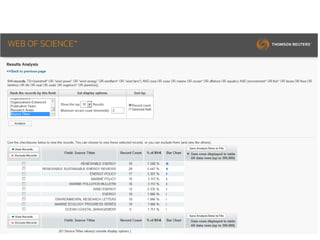
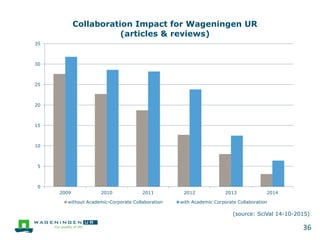
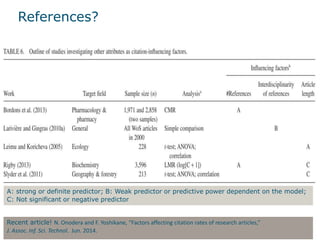
This document discusses tools and metrics for publishing and measuring research impact, including article, author, journal, and research group metrics. It covers analyzing search results to find interesting journals and researchers, using tools like Scopus and Web of Science. It also discusses choosing journals, open access, journal acceptance rates, coverage in databases, and networking to promote publications. Metrics covered include citations, impact factors, and Essential Science Indicators.


