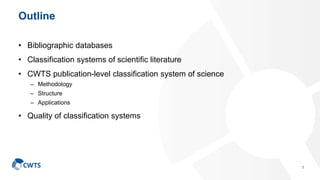
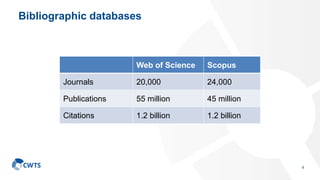
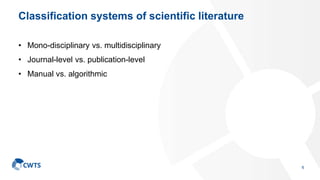
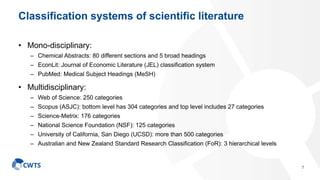
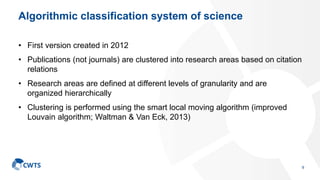
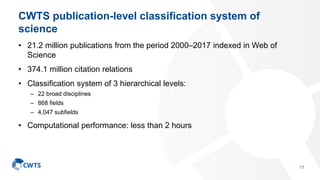
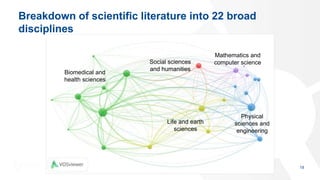
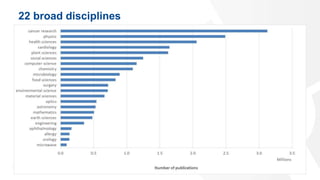
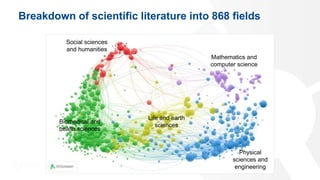
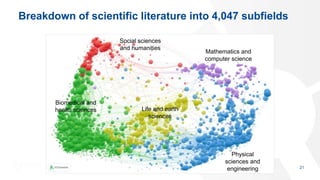
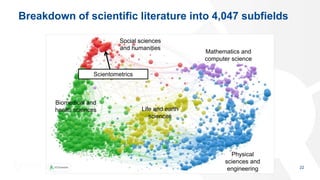
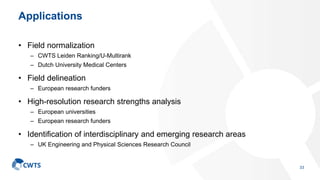
This document summarizes a presentation on scientometric approaches to classification. It discusses:
- Bibliographic databases like Web of Science and Scopus and their coverage.
- Types of classification systems for scientific literature including mono-disciplinary vs multidisciplinary and journal-level vs publication-level classifications.
- The CWTS publication-level classification system which uses a fully algorithmic approach to cluster over 21 million publications into a hierarchical structure of disciplines, fields, and subfields.
- Applications of the CWTS classification system including field normalization, field delineation, research strength analysis, and identification of interdisciplinary areas.
- Studies that have evaluated aspects of the quality and accuracy of classification systems.
Visual exploration of scientific literature using VOSviewer and CitNetExplorerNees Jan van Eck
Presentation at the International Conference on ICT enhanced Social Sciences and Humanities 2020, July 1, 2020.
It is essential for researchers to have an up-to-date understanding of the literature in their research field. However, keeping up with all relevant literature is highly time consuming. Bibliometric visualizations can support this task. These visualizations provide intuitive overviews of the literature in a research field, enabling researchers to obtain a better understanding of the structure and development of a field and to get an impression of the most significant contributions made in the field.
In this talk, I will give an introduction to two software tools for bibliometric visualization: VOSviewer (www.vosviewer.com) and CitNetExplorer (www.citnetexplorer.nl). VOSviewer is a popular tool for visualizing bibliometric networks of publications, authors, journals, and keywords. CitNetExplorer is a tool for the visualization and analysis of citation networks of scientific publications. I will pay special attention to applications of VOSviewer and CitNetExplorer in the social sciences and humanities, focusing in particular on the use of advanced text mining, network analysis, and visualization techniques for analyzing large amounts of textual data.
Presentation at the Data Science seminar at the Faculty of Social and Behavioural Sciences, Leiden University, Leiden, The Netherlands, December 7, 2018.
Accuracy of citation data in Web of Science and ScopusNees Jan van Eck
Presentation at the 16th International Conference on Scientometrics & Informetrics, Wuhan, China, October 19, 2017.
We present a large-scale analysis of the accuracy of citation data in the Web of Science and Scopus databases. The analysis is based on citations given in publications in Elsevier journals. We reveal significant data quality problems for both databases. Missing and incorrect references are important problems in Web of Science. Duplicate publications are a serious problem in Scopus.
Bibliometric network analysis: Software tools, techniques, and an analysis o...Nees Jan van Eck
Presentation at the LCN2 seminar on November 27, 2015.
We provide an introduction into the research program on bibliometric network analysis at Leiden University’s Centre for Science and Technology Studies (CWTS). We demonstrate two popular software tools for bibliometric network analysis developed at CWTS: VOSviewer (www.vosviewer.com) and CitNetExplorer (www.citnetexplorer.nl). We also discuss the techniques that we have developed for network layout and community detection. Finally, we use bibliometric network analysis to study the field of network science and the contributions made to this field by researchers at Leiden University.
Presentation at the Workshop on Open Citations, University of Bologna, Bologna, Italy, September 4, 2018.
I will demonstrate the use of the VOSviewer software (www.vosviewer.com), of which I am one of the developers, for creating bibliometric visualizations of science based on openly available bibliographic data sources. Both the use of Crossref data and the use of data from the OpenCitations Corpus will be demonstrated. In addition, I will show how data from Dimensions can be used. The possibilities and limitations of the currently available open data sources will be discussed, also in comparison with more established data sources such as Web of Science and Scopus. Finally, I will provide my perspective on future developments, focusing especially on the integration of open data sources and visual analysis tools.
Using full-text data to create improved term mapsNees Jan van Eck
Presentation at the 16th International Conference on Scientometrics & Informetrics, Wuhan, China, October 19, 2017.
A term map offers a visualization of a network of terms that co-occur in scientific publications. Term maps are usually created based on the titles and abstracts of publications. In this paper, we explore the use of full-text data for creating term maps. We create and compare a series of term maps based on the full text of publications in Journal of Informetrics. We use our results to discuss the advantages and disadvantages of different approaches for creating term maps.
Bibliometrische visualisaties voor het bijhouden van wetenschappelijke litera...Nees Jan van Eck
Het is van essentieel belang dat onderzoekers een actueel overzicht hebben van de literatuur in hun onderzoeksveld. Gegeven het enorme aantal publicaties dat wekelijks in wetenschappelijke tijdschriften verschijnt kan het bijhouden van alle relevante literatuur en het verkrijgen van een goed overzicht van een onderzoeksveld echter een uitdaging zijn en veel tijd kosten. Bibliometrische visualisaties ondersteunen deze taak. Dit soort visualisaties bieden een intuïtief overzicht van de relevante literatuur in een onderzoeksveld. Zo kunnen onderzoekers een beter inzicht krijgen in de structuur en de ontwikkeling van een veld en een indruk krijgen van de belangrijkste bijdragen in het veld.
This tutorial deals with two software tools: VOSviewer and CitNetExplorer. VOSviewer (www.vosviewer.com) is a freely available tool for constructing and visualizing bibliographic coupling, co-citation, co-authorship, and term co-occurrence networks. These networks can be constructed based on data downloaded from Web of Science or Scopus. CitNetExplorer (www.citnetexplorer.nl) is a freely available tool for analyzing and visualizing citation networks of publications.
The aim of the tutorial is to provide the participants with a basic knowledge of VOSviewer and CitNetExplorer. Given time constraints, it will not be possible to explore the two tools in a fully comprehensive way, but the tutorial will offer a thorough introduction into the most essential features of the tools. This should be sufficient for the participants to perform all basic analyses that can be done using VOSviewer and CitNetExplorer. In addition, it should allow the participants to independently explore the tools in more detail.
The lecturers are Nees Jan van Eck and Ludo Waltman, both affiliated to the Centre for Science and Technology Studies (CWTS) of Leiden University. Nees Jan and Ludo are the developers and VOSviewer and CitNetExplorer, and they therefore have an in-depth knowledge of both software tools. Nees Jan and Ludo regularly organize courses and workshops on VOSviewer and CitNetExplorer (see for instance www.cwts.nl/Bibliometric-Network-Analysis-and-Science-Mapping-Using-VOSviewer), so they have a lot of experience in training people in the use of these tools.
VOSviewer and CitNetExplorer: Software tools for bibliometric analysis of s...Nees Jan van Eck
In this talk, an introduction is given into two software tools that have been developed for bibliometric analysis of scientific publications: VOSviewer (www.vosviewer.com) and CitNetExplorer (www.citnetexplorer.nl). VOSviewer is a popular tool that can be used for visualizing bibliometric networks of citation relations between publications, authors, and journals. In addition, the tool can be used for creating so-called term map visualizations based on a text mining analysis of the titles and abstracts of publications. The most important terms occurring in titles and abstract are identified and the co-occurrence relations between these terms are visualized. CitNetExplorer is a tool for the visualization and analysis of citation networks of scientific publications. The tool can be used to explore in detail how publications build on each other, as indicated by citation links. It is also possible to drill down into specific areas within a citation network, making it possible to perform micro-level analyses of the development of a particular area of research. In this talk, special attention will be paid to possible applications of VOSviewer and CitNetExplorer in humanities research, focusing in particular on the use of advanced text mining, network analysis, and visualization techniques for analyzing large quantities of textual data.
Nees Jan van Eck is a researcher at the Centre for Science and Technology Studies (CWTS) of Leiden University. His research focuses on the quantitative analysis of scientific research based on large amounts of bibliographic data and using sophisticated techniques from fields such as network analysis, statistics, and machine learning. Together with his colleague Ludo Waltman, Nees Jan has developed the VOSviewer and CitNetExplorer tools.
Large-scale visualization of science: Methods, tools, and applicationsLudo Waltman
Presentation at the International Workshop on Data-driven Science Mapping, organized on the occasion of the 60th anniversary of the Department of Library and Information Science at Yonsei University. Seoul, South Korea, June 3, 2017.
Bibliometric visualization using VOSviewerLudo Waltman
Presentation at the workshop Research Output & Impact – New Tools and Concepts, organized at Technical University Denmark. Lyngby, Denmark, September 14, 2017.
Applications of community detection in bibliometric network analysisNees Jan van Eck
In this talk, we focus on the analysis of bibliometric networks, and in particular on the detection of communities in these networks. We start by demonstrating VOSviewer, a popular software tool for visualizing bibliometric networks. We discuss the techniques used by VOSviewer for visualizing bibliometric networks and for detecting communities in these networks. We pay special attention to the close relationship between visualization and community detection, and we discuss the unified approach to visualization and community detection that is implemented in VOSviewer. We then shift our attention to community detection in very large citation networks, including millions of publications and hundreds of millions of citation relations. We show how community detection techniques can be used to construct highly detailed classification systems of science. We also discuss applications of such classification systems to science policy questions. Finally, we demonstrate CitNetExplorer, a new software tool in which community detection techniques are used to support the large-scale analysis of citation networks. We use CitNetExplorer to analyze the citation network of publications on network science and in particular on community detection.
Crossref as a source of open bibliographic metadataNees Jan van Eck
Presentation at the 18th International Conference of the International Society for Scientometrics and Informetrics, July 12-15, 2021.
Several initiatives have been taken to promote the openly availability of bibliographic metadata of scholarly publications in Crossref. We present an up-to-date overview of the availability of six metadata elements in Crossref: reference lists, abstracts, ORCIDs, author affiliations, funding information, and license information. Our analysis shows that the availability of these metadata elements has improved over time. However, it also shows that many publishers need to make additional efforts to realize full openness of bibliographic metadata. To illustrate the value of open metadata, we use the metadata in Crossref to construct and visualize a large citation network of scholarly journals.
A systematic empirical comparison of different approaches for normalizing cit...Nees Jan van Eck
We address the question how citation-based bibliometric indicators can best be normalized to ensure fair comparisons between publications from different scientific fields and different years. In a systematic large-scale empirical analysis, we compare a traditional normalization approach based on a field classification system with three source normalization approaches. We pay special attention to the selection of the publications included in the analysis. Publications in national scientific journals, popular scientific magazines, and trade magazines are not included. Unlike earlier studies, we use algorithmically constructed classification systems to evaluate the different normalization approaches. Our analysis shows that a source normalization approach based on the recently introduced idea of fractional citation counting does not perform well. Two other source normalization approaches generally outperform the classification-system-based normalization approach that we study. Our analysis therefore offers considerable support for the use of source-normalized bibliometric indicators.
Comparing scientific performance across disciplines: Methodological and conce...Ludo Waltman
Presentation at the 7th International Conference on Information Technologies and Information Society (ITIS2015) in Novo Mestro, Slovenia on November 5, 2015.
Describes changes in scholarly publishing, and explains different options for open access. Tools for measuring journal impact such as Journal Citation Reports, SCImago and Ulrichsweb are highlighted and bibliometrics are described. Some altmetrics are considered
Presentation of a bibliometric Analysis of Quantum machine Learning.pptaliasgharahmadikia77
This is a presentation regarding our research paper titled: ” A Bibliometric Analysis of Quantum Machine Learning Research ” which was published by Taylor and Francis Group in the Science and Technology journal.
Broad altmetric analysis of Mendeley readerships through the ‘academic status...Zohreh Zahedi
This study explores the readerships in Mendeley across 5 major fields of science in Leiden Ranking 2013 for a data set of 1,107,917 Web of Science (WoS) publications (reviews and articles) from all disciplines published in 2011 with DOI available. The main objective is to know if there are different patterns in terms of readership and citation impact depending on the different ‘Academic Status’ of Mendeley readers. In case of finding different pattern, this could help to introduce the possibility of considering the different users as potential predicting elements of citations.
The current study is built upon the previous study of analyzing Mendeley users with focus on the types of the different Mendeley users (known users) in order to explore their patterns of saving publications in terms of subject fields, citation and readership impact. Particular attention has been paid to the extent to which the readerships of the publications saved by the different types of users in Mendeley correlate with their citation indicators and across 5 major fields of science in the Leiden Ranking (LR); also, the potential of identifying highly cited papers by different user types in Mendeley has been investigated. For this reason, we present an exploratory analysis of the patterns of reading of the different types of users in Mendeley and we study their relationship with citations and across LR fields.
Towards Automatic Classification of LOD DatasetsBlerina Spahiu
The datasets that are part of the Linking Open Data cloud
diagram (LOD cloud) are classified into the following topical
categories: media, government, publications, life sciences,
geographic, social networking, user-generated content,
and cross-domain. The topical categories were manually
assigned to the datasets. In this paper, we investigate to
which extent the topical classification of new LOD datasets
can be automated using machine learning techniques and the
existing annotations as supervision. We conducted experiments with different classification techniques and different feature sets. The best classification technique/feature set combination reaches an accuracy of 81.62% on the task of assigning one out of the eight classes to a given LOD dataset. A deeper inspection of the classification errors reveals problems with the manual classification of datasets in the current LOD cloud.
Presented at the 10th annual Data Harmony Users Group meeting on Tuesday, February 11, 2014 by Kevin Boyack of SciTech Strategies. Shows how a comprehensive map of the scientific literature was used to visualize the PLOS thesaurus. The resulting visualization becomes a new visual template that can be used to 1) examine the thesaurus structure, content, and level of detail; and 2) show coverage and trends for various entities such as journals, institutions, and even individual authors.
Determining cognitive distance between publication portfolios of evaluators a...Jakaria Rahman
When an expert panel evaluates research groups in a discipline specific research evaluation, it is an open question how one can determine the extent to which the panel members are able to evaluate the research groups. The expertise of the panel members should be well-matched with the research groups to ensure the quality and trustworthiness of the evaluation. Panel members who are credible experts in the field are most likely to provide valuable, relevant recommendations and suggestions that should lead to improved research quality. Due to absence of methods to determine the cognitive distance between evaluators and evaluees, this doctoral research leads to the development of informetric methods for expert panel composition. This contributes to the literature by proposing six informetric approaches to measure the match between evaluators and evaluees in a discipline specific research evaluation using their publications as a representation of their expertise.
The thesis is available at http://hdl.handle.net/10067/1481100151162165141
Visualizing science using VOSviewer based on Crossref, Microsoft Academic, an...Nees Jan van Eck
Tutorial at the Workshop on Open Citations: Opportunities and Ongoing Developments, ISSI2019 conference, Sapienza University, Rome, Italy, September 2, 2019.
To ensure that publications are assigned to clusters in a meaningful way, we introduce the notion of stable clusters. Essentially, a cluster is stable if it is insensitive to small changes in the underlying data. Bootstrapping is used to make small changes in the data. It is shown that if we want to have an accurate and detailed clustering, we need to be satisfied with a clustering that doesn’t comprehensively cover all publications. Publications that do not clearly belong to one of the main topics in a field cannot be assigned to a cluster.
Network visualization: Fine-tuning layout techniques for different types of n...Nees Jan van Eck
An important issue in network visualization is the problem of obtaining a good layout for a network. For a given network, which may be either weighted or unweighted, the problem is to position the nodes in the network in a two-dimensional space in such a way that an attractive layout is obtained. Many layout techniques have been proposed [1]. In the visualization of bibliometric networks, multidimensional scaling and the layout technique of Kamada and Kawai [2] have for instance been used a lot. More recently, the VOS (visualization of similarities) layout technique [3], implemented in our VOSviewer software (www.vosviewer.com) [4], is often used for bibliometric network visualization.
There is no layout technique that is generally considered to give optimal results. One reason for this is that comparisons between layouts produced by different techniques involve a lot of subjectiveness. Someone may consider one layout to be more attractive than another, but someone else may have an opposite opinion on this. In addition, the attractiveness of a layout may depend on the type of visualization that is needed. For instance, some layouts may be more attractive for interactive visualizations (e.g., in a software tool with zooming functionality), while other layouts may be more attractive for static visualizations. Furthermore, different types of networks may benefit from different layout techniques.
In recent studies [5, 6], the idea of parameterized layout techniques has been introduced. Parameterized layout techniques produce different types of layouts depending on the values chosen for their parameters. In this research, we present a comprehensive study of a parameterized version of our VOS layout technique. Two parameters are included. Like in [5], these are referred to as attraction and repulsion parameters. We compare the layouts obtained for different parameter values. Comparisons are made both subjectively using the VOSviewer software (i.e., which layout do we find most appealing?) and more objectively using so-called meta-criteria [6, 7]. Sensitivity to local optima is taken into account as well. Comparisons are made for all important types of bibliometric networks, in particular co-authorship, citation, co-citation, bibliographic coupling, and co-occurrence networks. Both smaller and larger networks are considered.
To ensure that publications are assigned to clusters in a meaningful way, we introduce the notion of stable clusters. Essentially, a cluster is stable if it is insensitive to small changes in the underlying data. Bootstrapping is used to make small changes in the data.
CWTS Leiden Ranking: An advanced bibliometric approach to university rankingNees Jan van Eck
The CWTS Leiden Ranking measures the scientific performance of 750 major universities worldwide. Using a sophisticated set of bibliometric indicators, the ranking aims to provide highly accurate measurements of the scientific impact of universities and of universities’ involvement in scientific collaboration. http://www.leidenranking.com
hematic appreciation test is a psychological assessment tool used to measure an individual's appreciation and understanding of specific themes or topics. This test helps to evaluate an individual's ability to connect different ideas and concepts within a given theme, as well as their overall comprehension and interpretation skills. The results of the test can provide valuable insights into an individual's cognitive abilities, creativity, and critical thinking skills
ESR spectroscopy in liquid food and beverages.pptxPRIYANKA PATEL
With increasing population, people need to rely on packaged food stuffs. Packaging of food materials requires the preservation of food. There are various methods for the treatment of food to preserve them and irradiation treatment of food is one of them. It is the most common and the most harmless method for the food preservation as it does not alter the necessary micronutrients of food materials. Although irradiated food doesn’t cause any harm to the human health but still the quality assessment of food is required to provide consumers with necessary information about the food. ESR spectroscopy is the most sophisticated way to investigate the quality of the food and the free radicals induced during the processing of the food. ESR spin trapping technique is useful for the detection of highly unstable radicals in the food. The antioxidant capability of liquid food and beverages in mainly performed by spin trapping technique.
ISI 2024: Application Form (Extended), Exam Date (Out), EligibilitySciAstra
The Indian Statistical Institute (ISI) has extended its application deadline for 2024 admissions to April 2. Known for its excellence in statistics and related fields, ISI offers a range of programs from Bachelor's to Junior Research Fellowships. The admission test is scheduled for May 12, 2024. Eligibility varies by program, generally requiring a background in Mathematics and English for undergraduate courses and specific degrees for postgraduate and research positions. Application fees are ₹1500 for male general category applicants and ₹1000 for females. Applications are open to Indian and OCI candidates.
Seminar of U.V. Spectroscopy by SAMIR PANDASAMIR PANDA
Spectroscopy is a branch of science dealing the study of interaction of electromagnetic radiation with matter.
Ultraviolet-visible spectroscopy refers to absorption spectroscopy or reflect spectroscopy in the UV-VIS spectral region.
Ultraviolet-visible spectroscopy is an analytical method that can measure the amount of light received by the analyte.
ANAMOLOUS SECONDARY GROWTH IN DICOT ROOTS.pptxRASHMI M G
Abnormal or anomalous secondary growth in plants. It defines secondary growth as an increase in plant girth due to vascular cambium or cork cambium. Anomalous secondary growth does not follow the normal pattern of a single vascular cambium producing xylem internally and phloem externally.
Earliest Galaxies in the JADES Origins Field: Luminosity Function and Cosmic ...Sérgio Sacani
We characterize the earliest galaxy population in the JADES Origins Field (JOF), the deepest
imaging field observed with JWST. We make use of the ancillary Hubble optical images (5 filters
spanning 0.4−0.9µm) and novel JWST images with 14 filters spanning 0.8−5µm, including 7 mediumband filters, and reaching total exposure times of up to 46 hours per filter. We combine all our data
at > 2.3µm to construct an ultradeep image, reaching as deep as ≈ 31.4 AB mag in the stack and
30.3-31.0 AB mag (5σ, r = 0.1” circular aperture) in individual filters. We measure photometric
redshifts and use robust selection criteria to identify a sample of eight galaxy candidates at redshifts
z = 11.5 − 15. These objects show compact half-light radii of R1/2 ∼ 50 − 200pc, stellar masses of
M⋆ ∼ 107−108M⊙, and star-formation rates of SFR ∼ 0.1−1 M⊙ yr−1
. Our search finds no candidates
at 15 < z < 20, placing upper limits at these redshifts. We develop a forward modeling approach to
infer the properties of the evolving luminosity function without binning in redshift or luminosity that
marginalizes over the photometric redshift uncertainty of our candidate galaxies and incorporates the
impact of non-detections. We find a z = 12 luminosity function in good agreement with prior results,
and that the luminosity function normalization and UV luminosity density decline by a factor of ∼ 2.5
from z = 12 to z = 14. We discuss the possible implications of our results in the context of theoretical
models for evolution of the dark matter halo mass function.
Comparing Evolved Extractive Text Summary Scores of Bidirectional Encoder Rep...University of Maribor
Slides from:
11th International Conference on Electrical, Electronics and Computer Engineering (IcETRAN), Niš, 3-6 June 2024
Track: Artificial Intelligence
https://www.etran.rs/2024/en/home-english/
This presentation explores a brief idea about the structural and functional attributes of nucleotides, the structure and function of genetic materials along with the impact of UV rays and pH upon them.
What is greenhouse gasses and how many gasses are there to affect the Earth.moosaasad1975
What are greenhouse gasses how they affect the earth and its environment what is the future of the environment and earth how the weather and the climate effects.
DERIVATION OF MODIFIED BERNOULLI EQUATION WITH VISCOUS EFFECTS AND TERMINAL V...Wasswaderrick3
In this book, we use conservation of energy techniques on a fluid element to derive the Modified Bernoulli equation of flow with viscous or friction effects. We derive the general equation of flow/ velocity and then from this we derive the Pouiselle flow equation, the transition flow equation and the turbulent flow equation. In the situations where there are no viscous effects , the equation reduces to the Bernoulli equation. From experimental results, we are able to include other terms in the Bernoulli equation. We also look at cases where pressure gradients exist. We use the Modified Bernoulli equation to derive equations of flow rate for pipes of different cross sectional areas connected together. We also extend our techniques of energy conservation to a sphere falling in a viscous medium under the effect of gravity. We demonstrate Stokes equation of terminal velocity and turbulent flow equation. We look at a way of calculating the time taken for a body to fall in a viscous medium. We also look at the general equation of terminal velocity.
1. Scientometric approaches to classification
Nees Jan van Eck
Centre for Science and Technology Studies (CWTS), Leiden University
Colloquium Research Information Systems and Science Classifications: Revisiting the NARCIS Classification
Museum Meermanno, The Hague, The Netherlands
September 28, 2018
2. Outline
• Bibliographic databases
• Classification systems of scientific literature
• CWTS publication-level classification system of science
– Methodology
– Structure
– Applications
• Quality of classification systems
1
7. Classification systems of scientific literature
• Mono-disciplinary vs. multidisciplinary
• Journal-level vs. publication-level
• Manual vs. algorithmic
6
8. Classification systems of scientific literature
• Mono-disciplinary:
– Chemical Abstracts: 80 different sections and 5 broad headings
– EconLit: Journal of Economic Literature (JEL) classification system
– PubMed: Medical Subject Headings (MeSH)
• Multidisciplinary:
– Web of Science: 250 categories
– Scopus (ASJC): bottom level has 304 categories and top level includes 27 categories
– Science-Metrix: 176 categories
– National Science Foundation (NSF): 125 categories
– University of California, San Diego (UCSD): more than 500 categories
– Australian and New Zealand Standard Research Classification (FoR): 3 hierarchical levels
7
10. Algorithmic classification system of science
• First version created in 2012
• Publications (not journals) are clustered into research areas based on citation
relations
• Research areas are defined at different levels of granularity and are
organized hierarchically
• Clustering is performed using the smart local moving algorithm (improved
Louvain algorithm; Waltman & Van Eck, 2013)
9
11. Objectives
To create a classification system
• in a fully algorithmic manner
• covering all sciences and social sciences
• at the level of individual publications
• with a hierarchical structure
• using transparent, freely available algorithms
• without excessive computational requirements
10
12. Main challenges
• Dealing with huge volumes of data
• Avoiding disciplinary biases
• Reaching a high level of accuracy
• Being flexible in terms of number of hierarchical levels and size of research
areas
• Obtaining proper labels for the research areas
• Keeping the methodology reasonably simple and transparent
11
13. Dealing with huge volumes of data
• Linking publications based on direct citations only; no co-citations,
bibliographic coupling, or word co-occurrences
• Efficient clustering algorithm based on ideas taken from:
– Newman (2004): Modularity-based clustering
– Blondel et al. (2008): ‘Louvain method’
– Waltman et al. (2010): VOS clustering technique
– Rotta & Noack (2011): Multilevel local search algorithms
12
14. Avoiding disciplinary biases
• cij: Relatedness of publications i and j, i.e., 1 if there is a direct citation
relation between i and j, 0 otherwise
• aij: Normalized relatedness of publications i and j, defined as
• Similar to fractional citation counting (Small & Sweeney, 1985)
k ik
ij
ij
c
c
a
13
15. Reaching a high level of accuracy
• Clustering technique based on maximization of a quality function:
• xi denotes the cluster (research area) to which publication i is assigned
• (xi, xj) = 1 if xi = xj and 0 otherwise
• r denotes a resolution parameter
• Quality function is maximized with respect to x1, ..., xn
i j
ijji raxx ))(,(
14
16. Being flexible in terms of number of hierarchical levels
and size of research areas
• Three types of parameters:
– Number of hierarchical levels
– Each level’s resolution parameter
– Each level’s minimum number of publications per research area
15
17. Obtaining proper labels for the research areas
1. Identification of terms in titles and abstracts of articles using part-of-speech
tagging
2. Calculation of term relevance scores based on a combination of a term’s
absolute and relative frequency of occurrence
3. Selection of the most relevant terms based on term relevance scores
combined with a filter for removing similar terms
16
18. CWTS publication-level classification system of
science
• 21.2 million publications from the period 2000–2017 indexed in Web of
Science
• 374.1 million citation relations
• Classification system of 3 hierarchical levels:
– 22 broad disciplines
– 868 fields
– 4,047 subfields
• Computational performance: less than 2 hours
17
19. 18
Breakdown of scientific literature into 22 broad
disciplines
Social sciences
and humanities
Biomedical and
health sciences
Life and earth
sciences
Mathematics and
computer science
Physical
sciences and
engineering
21. 20
Breakdown of scientific literature into 868 fields
Social sciences
and humanities
Biomedical and
health sciences
Life and earth
sciences
Mathematics and
computer science
Physical
sciences and
engineering
22. 21
Breakdown of scientific literature into 4,047 subfields
Social sciences
and humanities
Biomedical and
health sciences Life and earth
sciences
Mathematics and
computer science
Physical
sciences and
engineering
23. 22
Breakdown of scientific literature into 4,047 subfields
Social sciences
and humanities
Biomedical and
health sciences Life and earth
sciences
Mathematics and
computer science
Physical
sciences and
engineering
Scientometrics
24. Summary of scientometrics subfield
23
Cluster: 145
No. publications: 16,312
Top 5 terms No. pubs
bibliometric analysis 852
impact factor 495
h index 264
peer review 515
citation 642
Top 5 publications No. cits
hirsch, je (2005). an index to quantify an individual's scientific research output. p natl acad sci usa, 102(46), 16569-16572. 2,635
wuchty, s; et al. (2007). the increasing dominance of teams in production of knowledge. science, 316(5827), 1036-1039. 699
egghe, l (2006). theory and practise of the g-index. scientometrics, 69(1), 131-152. 609
king, da (2004). the scientific impact of nations. nature, 430(6997), 311-316. 496
newman, mej (2004). coauthorship networks and patterns of scientific collaboration. p natl acad sci usa, 101, 5200-5205. 488
Top 5 authors No. pubs Top 5 journals No. pubs
bornmann, l 221 scientometrics 2,865
thelwall, m 202 journal of informetrics 700
leydesdorff, l 175 journal of the american society for information science and technology 613
rousseau, r 161 plos one 339
egghe, l 133 research evaluation 324
Top 5 institutes No. pubs Top 5 departments No. pubs
univ granada 316 sch lib & informat sci (indiana univ) 106
kathol univ leuven 256 amsterdam sch commun res ascor (univ amsterdam) 97
leiden univ 249 ctr sci & technol studies (leiden univ) 90
indiana univ 246 sch publ policy (georgia inst technol - atlanta) 88
univ wolverhampton 216 trend res ctr (asia univ) 84
0
200
400
600
800
1,000
1,200
1,400
1,600
2000 2002 2004 2006 2008 2010 2012 2014 2016
No.publications
26. 25
Term map of scientometrics subfield
Peer review,
OA, careers,
and gender
CollaborationScientometric
indicators and
networks
Medical research
Country-level
analyses
29. Time trend
28
Social sciences
and humanities
Biomedical and
health sciences Life and earth
sciences
Mathematics and
computer science
Physical
sciences and
engineering
31. Summary of graphene subfield
30
Cluster: 9
No. publications: 27,771
Top 5 terms No. pubs
bilayer graphene 836
epitaxial graphene 491
silicene 401
graphene nanoribbon 1,035
graphene field effect transistor 207
Top 5 publications No. cits
novoselov, ks; et al. (2004). electric field effect in atomically thin carbon films. science, 306(5696), 666-669. 27,743
geim, ak; et al. (2007). the rise of graphene. nat mater, 6(3), 183-191. 20,073
novoselov, ks; et al. (2005). two-dimensional gas of massless dirac fermions in graphene. nature, 438(7065), 197-200. 11,359
castro neto, ah; et al. (2009). the electronic properties of graphene. rev mod phys, 81(1), 109-162. 11,368
zhang, yb; et al. (2005). experimental observation of the quantum hall effect and berry's phase in graphene. nature, 438(7065), 201-204. 8,110
Top 5 authors No. pubs Top 5 journals No. pubs
watanabe, k 249 physical review b 4,013
taniguchi, t 240 applied physics letters 1,834
peeters, fm 233 carbon 994
lin, mf 178 nano letters 906
katsnelson, mi 177 journal of applied physics 841
Top 5 institutes No. pubs Top 5 departments No. pubs
chinese acad sci 1,394 dept phys (natl univ singapore) 257
russian acad sci 778 inst phys (chinese acad sci) 226
peking univ 557 inst mol & mat (radboud univ nijmegen) 216
natl univ singapore 482 dept phys (mit) 209
tsing hua univ 458 dept phys (univ calif berkeley and berkeley national lab) 206
0
500
1,000
1,500
2,000
2,500
3,000
3,500
4,000
2000 2002 2004 2006 2008 2010 2012 2014 2016
No.publications
32. Open access
31
Social sciences
and humanities
Biomedical and
health sciences Life and earth
sciences
Mathematics and
computer science
Physical
sciences and
engineering
34. Applications
• Field normalization
– CWTS Leiden Ranking/U-Multirank
– Dutch University Medical Centers
• Field delineation
– European research funders
• High-resolution research strengths analysis
– European universities
– European research funders
• Identification of interdisciplinary and emerging research areas
– UK Engineering and Physical Sciences Research Council
33
35. Adopters and potential adopters
• Adopters:
– CWTS
– SciTech Strategies (e.g. SciVal)
– Royal School of Technology (KTH) Stockholm
• Potential adopters:
– Chinese Academy of Sciences
– European Research Council
– Max Planck
34
37. Empirical micro study using papers on overall water
splitting
• Haunschild et al. (2018)
• Case study comparing CWTS classification to
journal-based and manually constructed
classifications
• Ability of CWTS classification to distinguish
between fields is questioned
36
38. Accuracy of the journal classification systems of Web
of Science and Scopus
• Wang and Waltman (2016)
• Two criteria to identify journals with questionable
classifications:
– journals that have weak connections with their assigned
categories
– journals that are not assigned to categories with which they
have strong connections
• Web of Science performs significantly better than
Scopus
37
39. Field classification of publications in Dimensions
• Bornmann (2018)
• Field classification in Dimensions:
– Based on Fields of Research (FOR) from Australian and New
Zealand Standard Research Classification (ANZSRC)
– Machine learning approach
– Each publication is assigned to at least one field
• Based on Bornmann’s own publications
• Questions reliability and validity of Dimensions
classification
38
40. Response from Dimensions
• Herzog and Lunn (2018)
• Implementation at launch was first step and
requires improvements:
– Improvement of training sets
– Adding new subcategories to FOR system
39
41. Large-scale system to organize publications into
hierarchical concept structure
• Shen et al. (2018)
• Core component in Microsoft Academic
• Iterative approach to:
– concept discovery (Wikipedia)
– concept tagging to publications (both textual data and graph
structure are considered)
– concept hierarchy construction
• Based on 2000 initial seed concepts, over 228K
concepts have been identified
• Concepts are organized in six-level hierarchy
• 1 billion publication-concept relations
40
43. Conclusions
• Algorithmic approaches can be used to construct large-scale classifications
• Algorithmic classifications at the level of publications gain popularity
• Algorithmic possibilities depend on data availability
• Algorithmic classifications may have the disadvantage of mixing up different
principles for classifying items (e.g., research topic, research method,
scientific community, theoretical tradition, basic vs. applied)
42