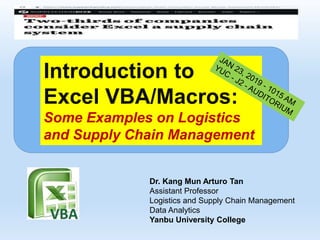
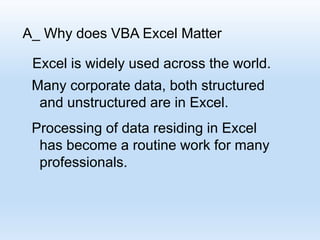
A macro is a series of functions written in a programming language that is grouped in a single command to perform the requested task automatically. Excel macros are used to save time and reduce the possibility of human error by automating repetitive processes.
Whether you are a senior manager, a project manager, a finance guy, a sales head, executive, marketing professional, operations or anyone who deals with numbers. We all need excel and we all have heard about MS Excel Macros. But most of us do not know how to write one or where to start from. This tutorial is a great starting point for quickly learning how to write your first Excel Macro so that you can get started on your own. So go ahead, check it out and have fun. Cheers.
Learn to anchor cells, move around Excel without a mouse, functions to summarize data, PivotTables, filters, sorting, charts, and macros in this course to take your Excel skills to the next level. Include information on functions: countif, sumif, vlookup, index, match, left, right, mid, len, trim, find, now, date, int
This is a slide deck I created for Mike Thomas as an introduction to his presentation for MacBites Learning - Excel Macro Magic. A video of the presentation is available from http://macbiteslearning.co.uk/excel-macro-magic-webinar-recording/
Online Advance Excel & VBA Training in Indiaibinstitute0
In today’s era, Investment banking courses are considered as the best path to make bright future. These courses includes financial modeling training, basic & advance excel training, excel dashboard 2010 course, financial modeling & company valuation training, relative valuation etc. Investment banking Institute (IBI) in Delhi provides such types of training of best level in weekend classes. IB Institute provides Online & corporate financial modeling & company valuation training in Delhi, India.
Just some excel courses. Have fun and learn from basic to advance, to develope strong skills in operating Excel.
Microsoft Office Excel was never so easy to understand like now!
May 11, 2013 for Trade School Manila
Is there an easy way to learn Macros for Excel? In this review, we tried to do it in 2 hours! Learn recording, and convert them into loops.
This PPT will tell you what and where marcros are needed and how to make them.
it will also talk about the little advanced macro to make your work simple
Dear students get fully solved assignments
Send your semester & Specialization name to our mail id :
“ help.mbaassignments@gmail.com ”
or
Call us at : 08263069601
(Prefer mailing. Call in emergency )
Learn VBA Training & Advance Excel Courses in Delhiibinstitute0
Investment Banking Institute (IBI) is the one of the most accepted & highly reputed institute of investment banking education which offers both online and corporate training of basic & advance excel 2010, financial modeling & company valuation, VBA training. Weekend classes of financial modeling & advance excel training in Delhi are provided by this reputed corporate banking institute to professionals & students at an outstanding level.
"Optimization of a .NET application- is it simple ! / ?", Yevhen TatarynovFwdays
Optimization of .NET application seems complex and tied full task, but don’t hurry up with conclusions. Let’s look on several cases from real projects.
For this we:
look under the hood of an application from a real project;
define the metric for optimization;
choose the necessary tools;
find bottlenecks /memory leaks and best practice to resolve them.
We'll improve the application step by step and we’ll what with simple analysis and simple best practice we can significantly reduce total resources usage.
These is presentation on the basic of Excel-VBA(Visual Basic Application). How to use some different functions of excel such as macros, solver, goal seek, subroutine, function, etc. With the use of Excel-VBA our work will be completed in short period of time.
Logistics Systems Design for the Yangtze River Delta Regionarttan2001
This presentation utilizes Hierarchical Cluster Analysis, Principal Component Analysis and Data Envelopment Analysis in the identification of clusters of provinces in the YRD Region in China.
This is a summary of Siegel's Predictive Analytics. The presentation encourages the reader to actively look at the capabilities of Predictive Analytics as a tool to make a forecast for one entity.
This is a talk about Big Data, focusing on its impact on all of us. It also encourages institution to take a close look on providing courses in this area.
This is a presentation on the use Ubuntu Linux for Education. It presents why we care about this topic, and we try to identify the proper positioning of Ubuntu Linux in an environment when the institution is not cost sensitive.
Techniques to optimize the pagerank algorithm usually fall in two categories. One is to try reducing the work per iteration, and the other is to try reducing the number of iterations. These goals are often at odds with one another. Skipping computation on vertices which have already converged has the potential to save iteration time. Skipping in-identical vertices, with the same in-links, helps reduce duplicate computations and thus could help reduce iteration time. Road networks often have chains which can be short-circuited before pagerank computation to improve performance. Final ranks of chain nodes can be easily calculated. This could reduce both the iteration time, and the number of iterations. If a graph has no dangling nodes, pagerank of each strongly connected component can be computed in topological order. This could help reduce the iteration time, no. of iterations, and also enable multi-iteration concurrency in pagerank computation. The combination of all of the above methods is the STICD algorithm. [sticd] For dynamic graphs, unchanged components whose ranks are unaffected can be skipped altogether.
Chatty Kathy - UNC Bootcamp Final Project Presentation - Final Version - 5.23...John Andrews
SlideShare Description for "Chatty Kathy - UNC Bootcamp Final Project Presentation"
Title: Chatty Kathy: Enhancing Physical Activity Among Older Adults
Description:
Discover how Chatty Kathy, an innovative project developed at the UNC Bootcamp, aims to tackle the challenge of low physical activity among older adults. Our AI-driven solution uses peer interaction to boost and sustain exercise levels, significantly improving health outcomes. This presentation covers our problem statement, the rationale behind Chatty Kathy, synthetic data and persona creation, model performance metrics, a visual demonstration of the project, and potential future developments. Join us for an insightful Q&A session to explore the potential of this groundbreaking project.
Project Team: Jay Requarth, Jana Avery, John Andrews, Dr. Dick Davis II, Nee Buntoum, Nam Yeongjin & Mat Nicholas
Data Centers - Striving Within A Narrow Range - Research Report - MCG - May 2...pchutichetpong
M Capital Group (“MCG”) expects to see demand and the changing evolution of supply, facilitated through institutional investment rotation out of offices and into work from home (“WFH”), while the ever-expanding need for data storage as global internet usage expands, with experts predicting 5.3 billion users by 2023. These market factors will be underpinned by technological changes, such as progressing cloud services and edge sites, allowing the industry to see strong expected annual growth of 13% over the next 4 years.
Whilst competitive headwinds remain, represented through the recent second bankruptcy filing of Sungard, which blames “COVID-19 and other macroeconomic trends including delayed customer spending decisions, insourcing and reductions in IT spending, energy inflation and reduction in demand for certain services”, the industry has seen key adjustments, where MCG believes that engineering cost management and technological innovation will be paramount to success.
MCG reports that the more favorable market conditions expected over the next few years, helped by the winding down of pandemic restrictions and a hybrid working environment will be driving market momentum forward. The continuous injection of capital by alternative investment firms, as well as the growing infrastructural investment from cloud service providers and social media companies, whose revenues are expected to grow over 3.6x larger by value in 2026, will likely help propel center provision and innovation. These factors paint a promising picture for the industry players that offset rising input costs and adapt to new technologies.
According to M Capital Group: “Specifically, the long-term cost-saving opportunities available from the rise of remote managing will likely aid value growth for the industry. Through margin optimization and further availability of capital for reinvestment, strong players will maintain their competitive foothold, while weaker players exit the market to balance supply and demand.”
Opendatabay - Open Data Marketplace.pptxOpendatabay
Opendatabay.com unlocks the power of data for everyone. Open Data Marketplace fosters a collaborative hub for data enthusiasts to explore, share, and contribute to a vast collection of datasets.
First ever open hub for data enthusiasts to collaborate and innovate. A platform to explore, share, and contribute to a vast collection of datasets. Through robust quality control and innovative technologies like blockchain verification, opendatabay ensures the authenticity and reliability of datasets, empowering users to make data-driven decisions with confidence. Leverage cutting-edge AI technologies to enhance the data exploration, analysis, and discovery experience.
From intelligent search and recommendations to automated data productisation and quotation, Opendatabay AI-driven features streamline the data workflow. Finding the data you need shouldn't be a complex. Opendatabay simplifies the data acquisition process with an intuitive interface and robust search tools. Effortlessly explore, discover, and access the data you need, allowing you to focus on extracting valuable insights. Opendatabay breaks new ground with a dedicated, AI-generated, synthetic datasets.
Leverage these privacy-preserving datasets for training and testing AI models without compromising sensitive information. Opendatabay prioritizes transparency by providing detailed metadata, provenance information, and usage guidelines for each dataset, ensuring users have a comprehensive understanding of the data they're working with. By leveraging a powerful combination of distributed ledger technology and rigorous third-party audits Opendatabay ensures the authenticity and reliability of every dataset. Security is at the core of Opendatabay. Marketplace implements stringent security measures, including encryption, access controls, and regular vulnerability assessments, to safeguard your data and protect your privacy.
Show drafts
volume_up
Empowering the Data Analytics Ecosystem: A Laser Focus on Value
The data analytics ecosystem thrives when every component functions at its peak, unlocking the true potential of data. Here's a laser focus on key areas for an empowered ecosystem:
1. Democratize Access, Not Data:
Granular Access Controls: Provide users with self-service tools tailored to their specific needs, preventing data overload and misuse.
Data Catalogs: Implement robust data catalogs for easy discovery and understanding of available data sources.
2. Foster Collaboration with Clear Roles:
Data Mesh Architecture: Break down data silos by creating a distributed data ownership model with clear ownership and responsibilities.
Collaborative Workspaces: Utilize interactive platforms where data scientists, analysts, and domain experts can work seamlessly together.
3. Leverage Advanced Analytics Strategically:
AI-powered Automation: Automate repetitive tasks like data cleaning and feature engineering, freeing up data talent for higher-level analysis.
Right-Tool Selection: Strategically choose the most effective advanced analytics techniques (e.g., AI, ML) based on specific business problems.
4. Prioritize Data Quality with Automation:
Automated Data Validation: Implement automated data quality checks to identify and rectify errors at the source, minimizing downstream issues.
Data Lineage Tracking: Track the flow of data throughout the ecosystem, ensuring transparency and facilitating root cause analysis for errors.
5. Cultivate a Data-Driven Mindset:
Metrics-Driven Performance Management: Align KPIs and performance metrics with data-driven insights to ensure actionable decision making.
Data Storytelling Workshops: Equip stakeholders with the skills to translate complex data findings into compelling narratives that drive action.
Benefits of a Precise Ecosystem:
Sharpened Focus: Precise access and clear roles ensure everyone works with the most relevant data, maximizing efficiency.
Actionable Insights: Strategic analytics and automated quality checks lead to more reliable and actionable data insights.
Continuous Improvement: Data-driven performance management fosters a culture of learning and continuous improvement.
Sustainable Growth: Empowered by data, organizations can make informed decisions to drive sustainable growth and innovation.
By focusing on these precise actions, organizations can create an empowered data analytics ecosystem that delivers real value by driving data-driven decisions and maximizing the return on their data investment.
1. Introduction to
Excel VBA/Macros:
Some Examples on Logistics
and Supply Chain Management
Dr. Kang Mun Arturo Tan
Assistant Professor
Logistics and Supply Chain Management
Data Analytics
Yanbu University College
2. General Outline
A_Why does Excel VBA matter?
B_ What is VBA?
C_ How do we start with VBA?
D_ Recording some macros.
E_ Running the macros.
F_ Functions and Sub_Routines.
G_ The User Form.
slideNo3
Thanks
COVER
4. A_ Why does VBA Excel Matter
Excel is widely used across the world.
5. A_ Why does VBA Excel Matter
Excel is widely used across the world.
Many corporate data, both structured
and unstructured are in Excel.
6. A_ Why does VBA Excel Matter
Excel is widely used across the world.
Many corporate data, both structured
and unstructured are in Excel.
Processing of data residing in Excel
has become a routine work for many
professionals.
7. A_ Why does VBA Excel Matter
Excel is widely used across the world.
Many corporate data, both structured
and unstructured are in Excel.
Processing of data residing in Excel
has become a routine work for many
professionals.
Automating this work could be an added
advantage for the students who are
entering the workforce.
BackToTOC
8. B_ What is VBA
VBA stands for Visual Basic for
Application.
It is very similar to Visual Basic
in form and structure.
It works with Excel, Word, Access,
Powerpoint and Outlook.
9. Theory:
For Excel, it deals with Excel Object Model.
Object, intuitively, is like an XLNoid – a robot.
Method is a call to action.
Property is a data stored in that data basket, with
the XLNoid constantly checking, and deciding
if an action is needed.
35. F_ Functions and Sub Routines
Cell
To Fill Up a Cell with a Value
To Fill Up a Cell with a Formula
To Read a Cell’s Value
36. F_ Functions and Sub Routines
BegInvy + Receipts – Issuances
= EndInvy
As a function:
As a subprocedure:
Demo for
Coding
of
Sub proc
and
Functions
Tan_FA_Slide
37. F_ Functions and Sub Routines
EoQ = Sqrt (2 DS / H )
D = Demand for a Year
S = Cost for each Ordering
H = Holding Cost per Item per Year
Demo for Preparing
A report
BackToTOC
BackToF
Tan_FA_Slide
38. Fc1_ General Example
Option Explicit
Sub MyMacroGetMax()
Dim q As Variant
Dim x(100) As Integer
Dim i As Integer, nPtr As Integer
Dim Start As Integer, Last As Integer, Num As Integer
Dim AssumedHeaviest, Heaviest As Integer
' Defining the array
q = Array(7, 2, 3, 20, 15, 6, 35, 12, 9, 5, 18, 23, _
9, 16, 22, 10)
Demo for Straight Coding
Tan_FC_Slide
39. Fc2_ General Example
Start = LBound(q)
MsgBox "StartBoxNo is " & Start
Last = UBound(q)
MsgBox "LastBoxNo is " & Last
Num = Last - Start + 1
MsgBox "BoxCount is " & Num
' = = == = = = = = =
' transferring the content of container q to container x.
‘ container x is a temporary place for comparison.
' ========= = = = = =
For i = Start To Last
x(i) = q(i)
Next i
' = = = = = = = = = = =
40. Fc3_ General Example
' = =
' assume the first box to be the heaviest.
' = = =
AssumedHeaviest = x(Start) ‘// Start means the first box
' = = = =
For nPtr = Start + 1 To Last ‘// Start+1 means the second box
If x(nPtr) > AssumedHeaviest Then
AssumedHeaviest = x(nPtr)
End If
Next nPtr
Heaviest = AssumedHeaviest
MsgBox "Heaviest is " & Heaviest
End Sub
BackToTOC
BackToFc