Download as PDF, PPTX
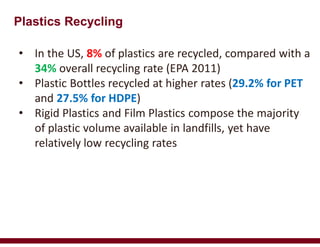

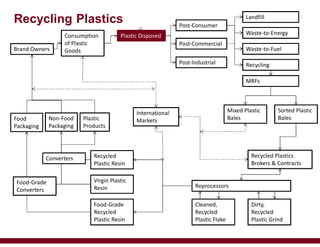
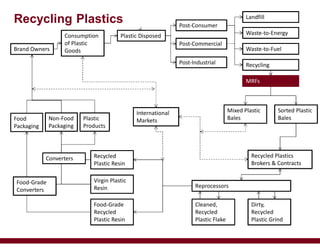
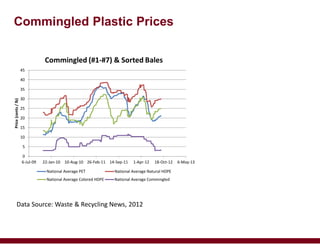

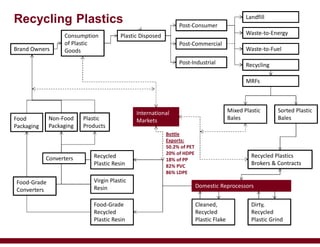
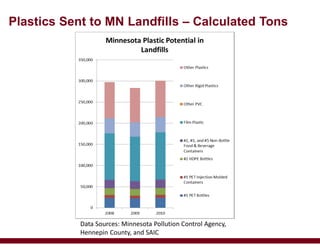
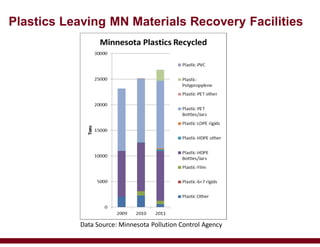

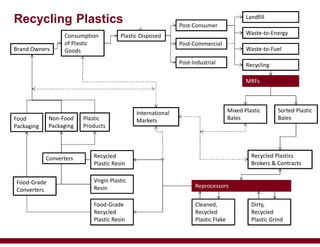

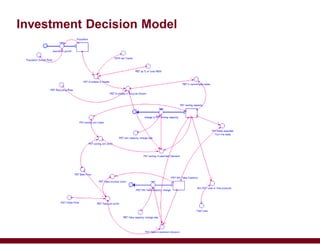
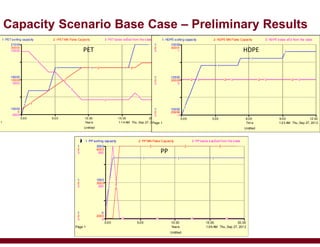
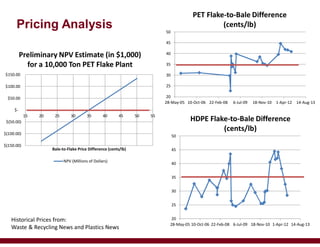
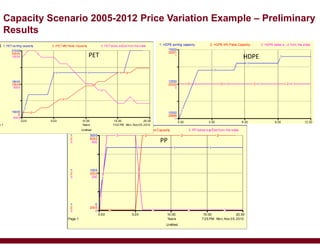
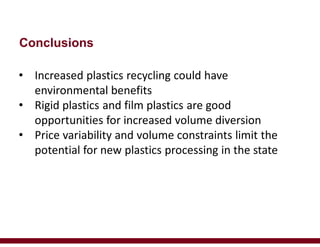


This document summarizes a presentation on system dynamics modeling of plastics recycling scenarios. It finds that increased plastics recycling could provide environmental benefits but price variability and volume constraints limit potential for new plastics processing in Minnesota. Rigid plastics and film plastics represent good opportunities for higher diversion from landfills. The presentation included system diagrams, data on plastics recycling rates and prices, and preliminary results from recycling capacity scenarios modeling changes over time.


