Download as PDF, PPTX


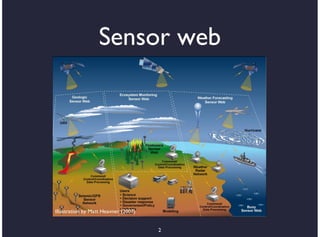
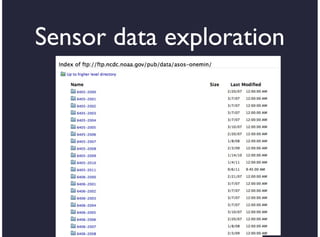
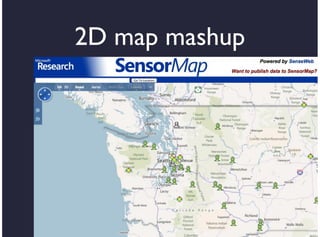
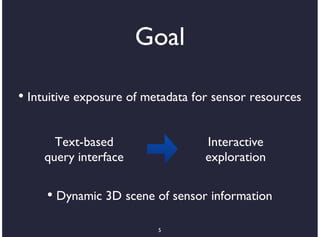
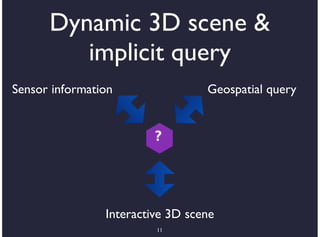
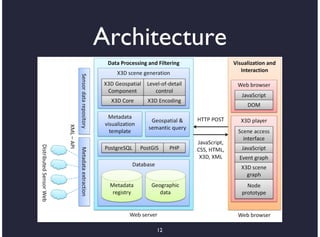
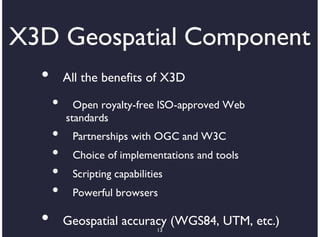
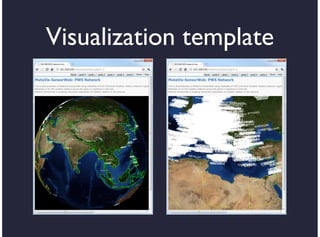
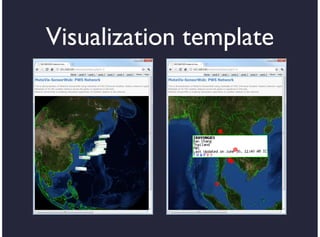
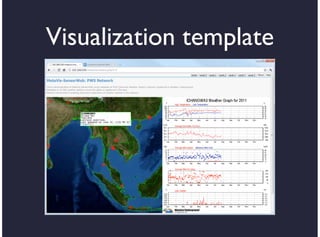
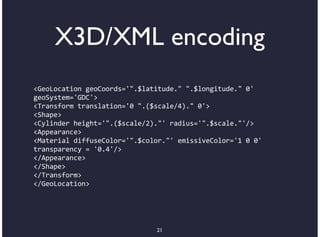
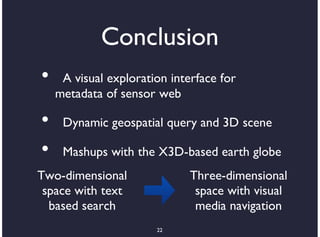
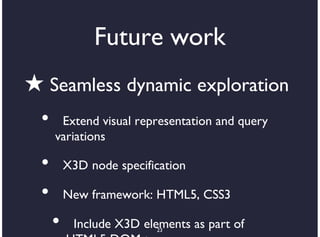

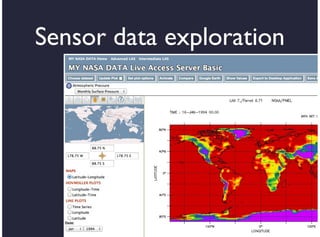
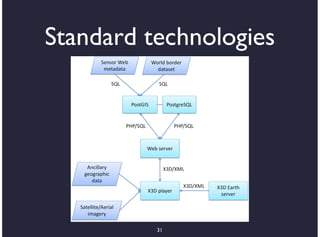
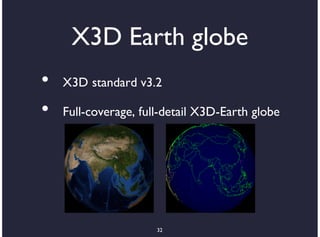
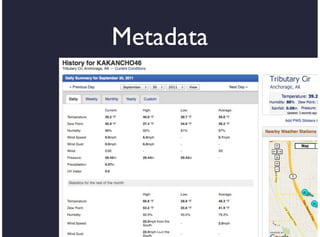

The document discusses the visualization and metadata exploration of sensor web data, emphasizing the creation of dynamic 3D scenes for intuitive interaction with sensor resources. It highlights the use of open standards like X3D for geographic information representation and the integration of various technologies for effective data handling. Future work aims to enhance visual capabilities and exploration methodologies within a framework that includes advanced web technologies.


