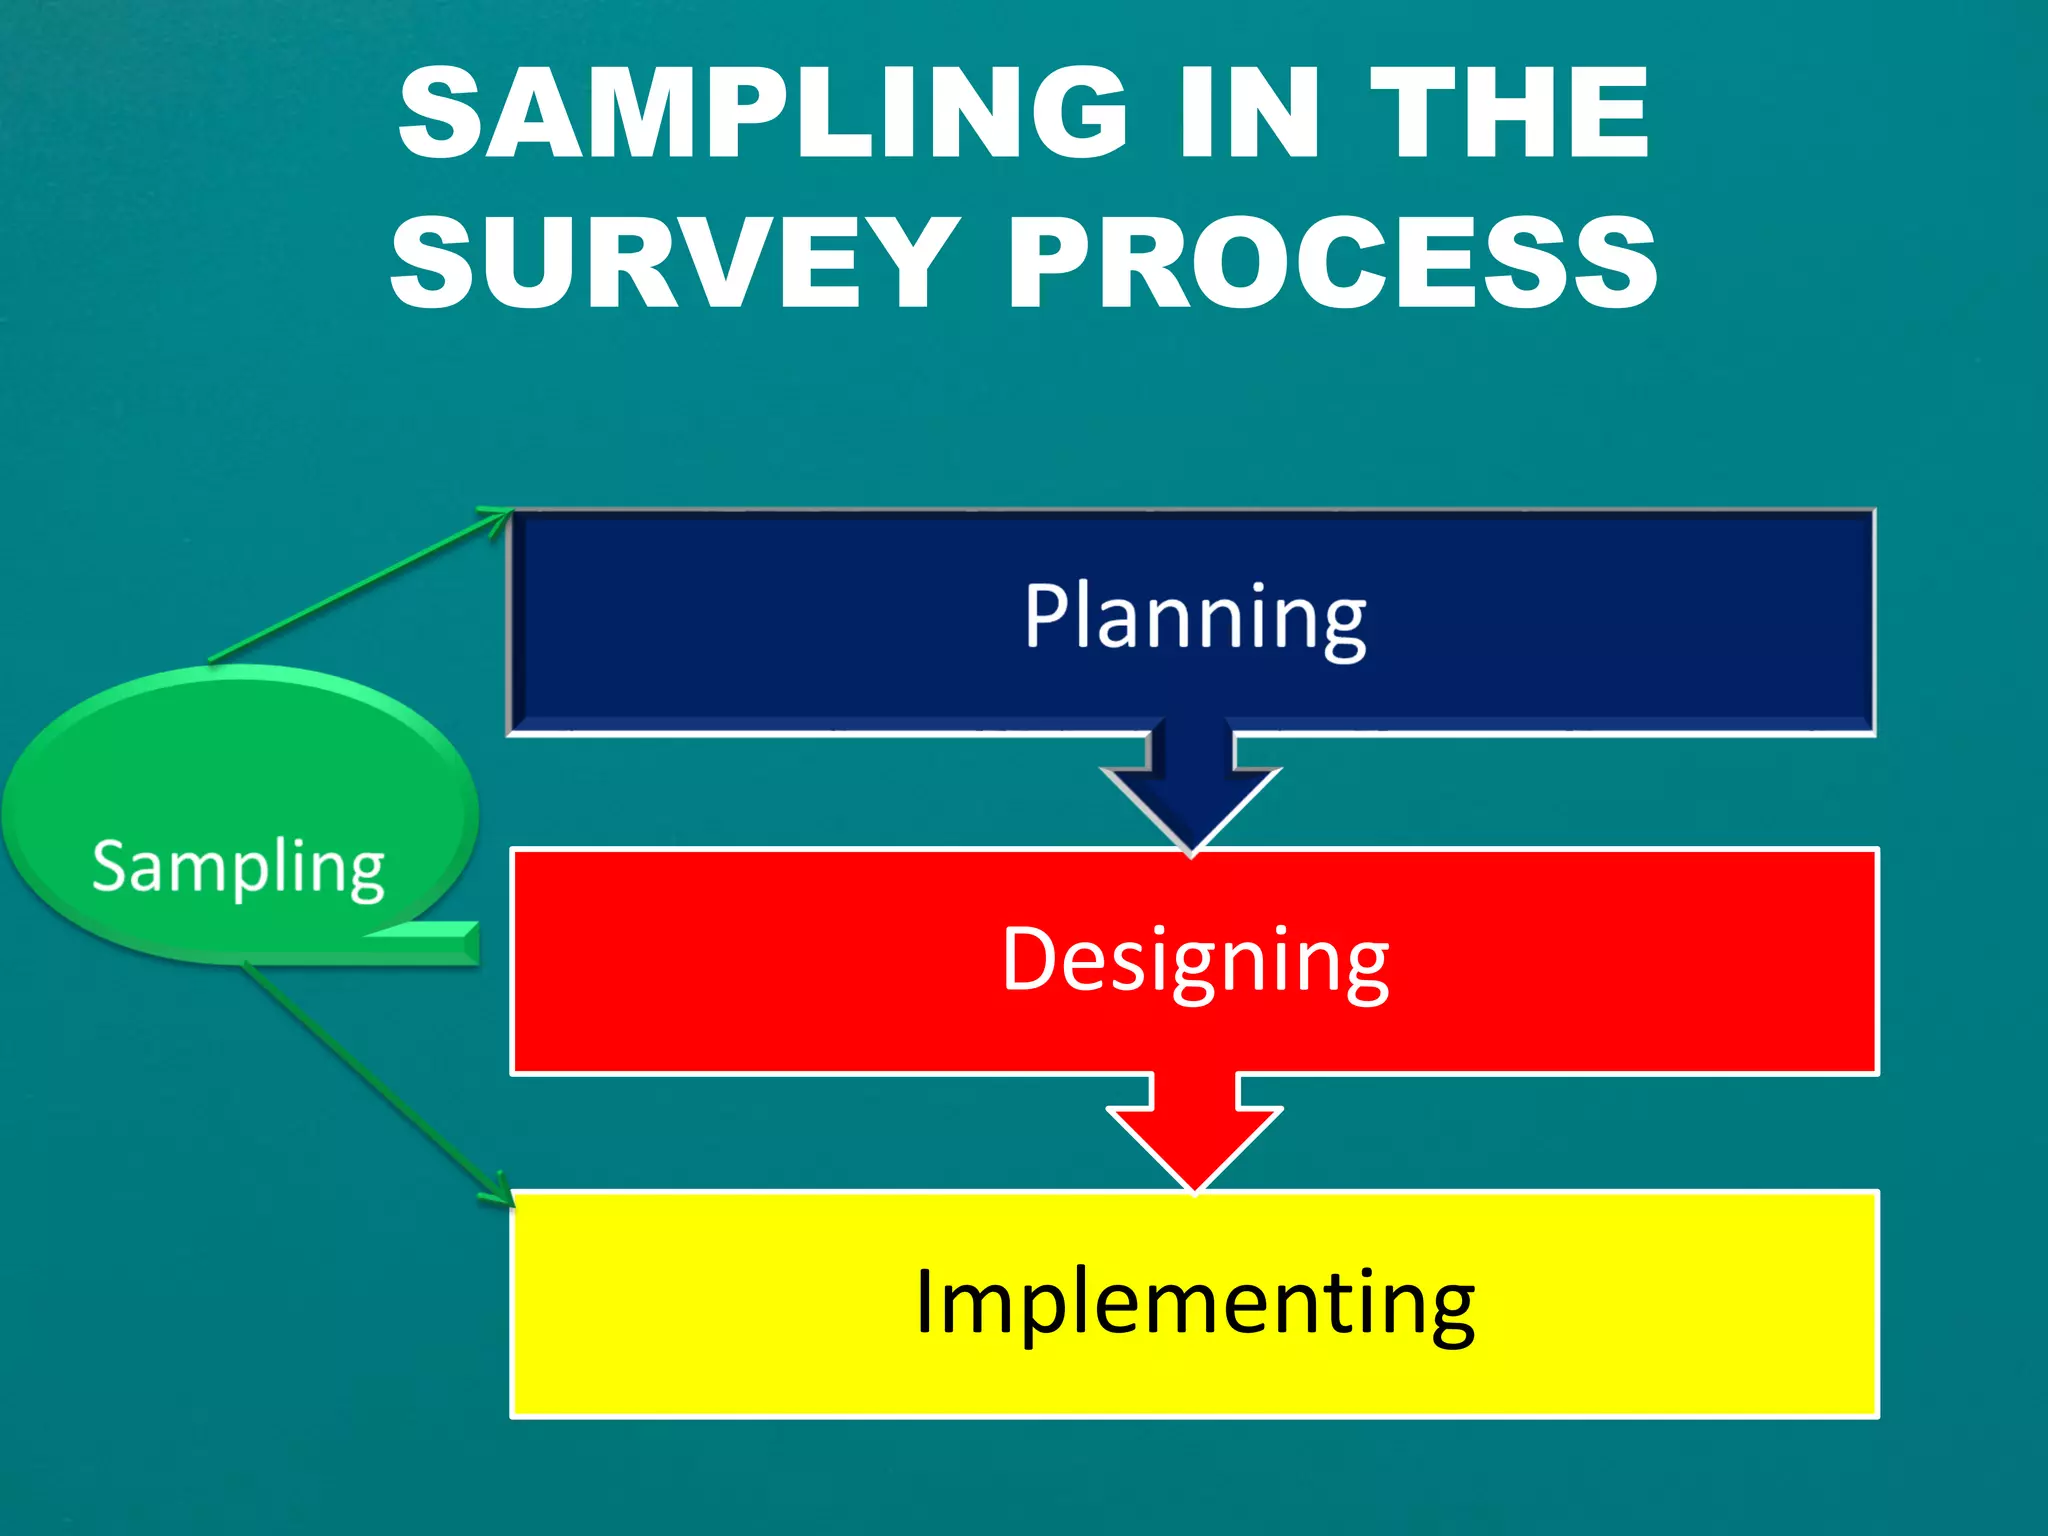
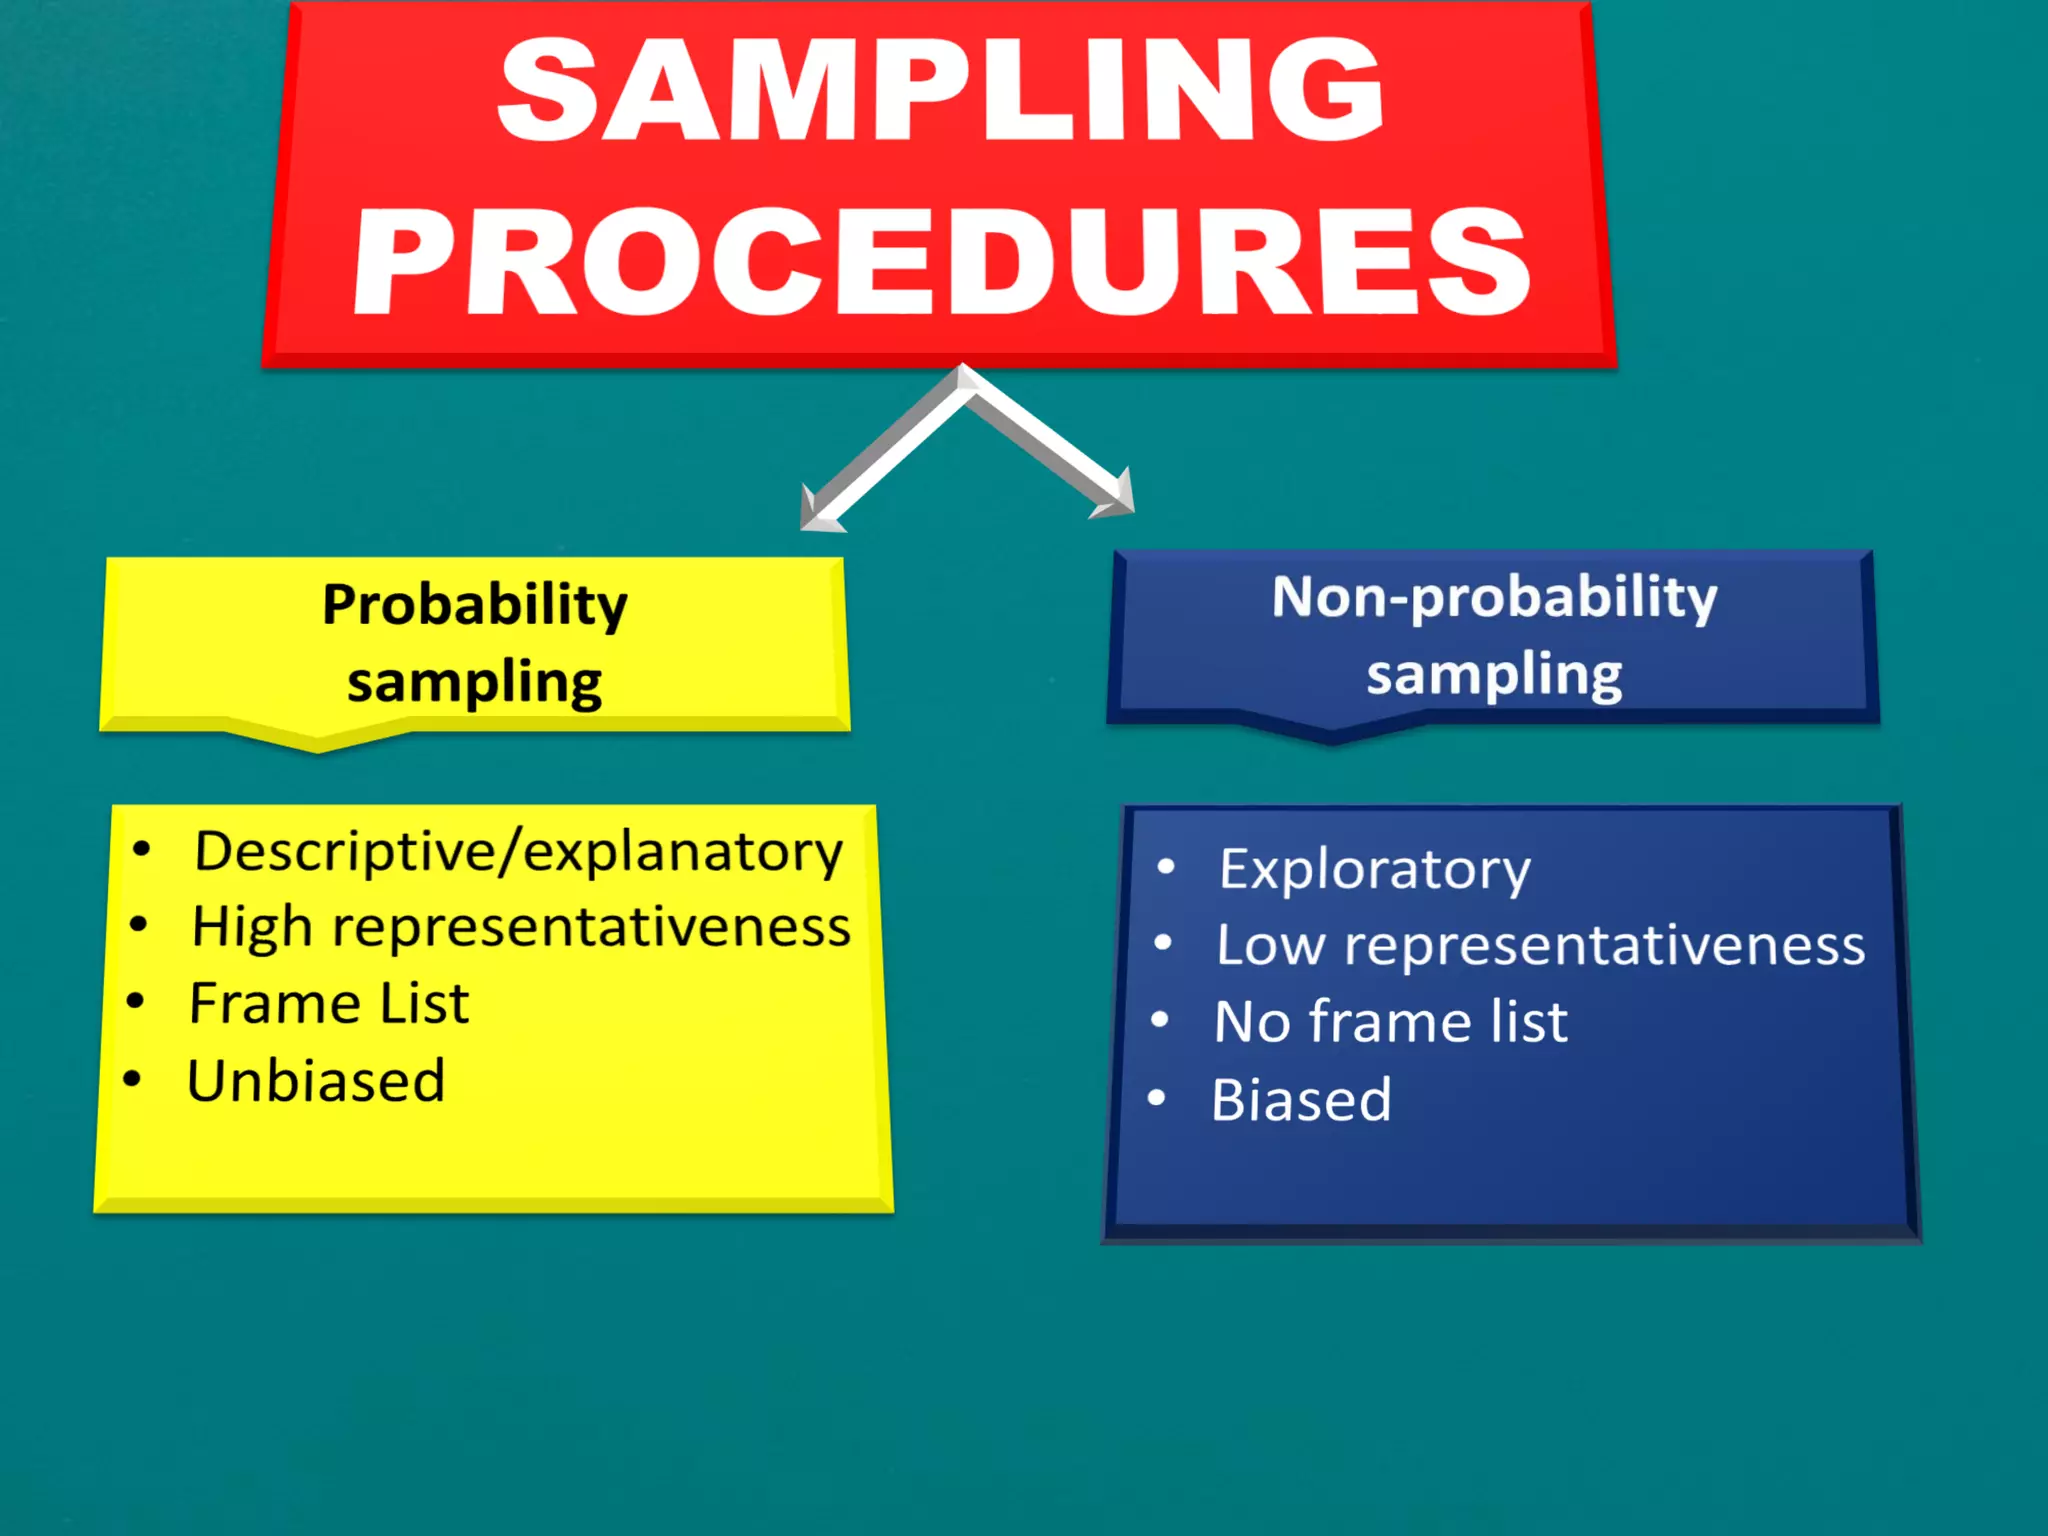
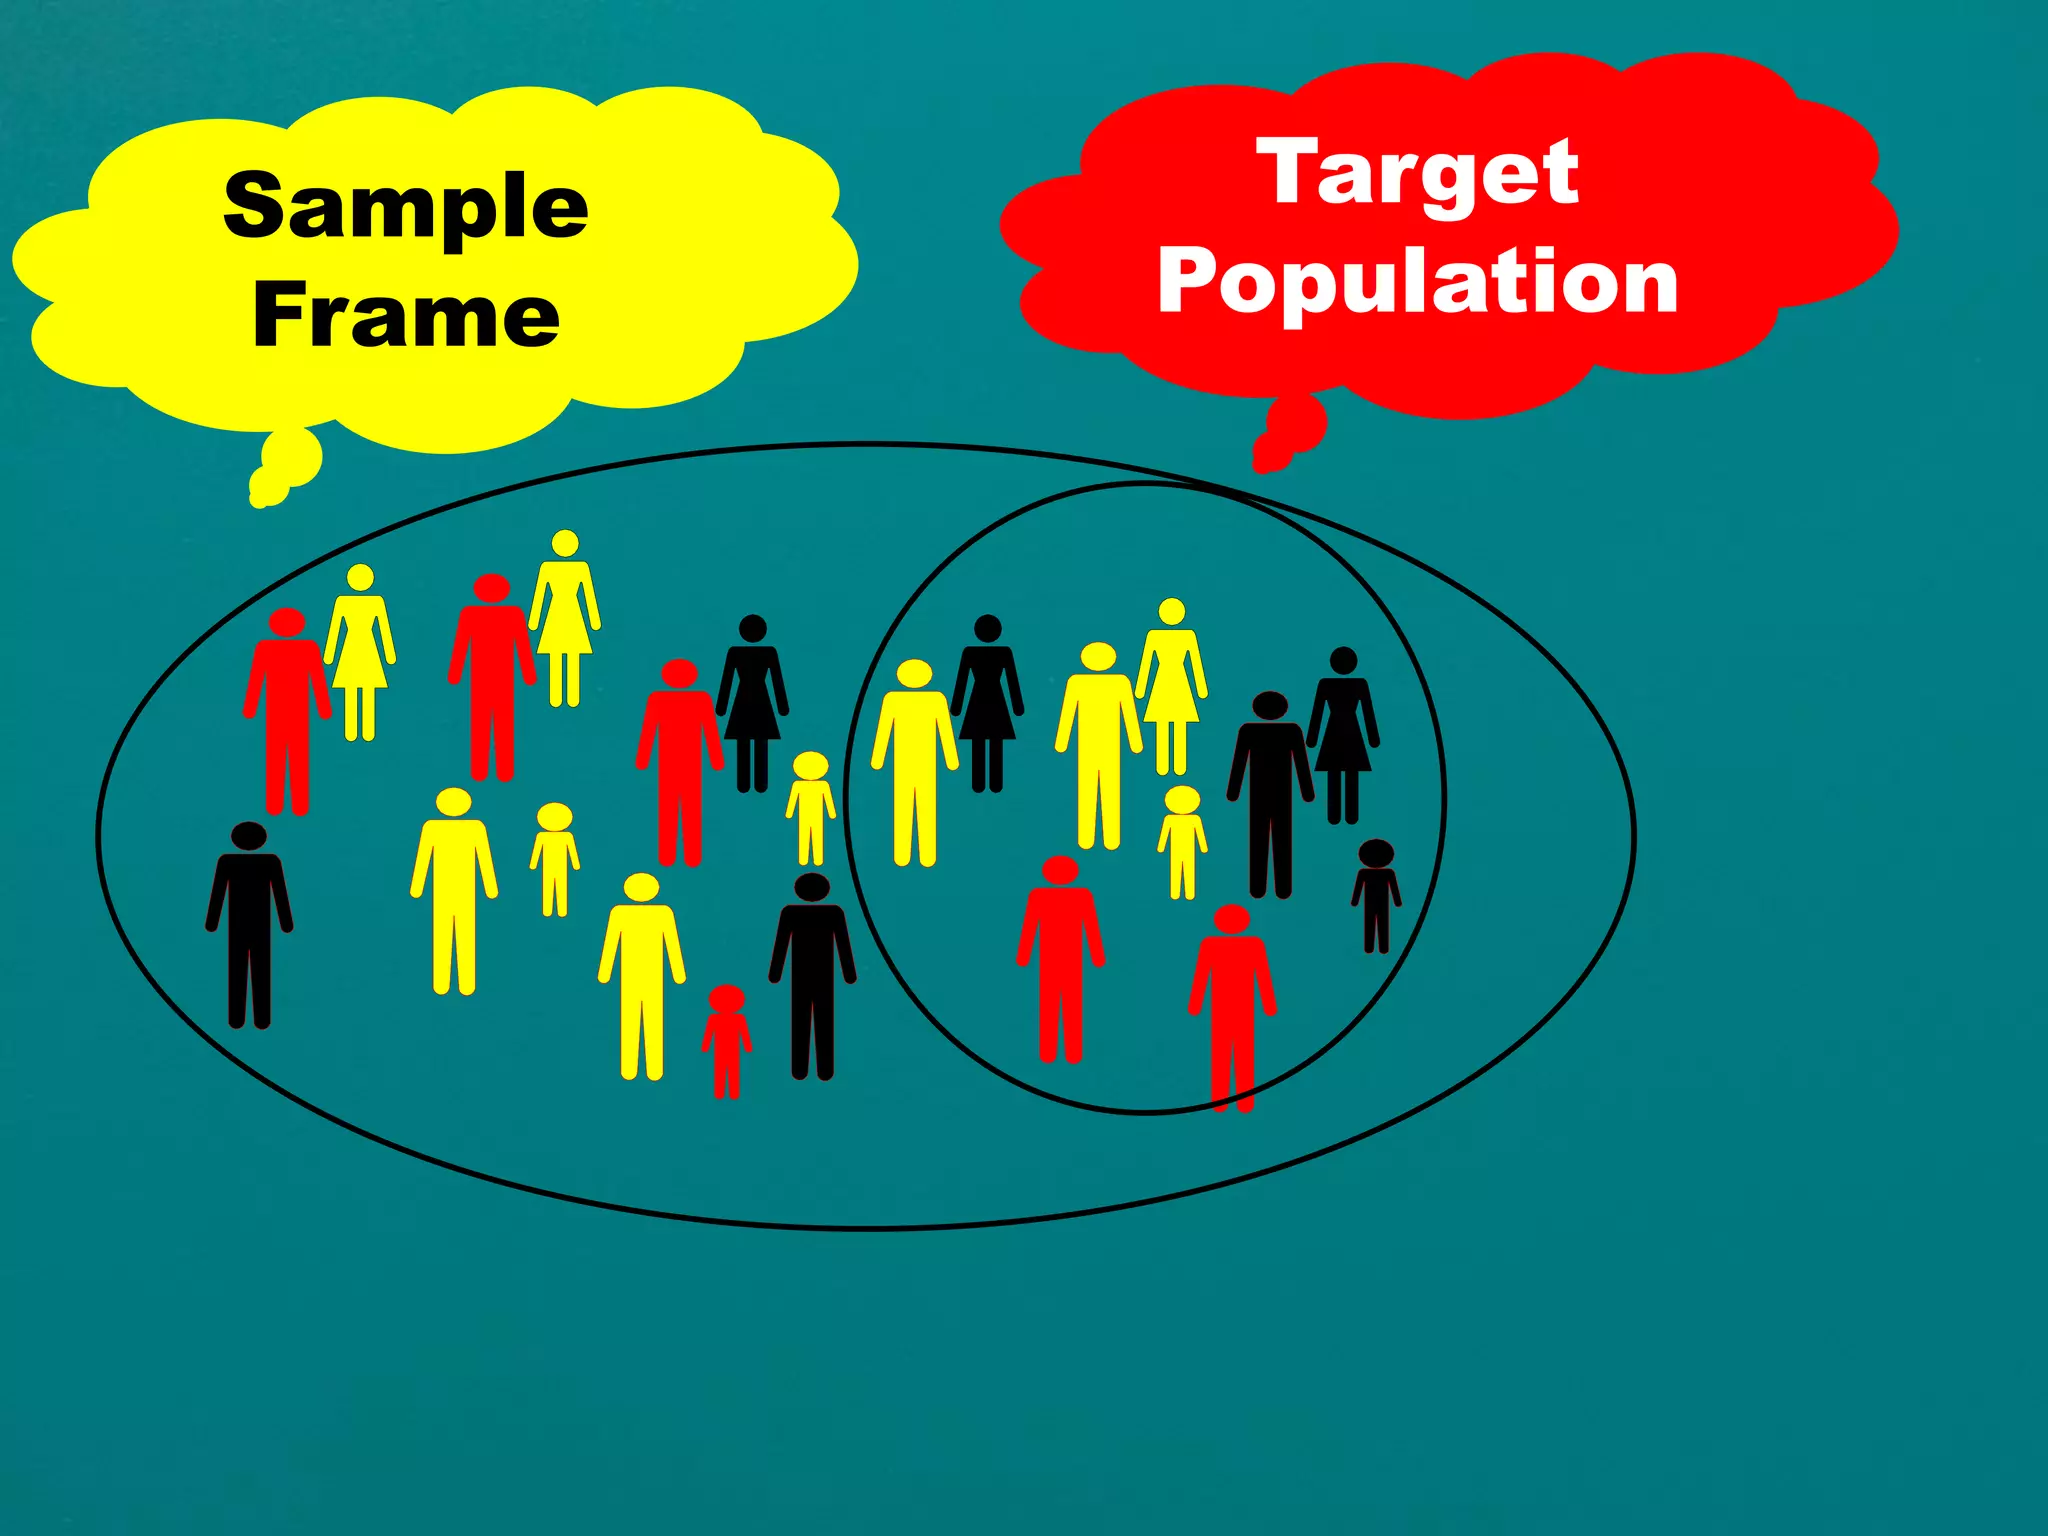
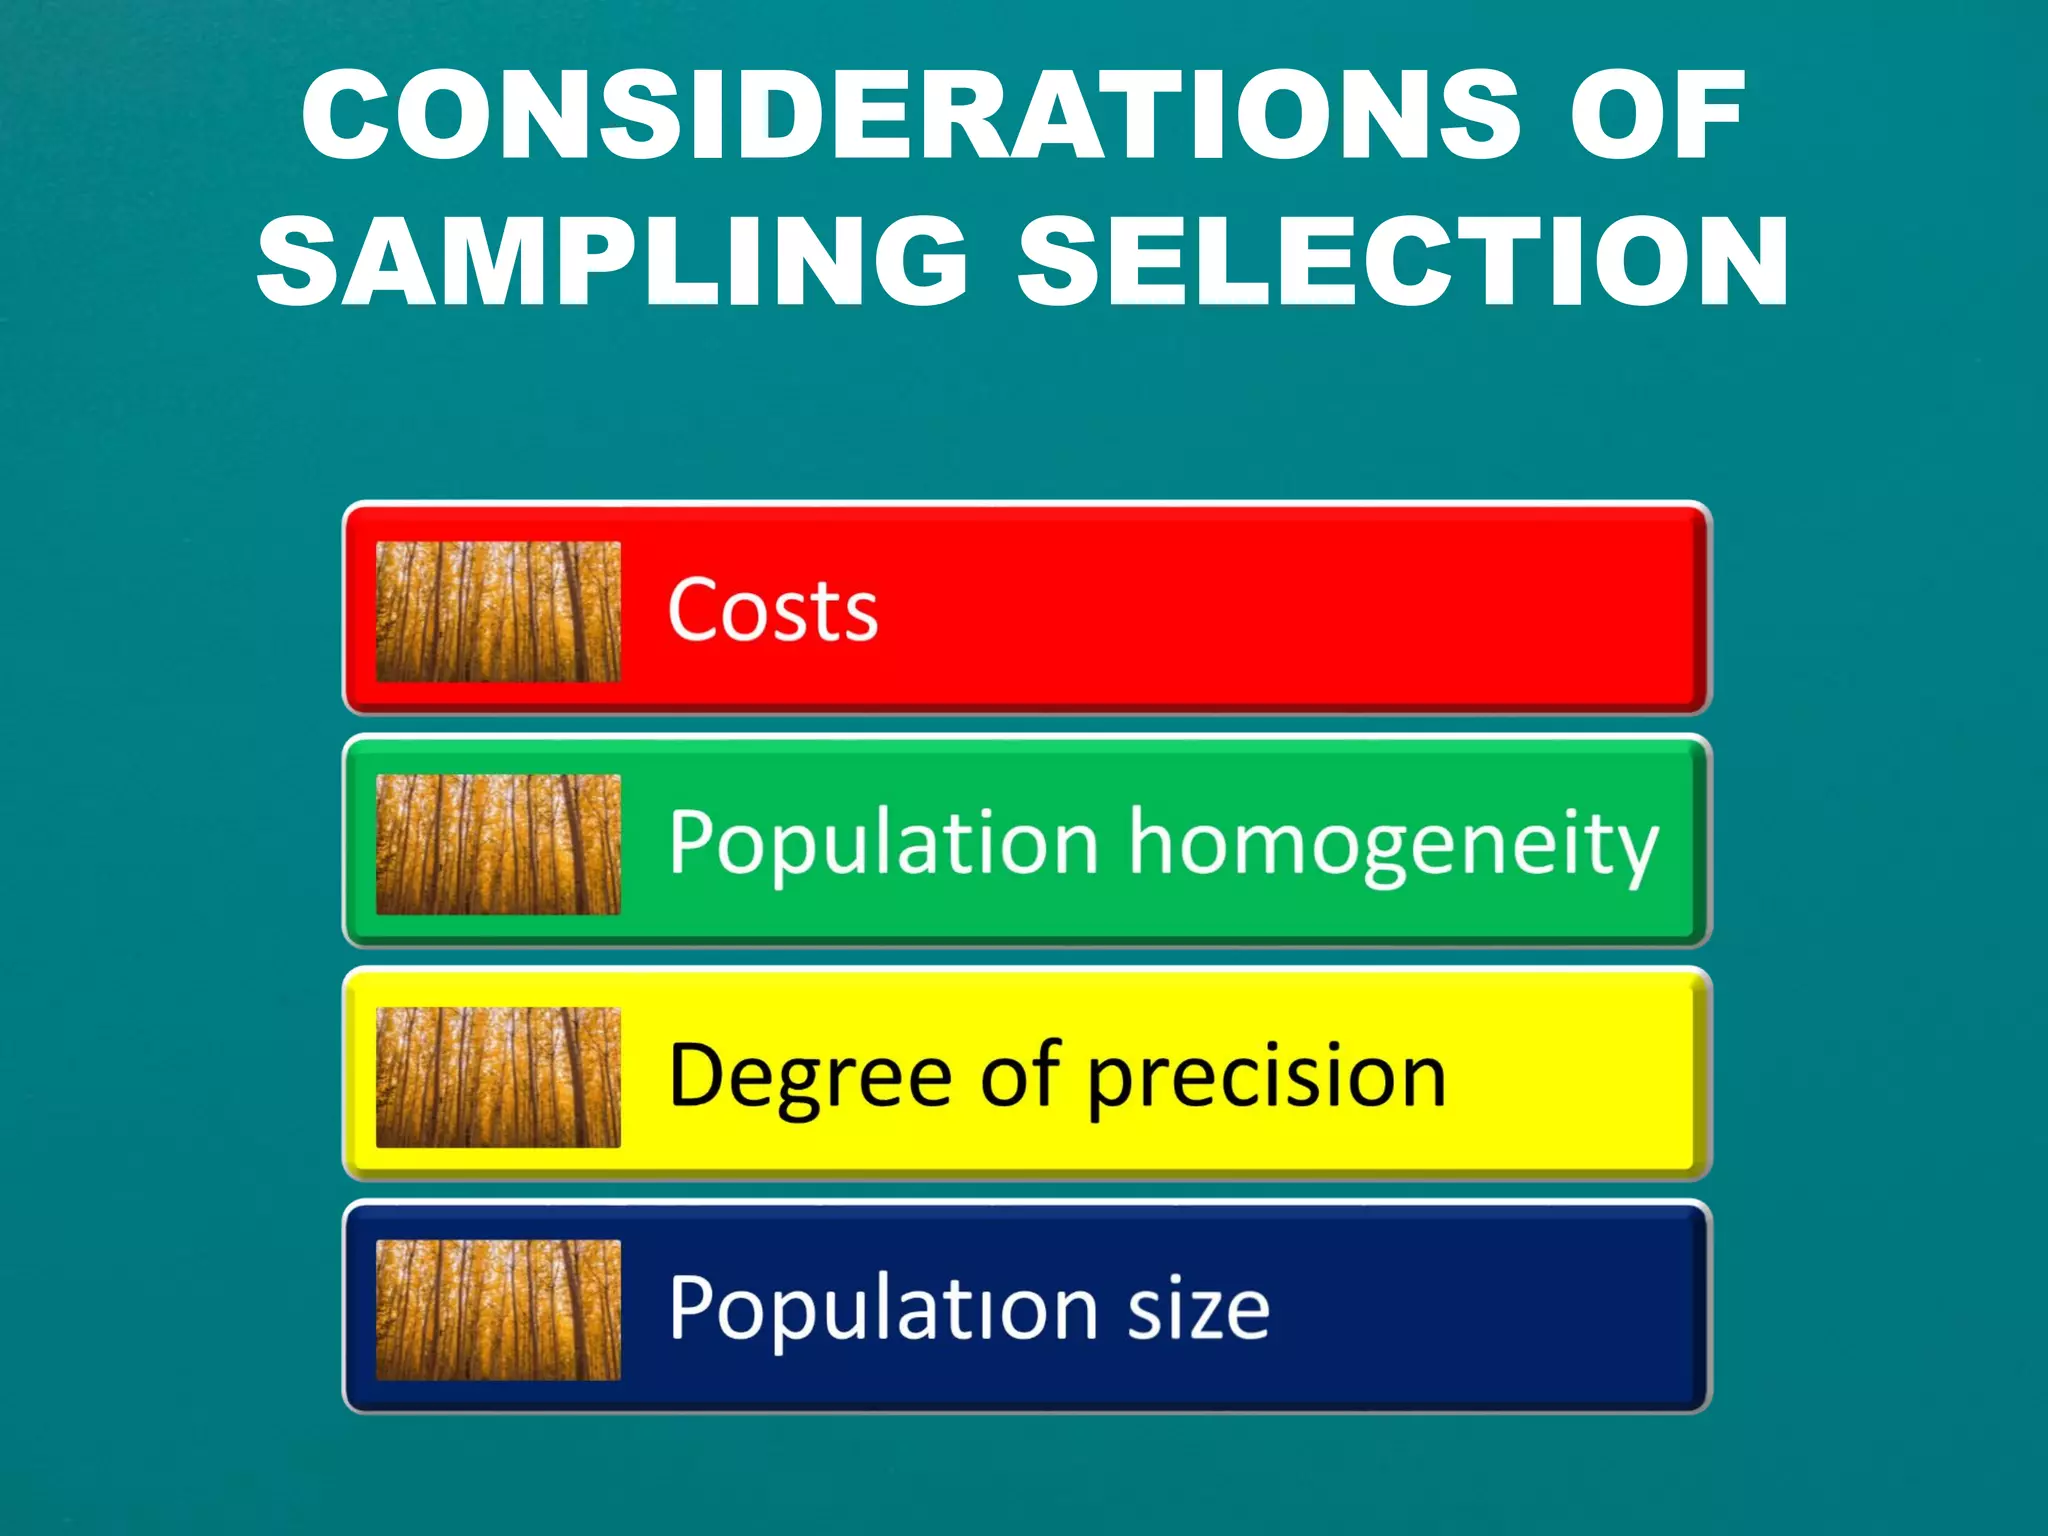
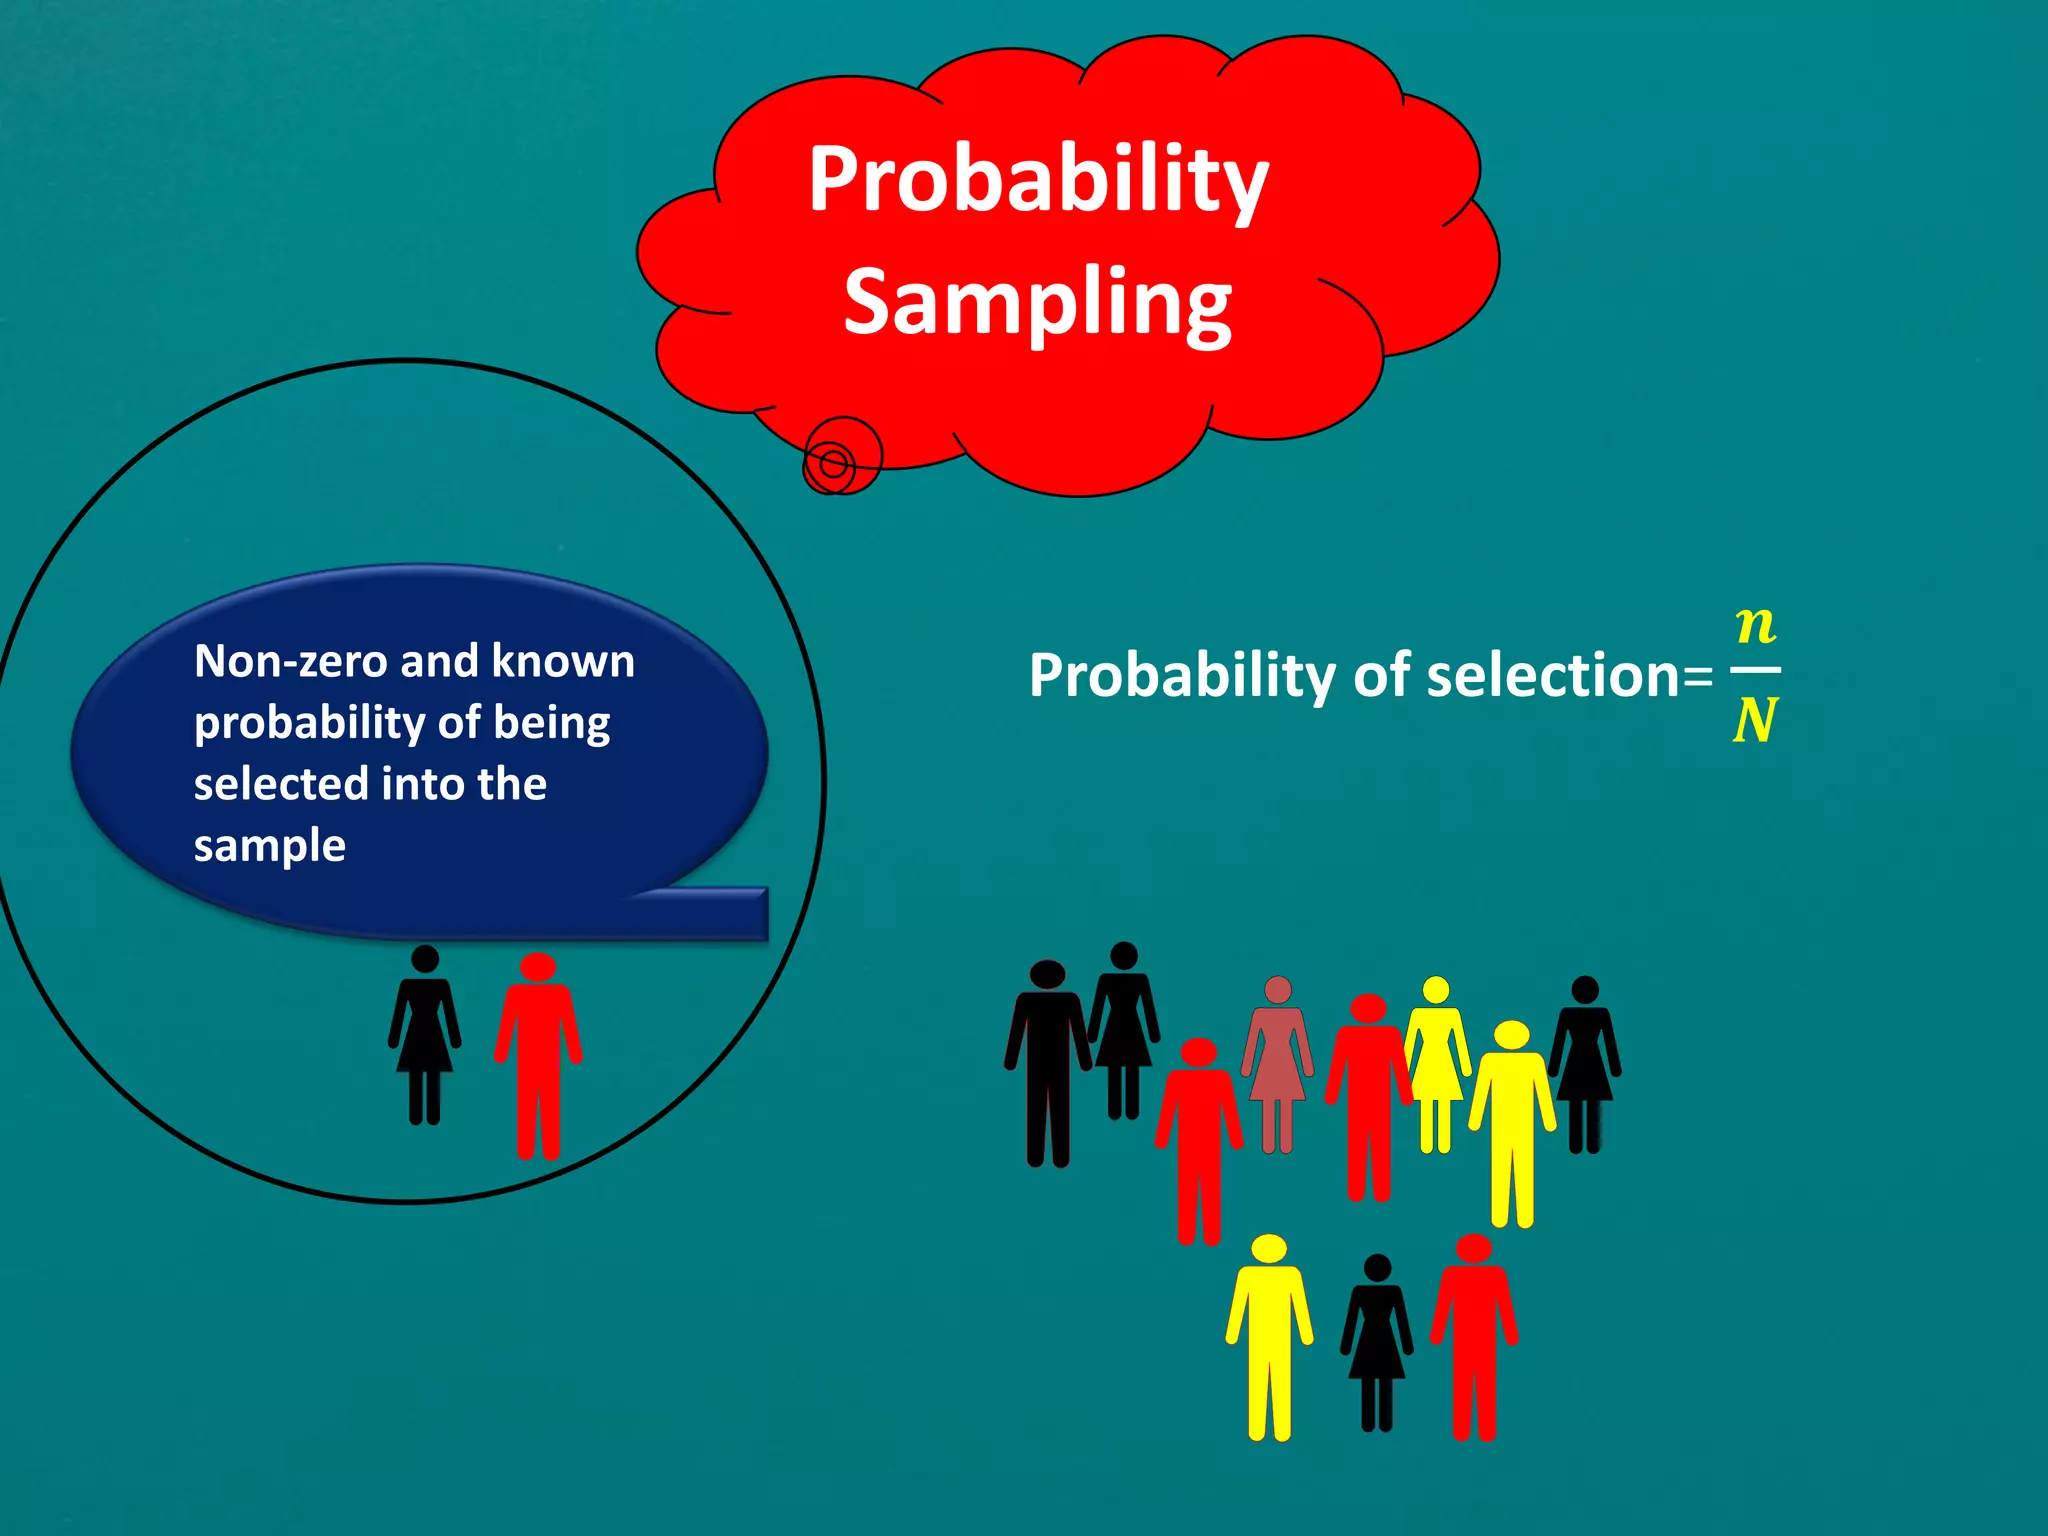
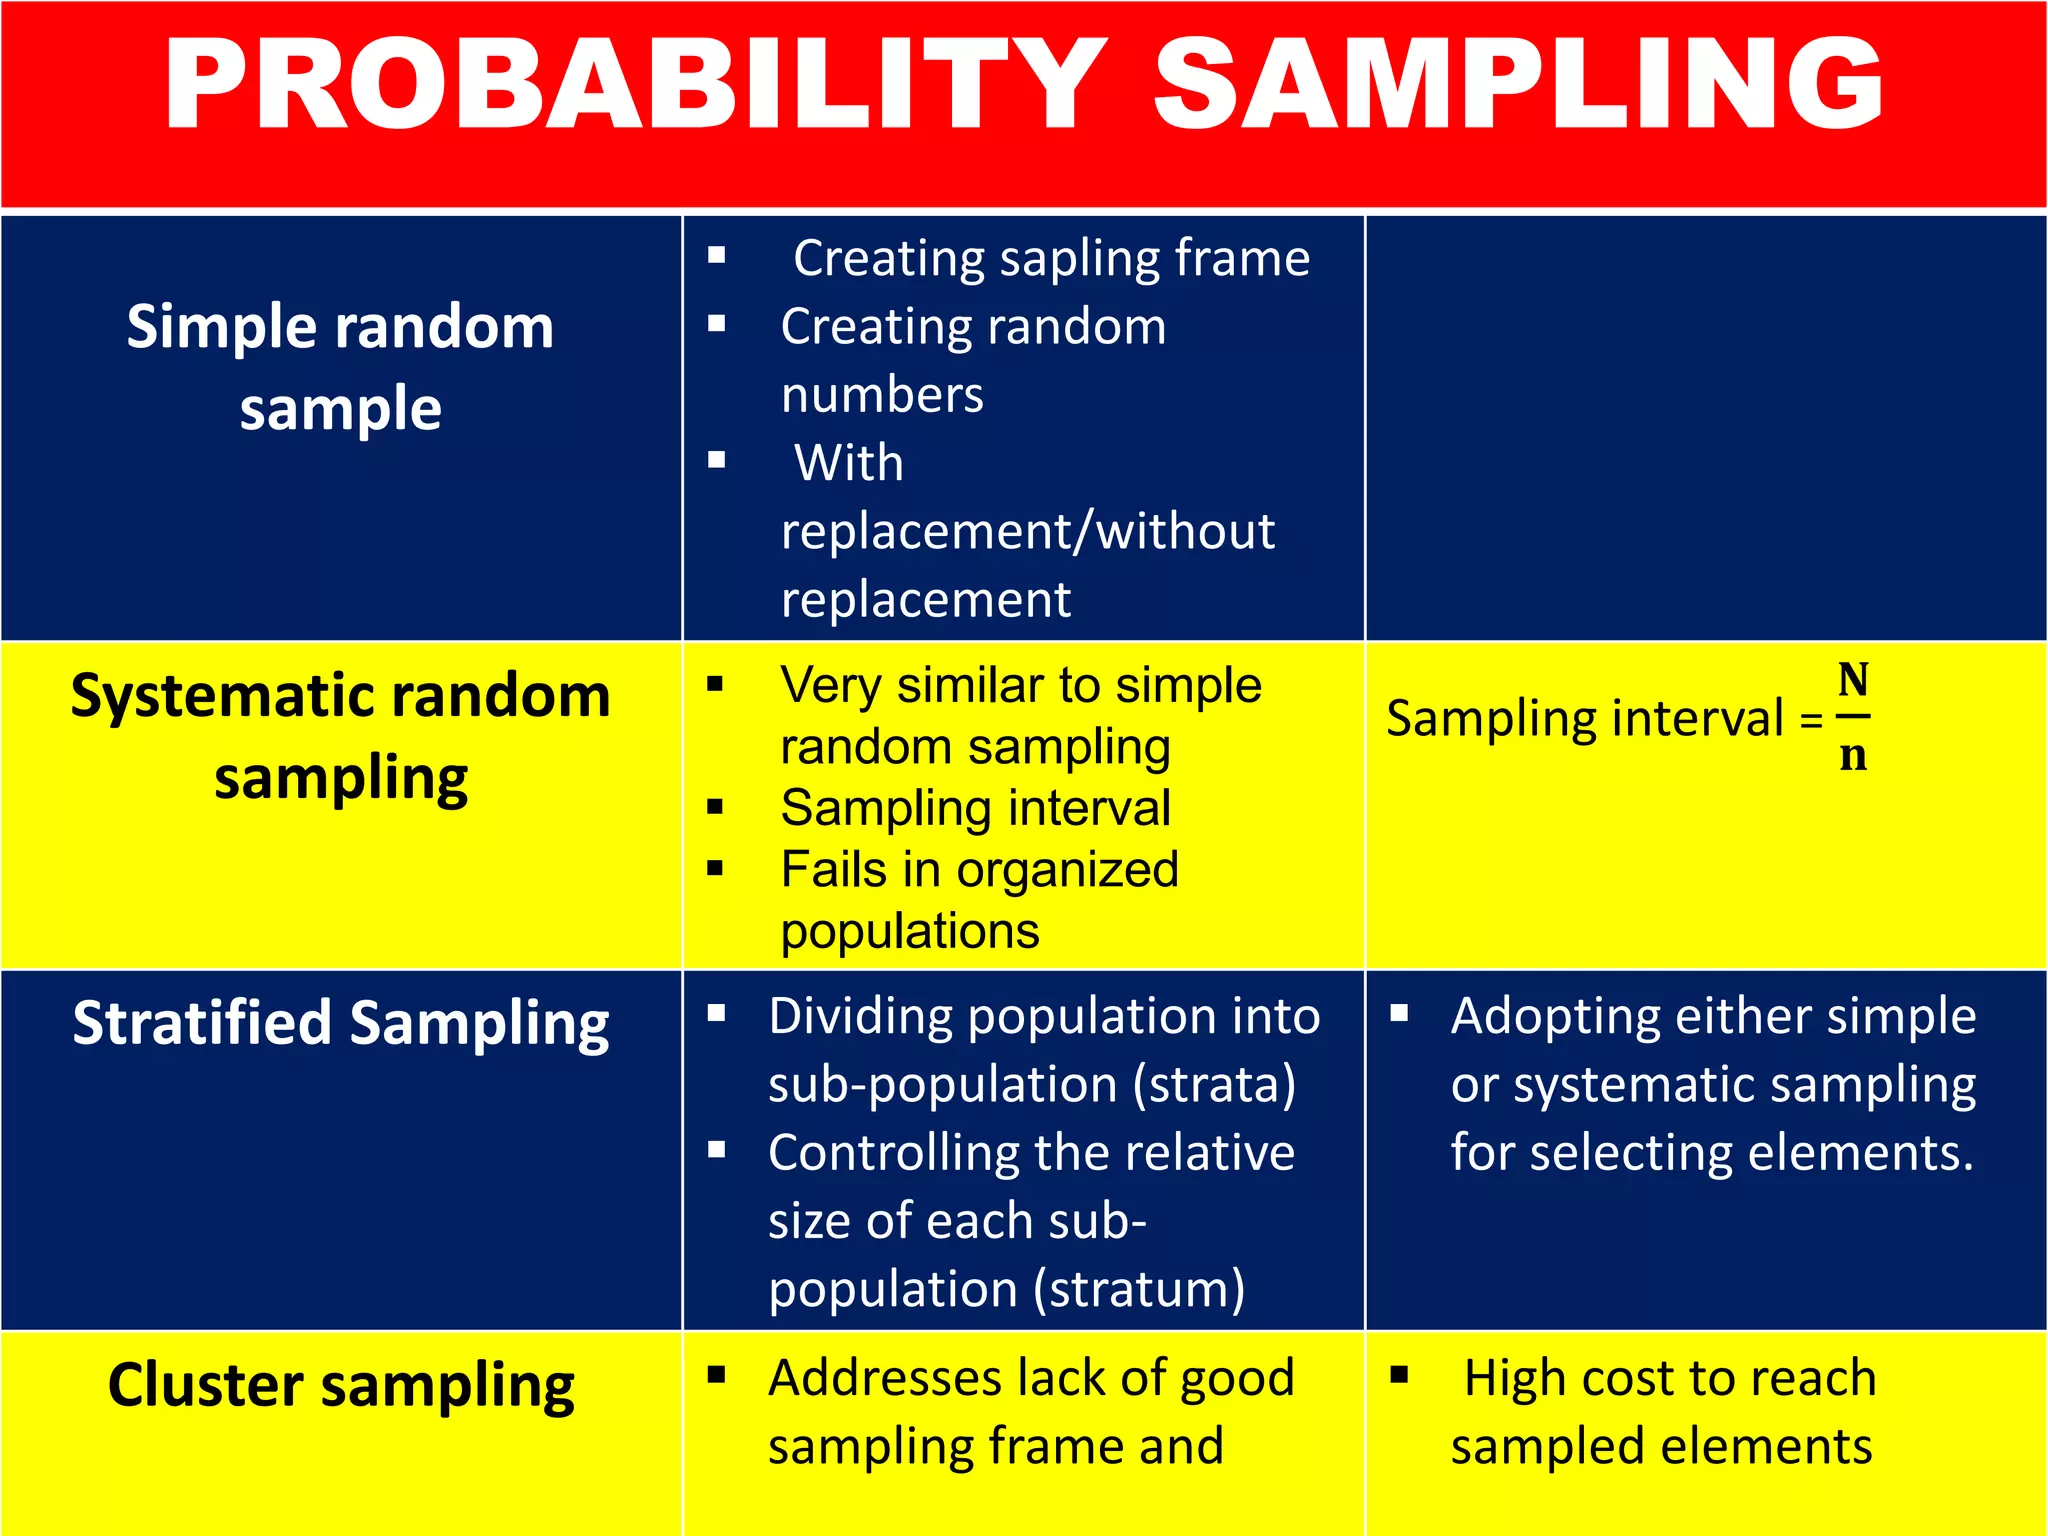
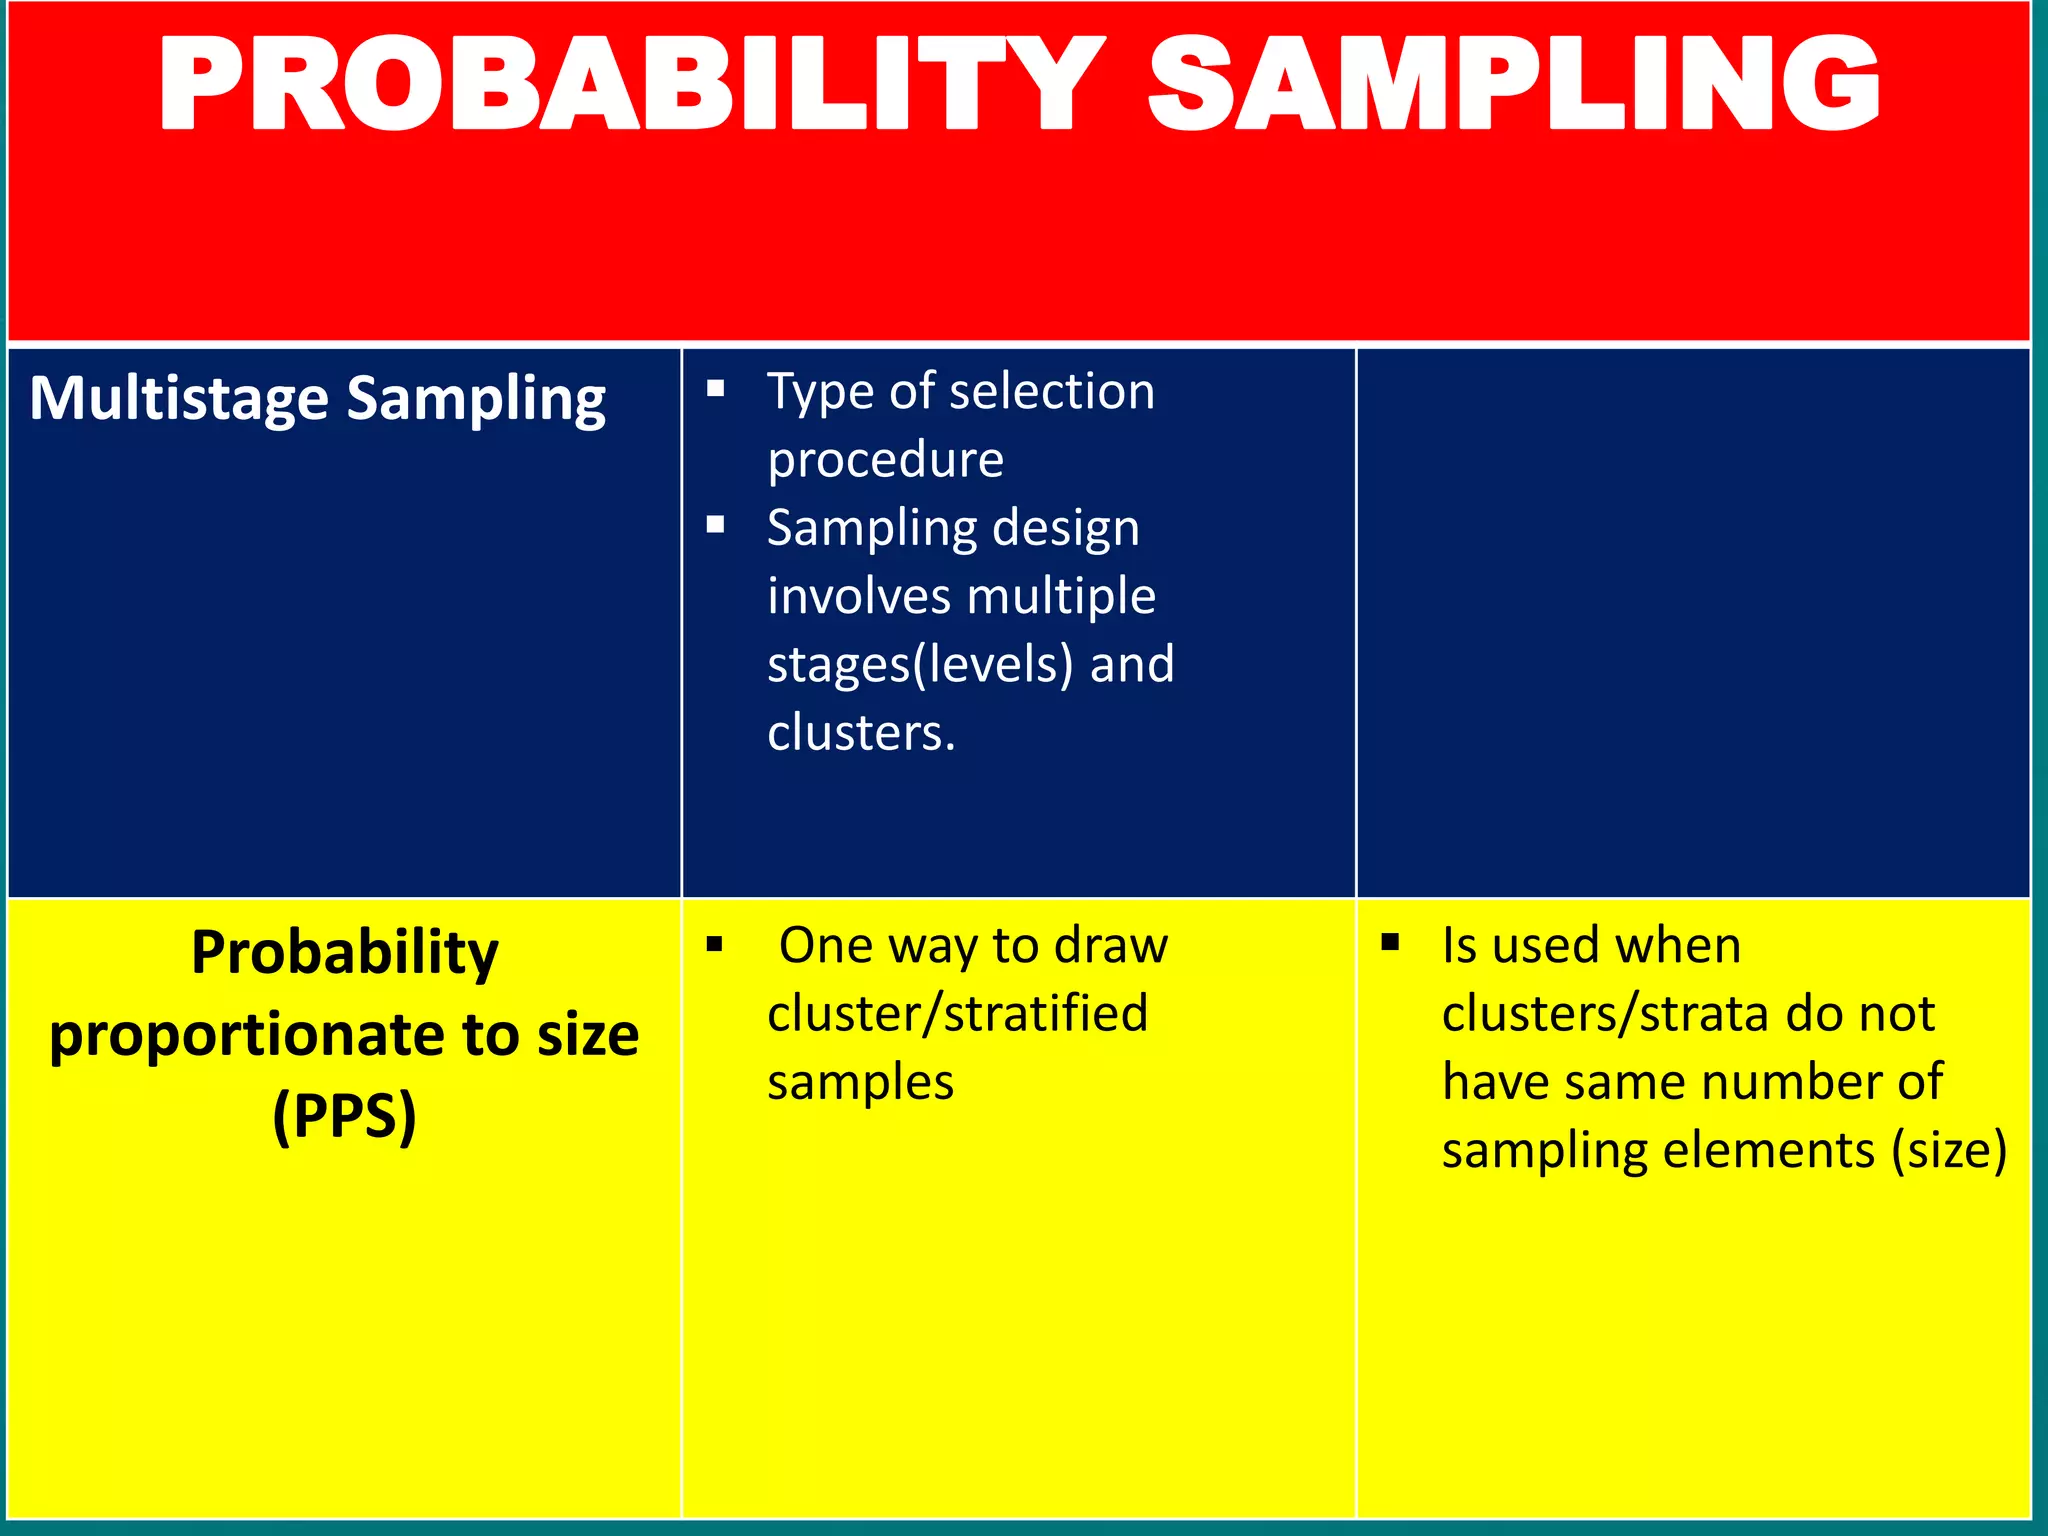
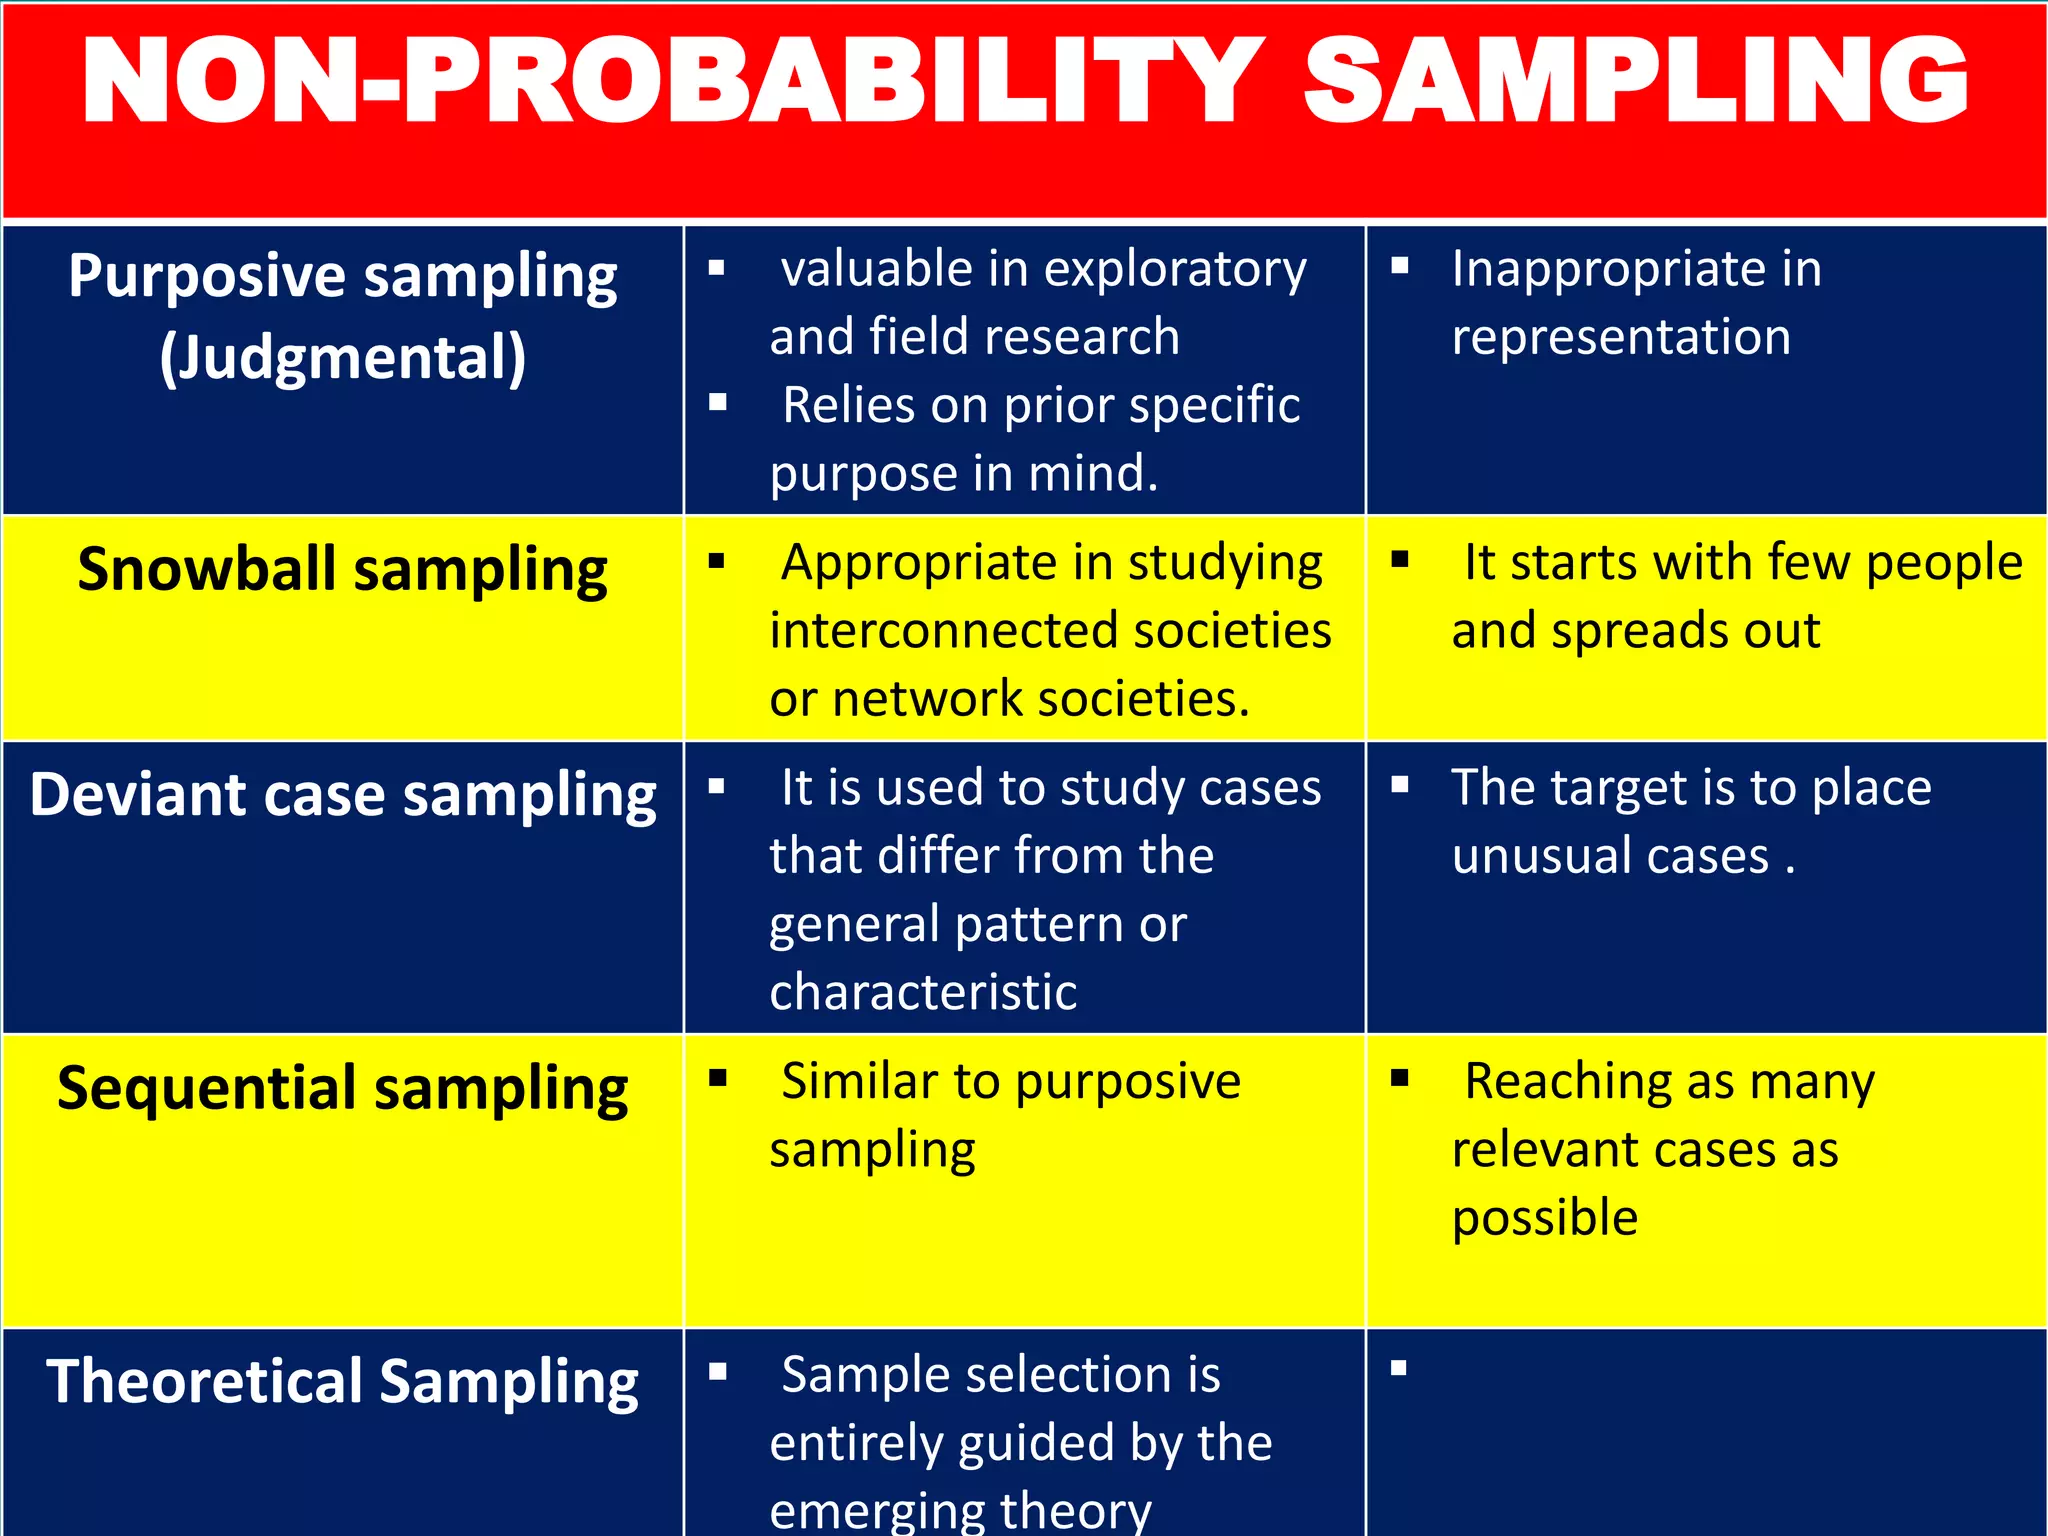
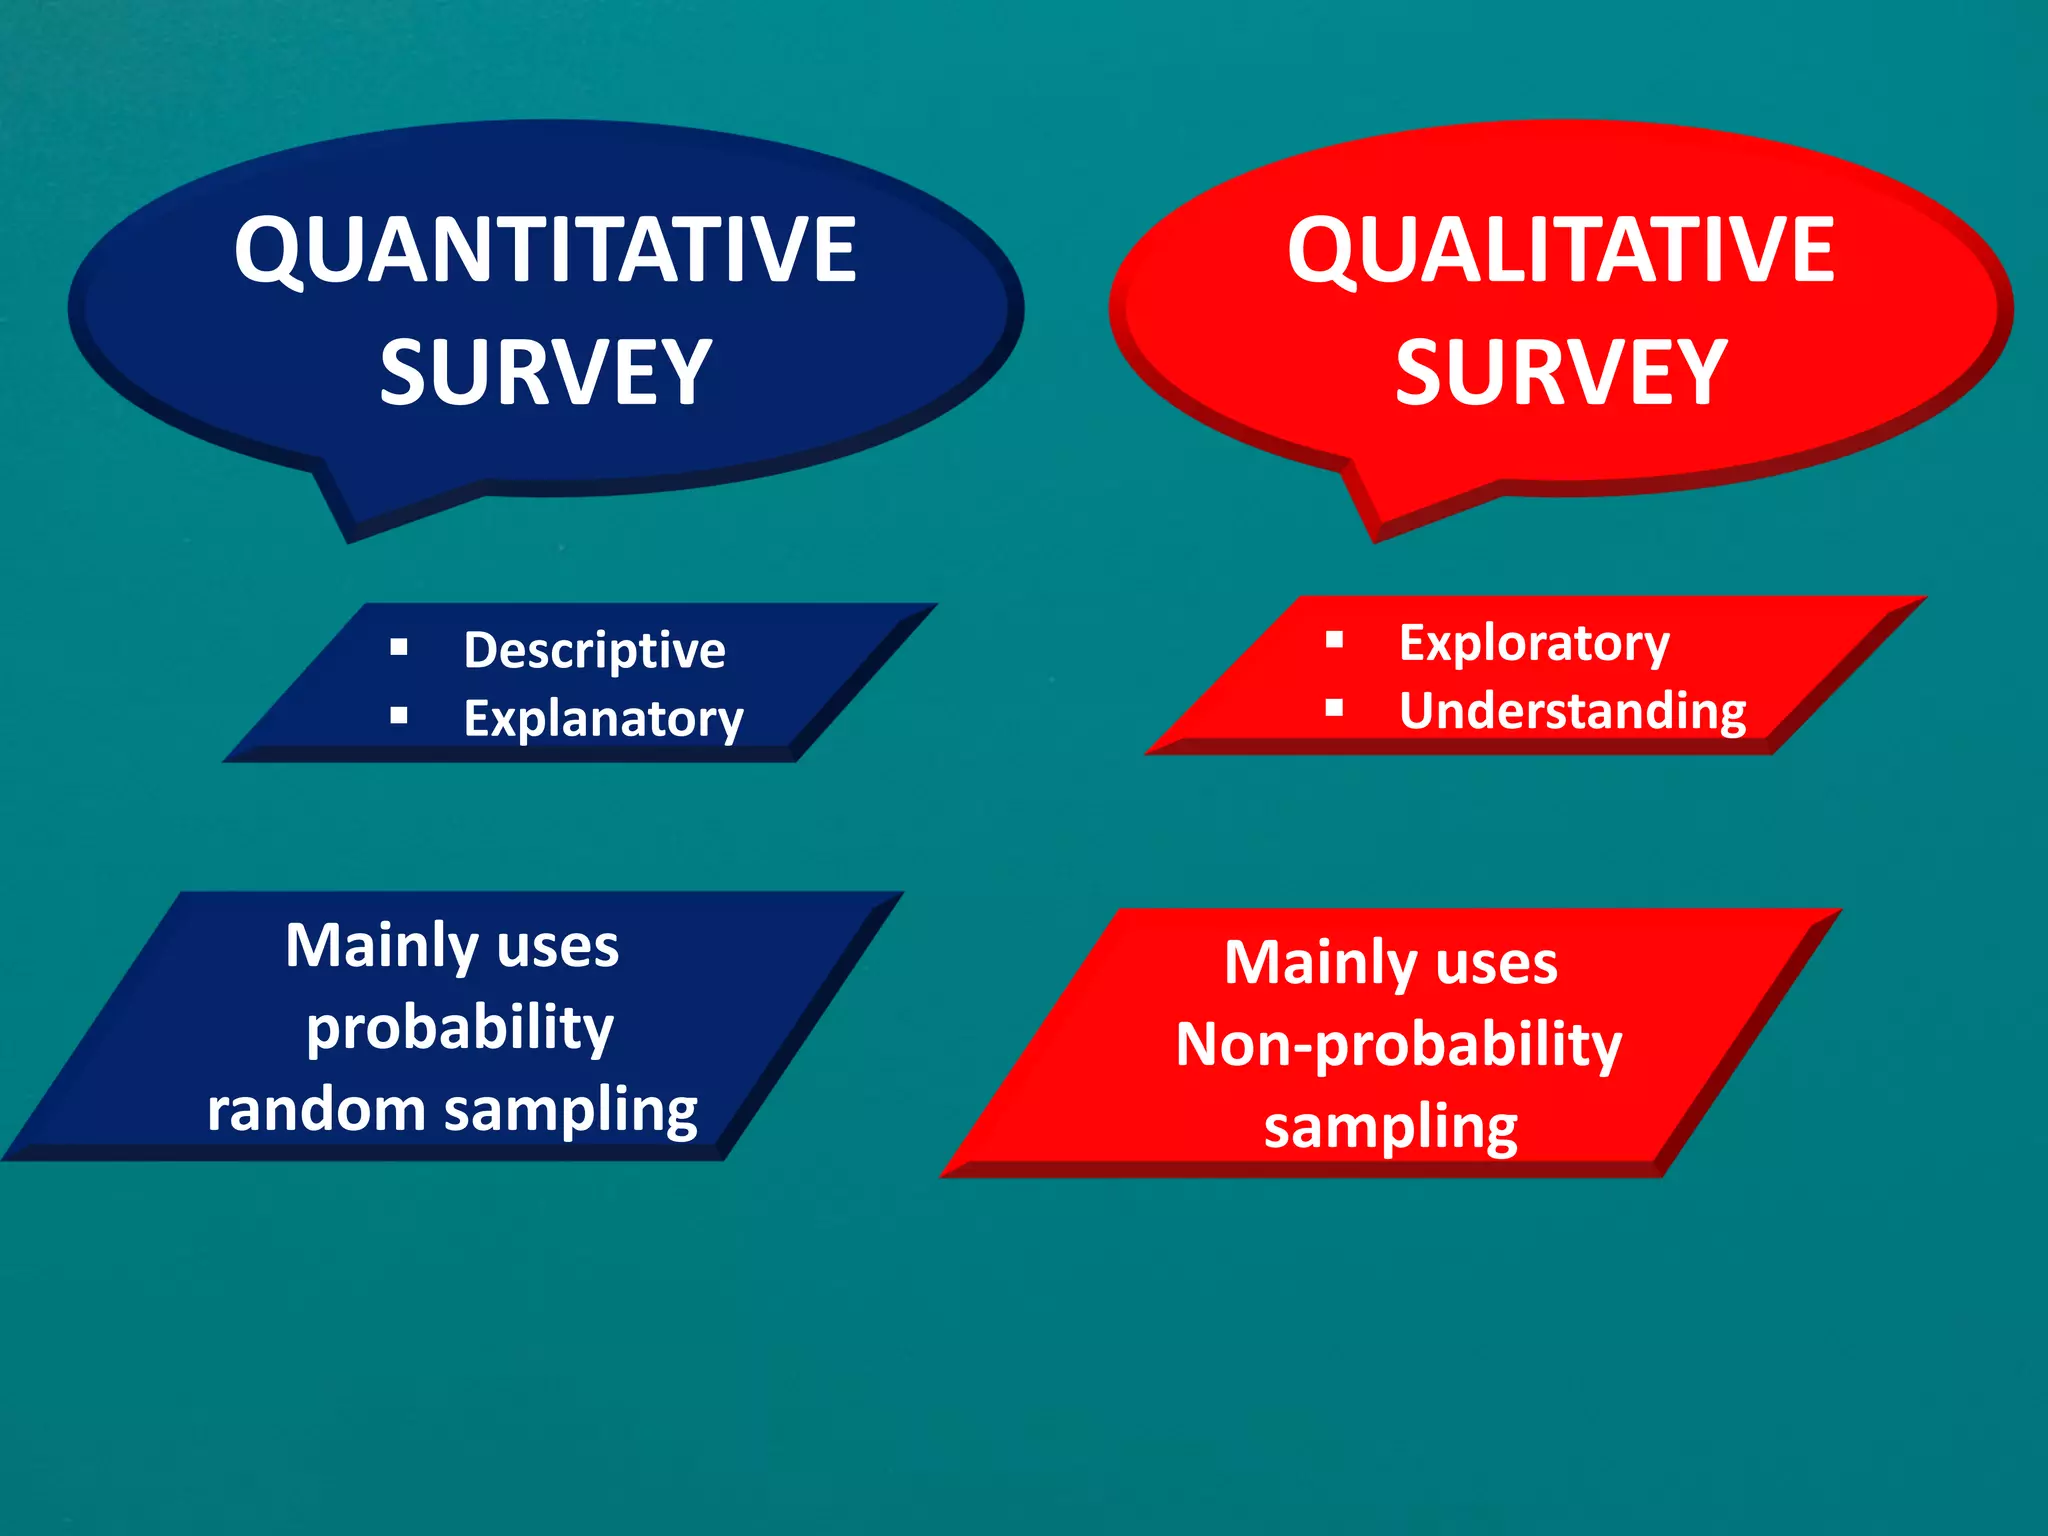
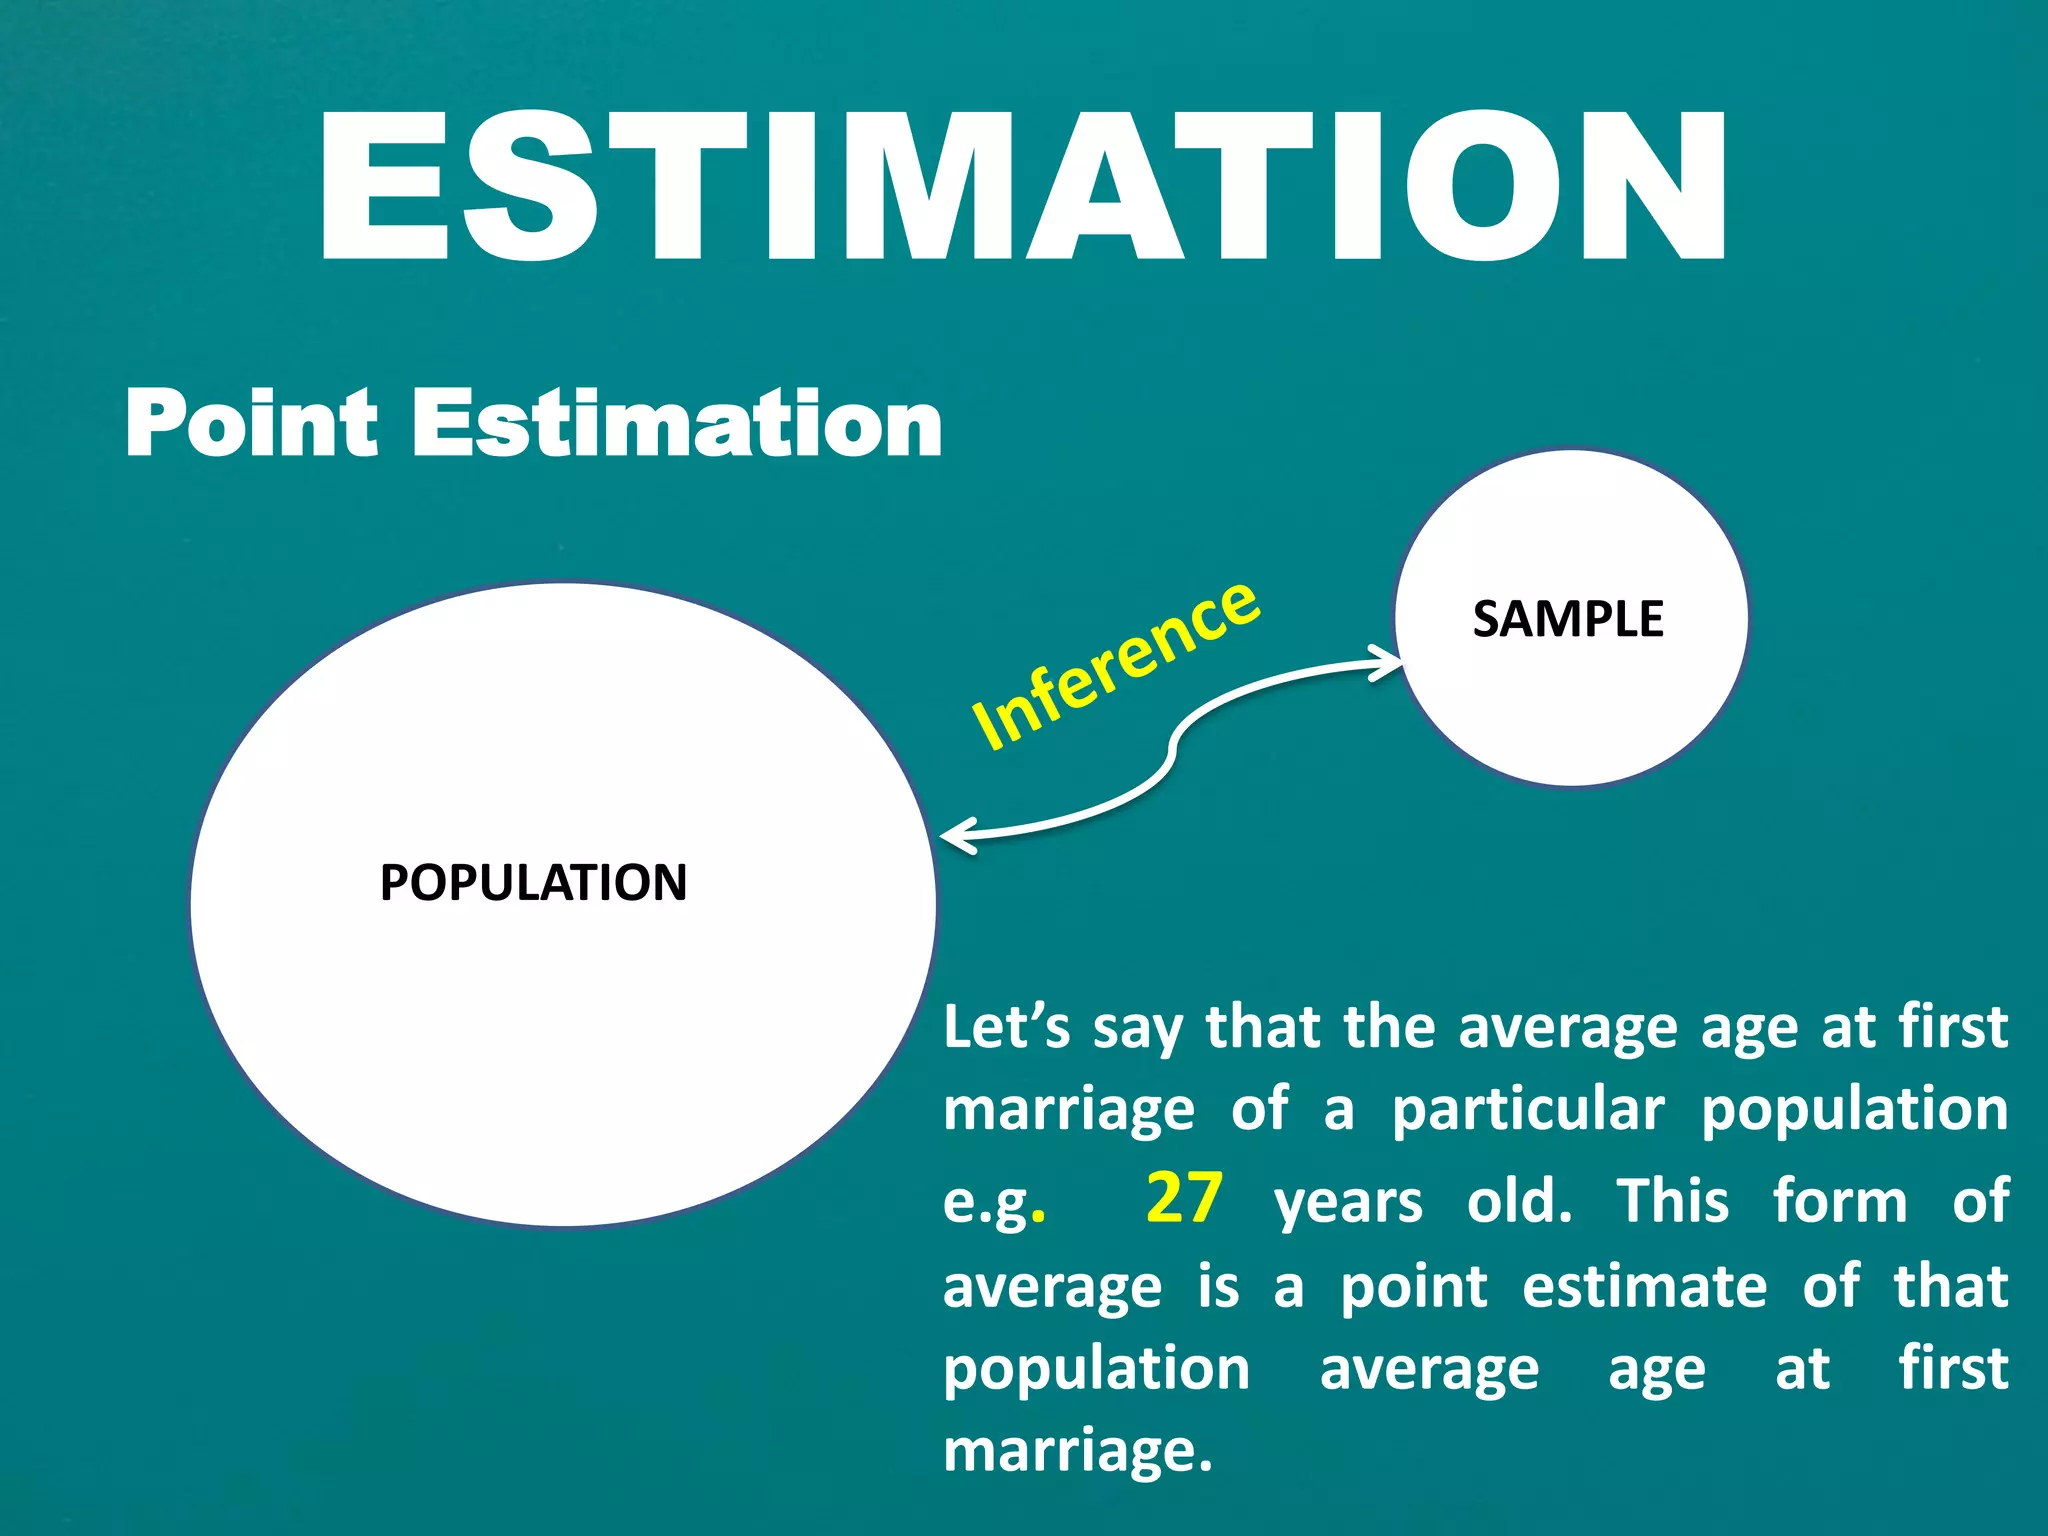
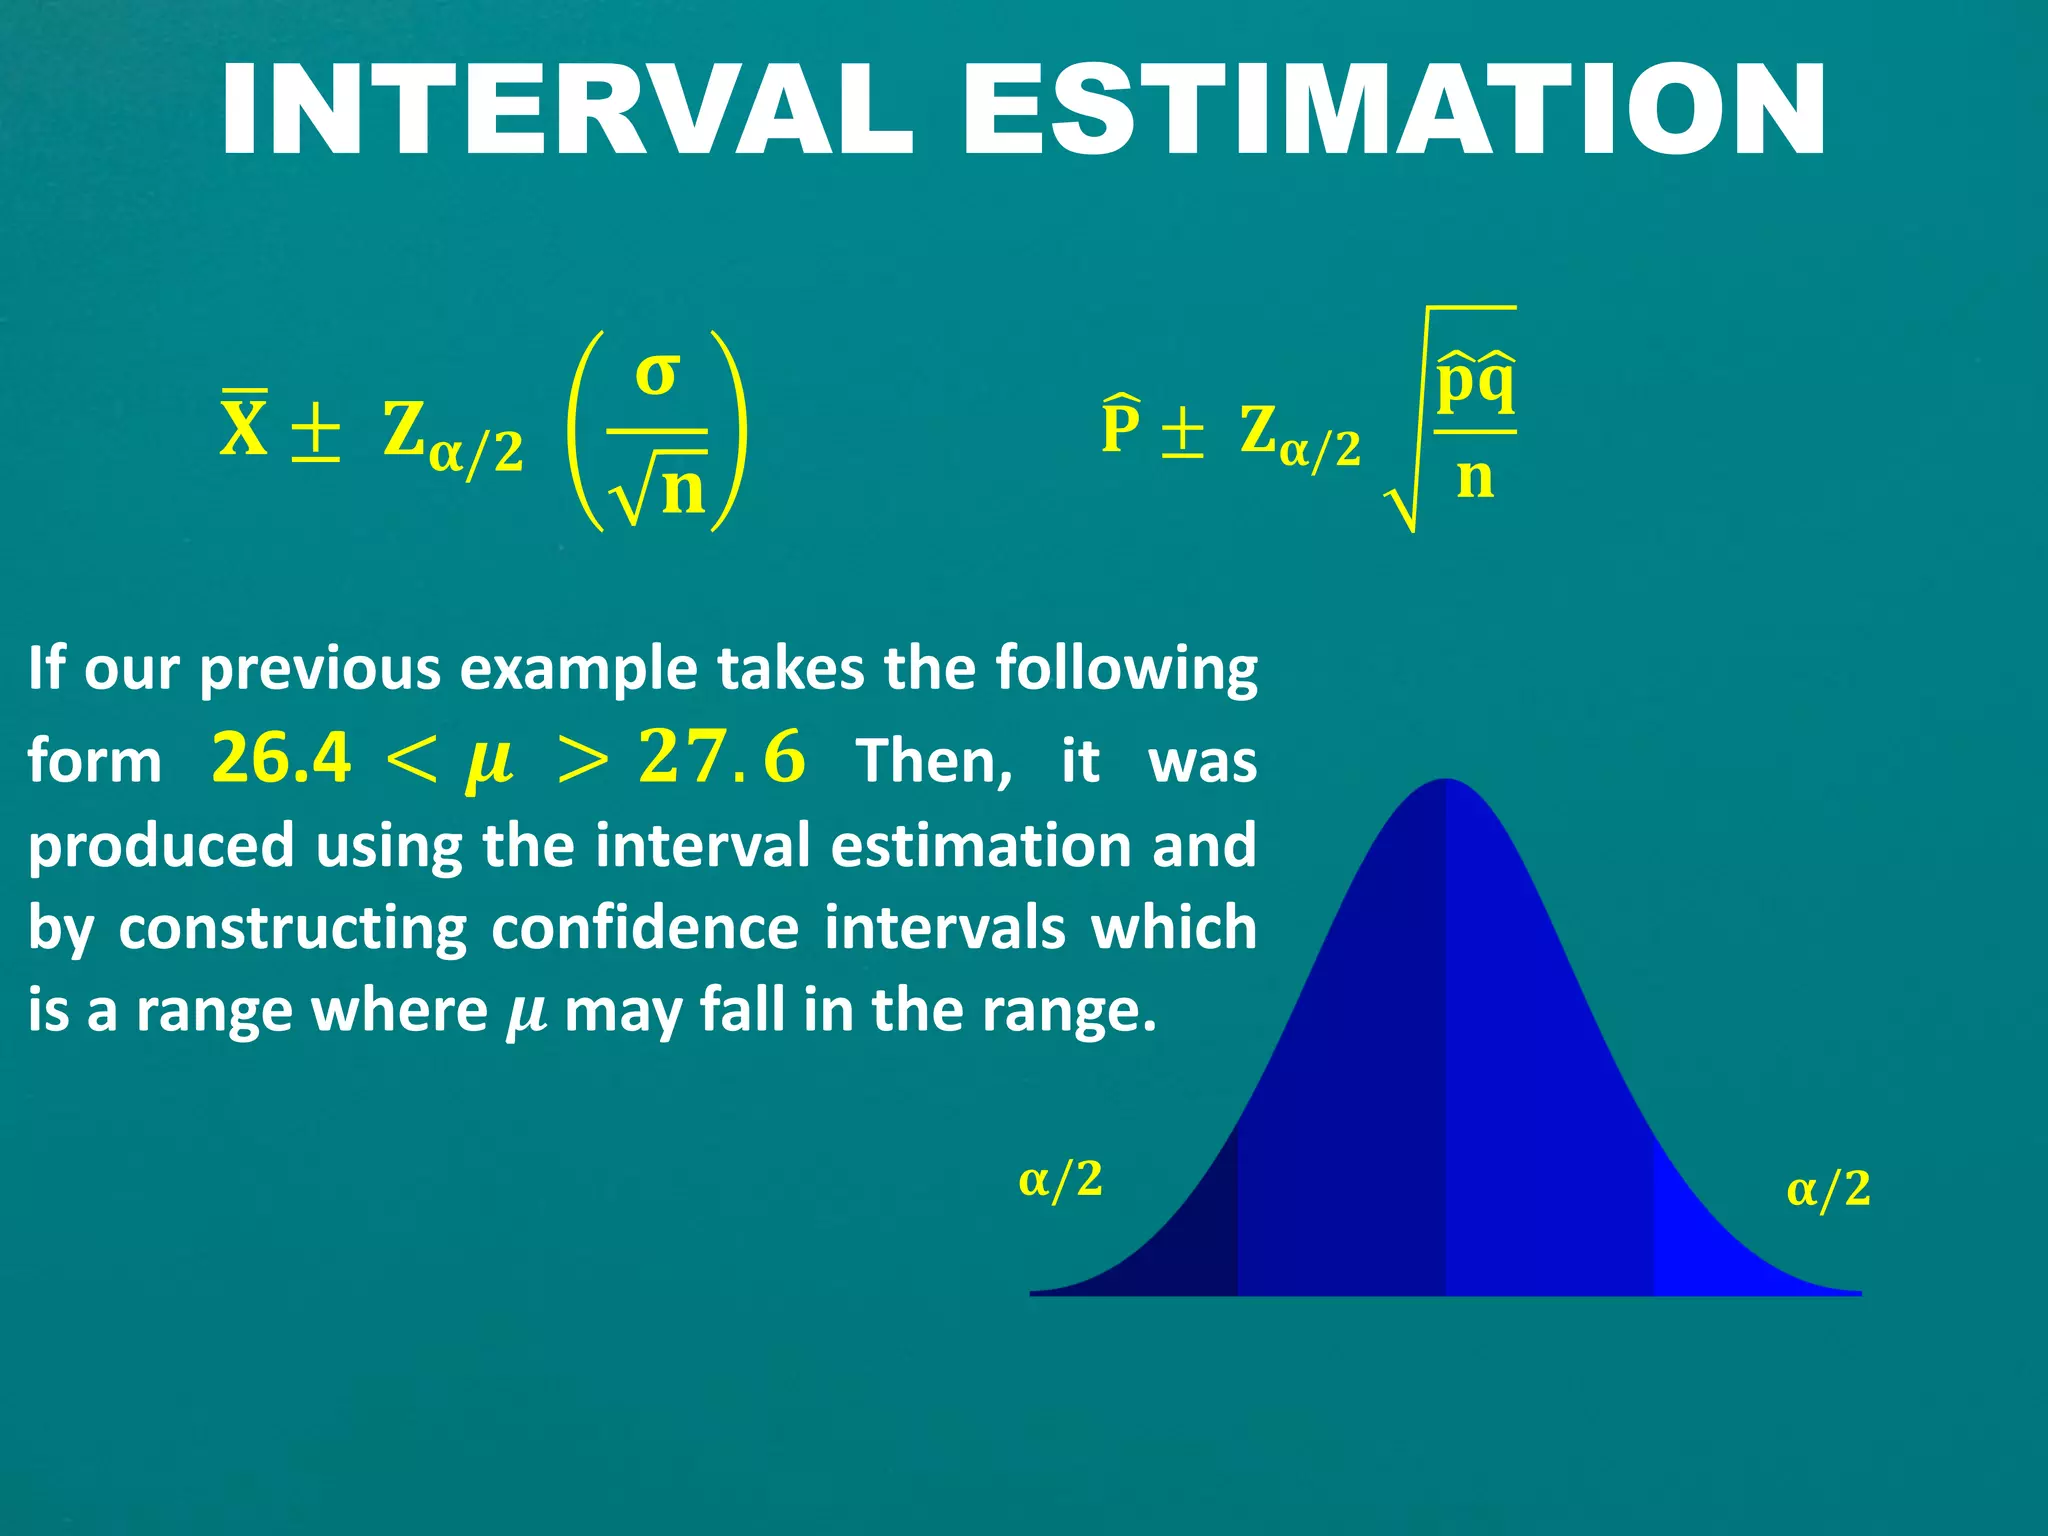
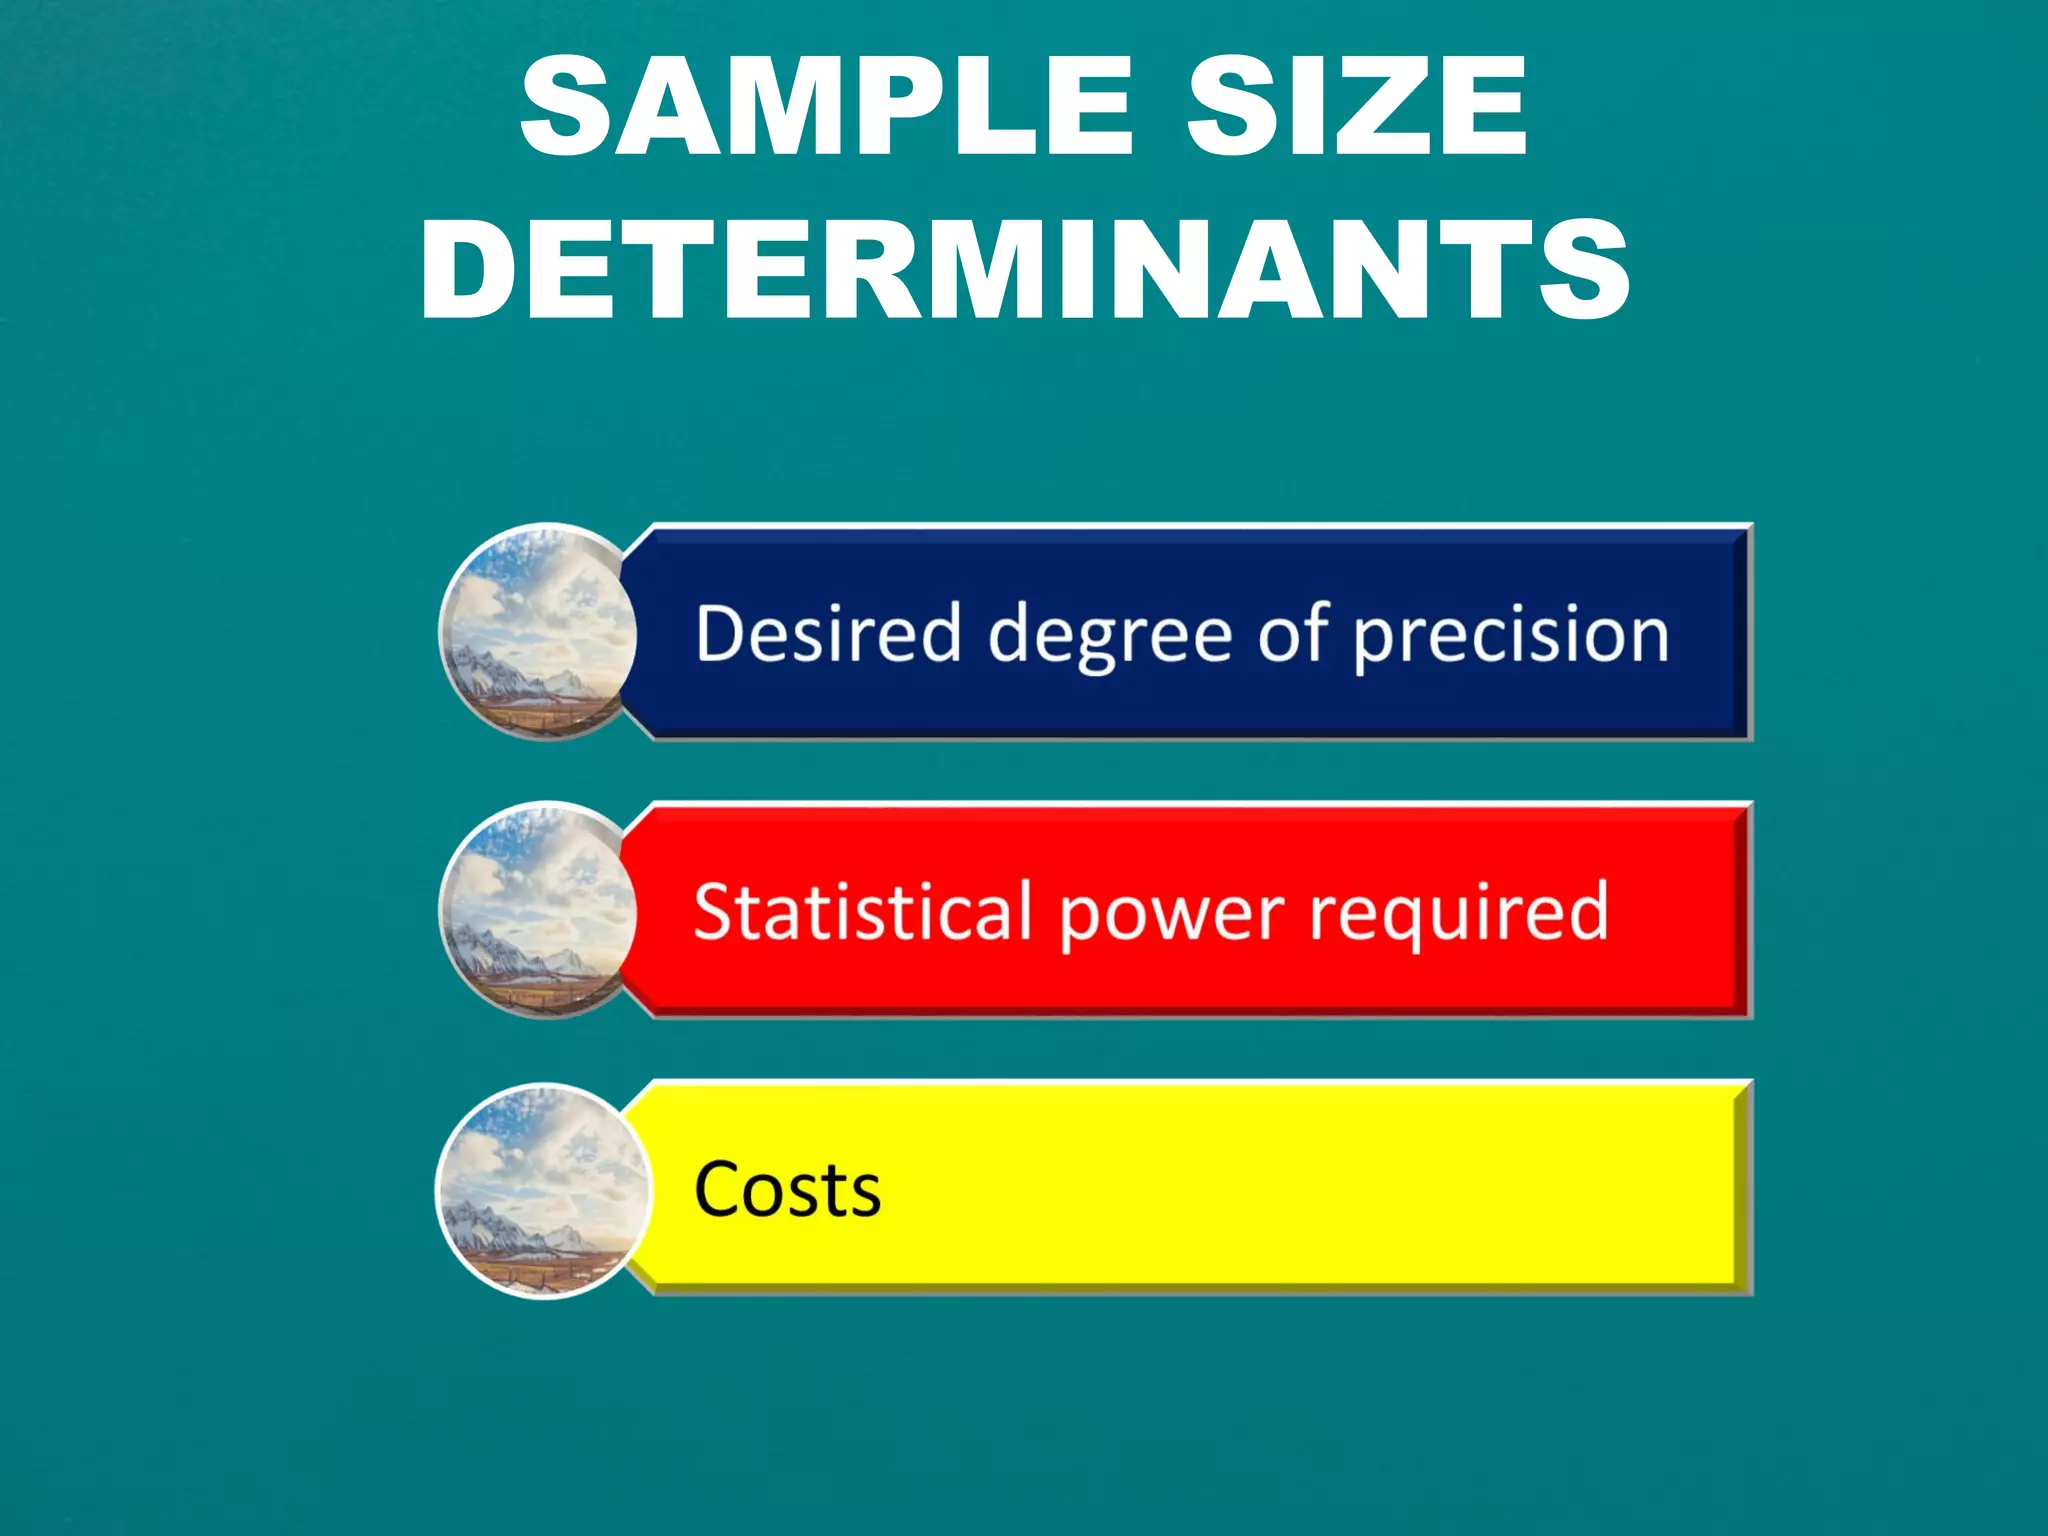
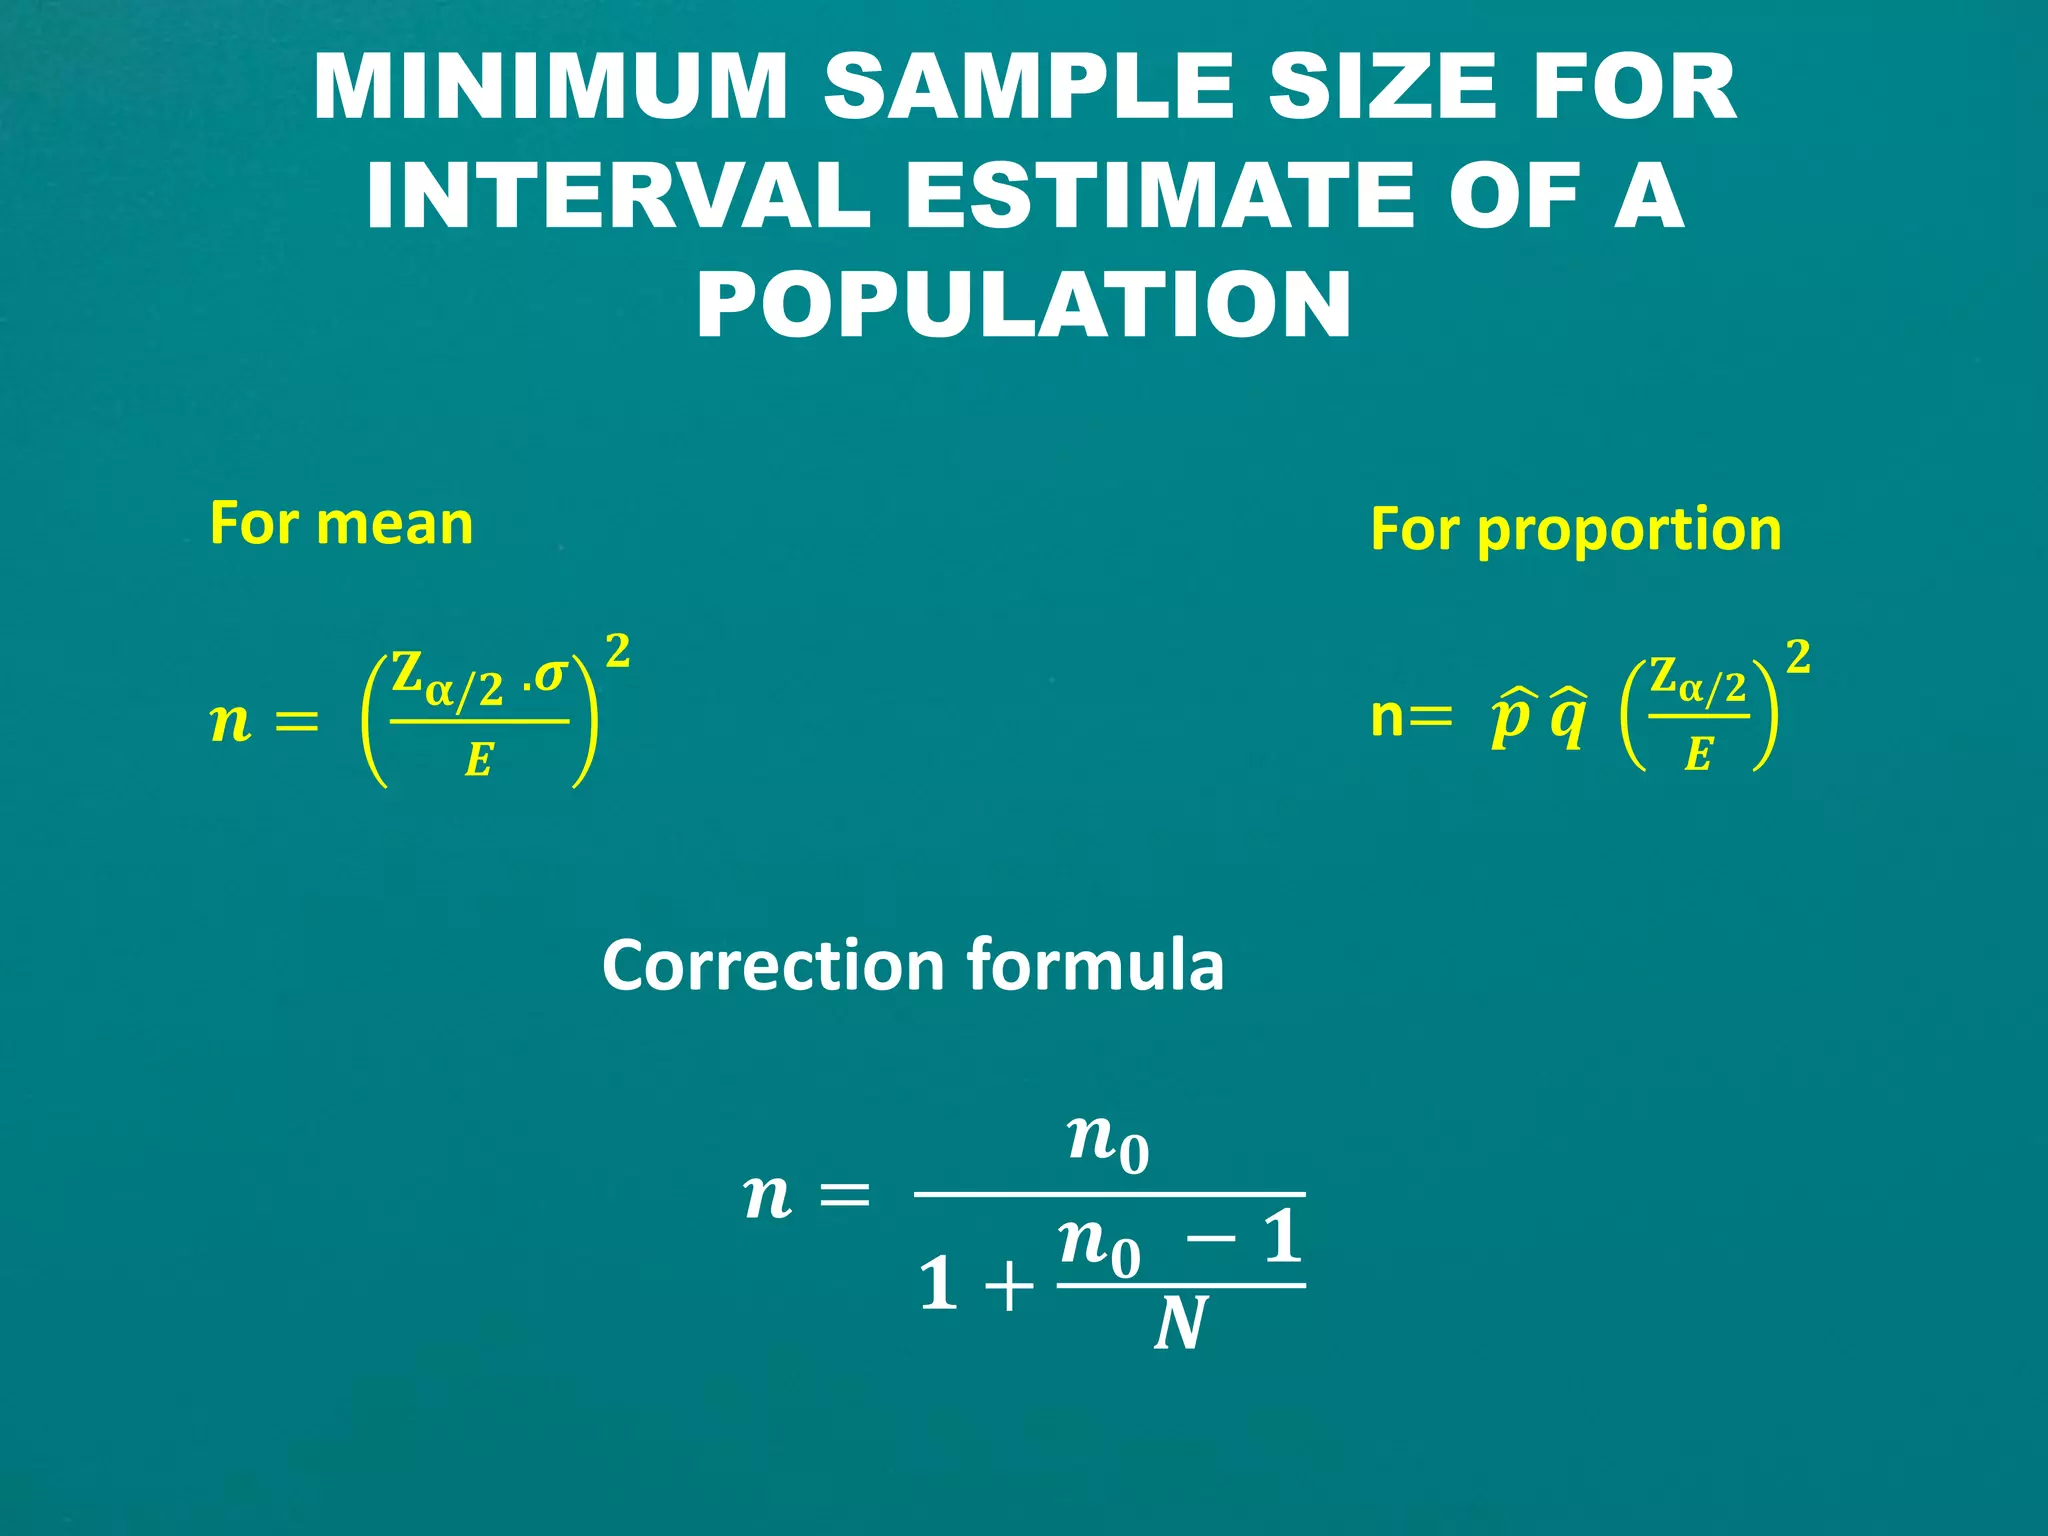
SURVEY SAMPLING
TECHNIQUES
SAY 701
Survey Research Methodology
Institute of Population Studies
Hacettepe University
By
Abdirahman S. Mohamed
CONCEPTS
WHY SAMPLING SURVEY
CHARACTERISTICS OF
SAMPLING
SAMPLING IN THE
SURVEY PROCESS
Implementing
Designing
Sample
Frame
Target
Population
CONSIDERATIONS OF
SAMPLING SELECTION
Probability of selection=
𝒏
𝑵
Non-zero and known
probability of being
selected into the
sample
Probability
Sampling
PROBABILITY SAMPLING
Simple random
sample
 Creating sapling frame
 Creating random
numbers
 With
replacement/without
replacement
Systematic random
sampling
 Very similar to simple
random sampling
 Sampling interval
 Fails in organized
populations
Sampling interval =
𝐍
𝐧
Stratified Sampling  Dividing population into
sub-population (strata)
 Controlling the relative
size of each sub-
population (stratum)
 Adopting either simple
or systematic sampling
for selecting elements.
Cluster sampling  Addresses lack of good
sampling frame and
 High cost to reach
sampled elements
PROBABILITY SAMPLING
Multistage Sampling  Type of selection
procedure
 Sampling design
involves multiple
stages(levels) and
clusters.
Probability
proportionate to size
(PPS)
 One way to draw
cluster/stratified
samples
 Is used when
clusters/strata do not
have same number of
sampling elements (size)
NON-PROBABILITY SAMPLING
Purposive sampling
(Judgmental)
 valuable in exploratory
and field research
 Relies on prior specific
purpose in mind.
 Inappropriate in
representation
Snowball sampling  Appropriate in studying
interconnected societies
or network societies.
 It starts with few people
and spreads out
Deviant case sampling  It is used to study cases
that differ from the
general pattern or
characteristic
 The target is to place
unusual cases .
Sequential sampling  Similar to purposive
sampling
 Reaching as many
relevant cases as
possible
Theoretical Sampling  Sample selection is
entirely guided by the
emerging theory

QUANTITATIVE
SURVEY
QUALITATIVE
SURVEY
 Exploratory
 Understanding
 Descriptive
 Explanatory
Mainly uses
Non-probability
sampling
Mainly uses
probability
random sampling
ESTIMATION
Point Estimation
SAMPLE
POPULATION
Let’s say that the average age at first
marriage of a particular population
e.g. 27 years old. This form of
average is a point estimate of that
population average age at first
marriage.
INTERVAL ESTIMATION
𝐗 ± 𝐙 𝛂/𝟐
𝛔
𝐧
𝛂/𝟐𝛂/𝟐
𝐏 ± 𝐙 𝛂/𝟐
𝐩 𝐪
𝐧
If our previous example takes the following
form 26.4 < 𝝁 > 𝟐𝟕. 𝟔 Then, it was
produced using the interval estimation and
by constructing confidence intervals which
is a range where 𝝁 may fall in the range.
SAMPLE SIZE
DETERMINANTS
MINIMUM SAMPLE SIZE FOR
INTERVAL ESTIMATE OF A
POPULATION
For mean
𝒏 =
𝐙 𝛂/𝟐 .𝝈
𝑬
𝟐
For proportion
n= 𝒑 𝒒
𝐙 𝛂/𝟐
𝑬
𝟐
Correction formula
𝒏 =
𝒏 𝟎
𝟏 +
𝒏 𝟎 − 𝟏
𝑵
Bibliograph
1. Bluman G. Allan (2004). Elementary statistics: Step by
step approach (5th ed.). New york, USA. The
McGrow Hill companies.
2. Glasow A. Priscilla (2005). Fundamentals of survey
research methodology. Washington, USA.
MITRE PRODUCT.
3. Newman L.W. (2014). Social research methods:
Qualitative and quantitative approaches (7th ed.).
USA. Pearson Education limited.
4. Retzer F. karen. (2003). Introduction to survey
sampling: Survery research laboratory.
University of Illinois at Chicago. www.srl.uic.edu
Bibliography
5. Kraemer, K. L. (1991). Introduction. Paper
presented at The Information Systems
Research Challenge: Survey Research
Methods.

Survey sampling techniques

  • 1.
    SURVEY SAMPLING TECHNIQUES SAY 701 SurveyResearch Methodology Institute of Population Studies Hacettepe University By Abdirahman S. Mohamed
  • 2.
  • 3.
  • 4.
  • 5.
    SAMPLING IN THE SURVEYPROCESS Implementing Designing
  • 7.
  • 8.
  • 9.
    Probability of selection= 𝒏 𝑵 Non-zeroand known probability of being selected into the sample Probability Sampling
  • 10.
    PROBABILITY SAMPLING Simple random sample Creating sapling frame  Creating random numbers  With replacement/without replacement Systematic random sampling  Very similar to simple random sampling  Sampling interval  Fails in organized populations Sampling interval = 𝐍 𝐧 Stratified Sampling  Dividing population into sub-population (strata)  Controlling the relative size of each sub- population (stratum)  Adopting either simple or systematic sampling for selecting elements. Cluster sampling  Addresses lack of good sampling frame and  High cost to reach sampled elements
  • 11.
    PROBABILITY SAMPLING Multistage Sampling Type of selection procedure  Sampling design involves multiple stages(levels) and clusters. Probability proportionate to size (PPS)  One way to draw cluster/stratified samples  Is used when clusters/strata do not have same number of sampling elements (size)
  • 12.
    NON-PROBABILITY SAMPLING Purposive sampling (Judgmental) valuable in exploratory and field research  Relies on prior specific purpose in mind.  Inappropriate in representation Snowball sampling  Appropriate in studying interconnected societies or network societies.  It starts with few people and spreads out Deviant case sampling  It is used to study cases that differ from the general pattern or characteristic  The target is to place unusual cases . Sequential sampling  Similar to purposive sampling  Reaching as many relevant cases as possible Theoretical Sampling  Sample selection is entirely guided by the emerging theory 
  • 13.
    QUANTITATIVE SURVEY QUALITATIVE SURVEY  Exploratory  Understanding Descriptive  Explanatory Mainly uses Non-probability sampling Mainly uses probability random sampling
  • 14.
    ESTIMATION Point Estimation SAMPLE POPULATION Let’s saythat the average age at first marriage of a particular population e.g. 27 years old. This form of average is a point estimate of that population average age at first marriage.
  • 15.
    INTERVAL ESTIMATION 𝐗 ±𝐙 𝛂/𝟐 𝛔 𝐧 𝛂/𝟐𝛂/𝟐 𝐏 ± 𝐙 𝛂/𝟐 𝐩 𝐪 𝐧 If our previous example takes the following form 26.4 < 𝝁 > 𝟐𝟕. 𝟔 Then, it was produced using the interval estimation and by constructing confidence intervals which is a range where 𝝁 may fall in the range.
  • 16.
  • 17.
    MINIMUM SAMPLE SIZEFOR INTERVAL ESTIMATE OF A POPULATION For mean 𝒏 = 𝐙 𝛂/𝟐 .𝝈 𝑬 𝟐 For proportion n= 𝒑 𝒒 𝐙 𝛂/𝟐 𝑬 𝟐 Correction formula 𝒏 = 𝒏 𝟎 𝟏 + 𝒏 𝟎 − 𝟏 𝑵
  • 18.
    Bibliograph 1. Bluman G.Allan (2004). Elementary statistics: Step by step approach (5th ed.). New york, USA. The McGrow Hill companies. 2. Glasow A. Priscilla (2005). Fundamentals of survey research methodology. Washington, USA. MITRE PRODUCT. 3. Newman L.W. (2014). Social research methods: Qualitative and quantitative approaches (7th ed.). USA. Pearson Education limited. 4. Retzer F. karen. (2003). Introduction to survey sampling: Survery research laboratory. University of Illinois at Chicago. www.srl.uic.edu
  • 19.
    Bibliography 5. Kraemer, K.L. (1991). Introduction. Paper presented at The Information Systems Research Challenge: Survey Research Methods.