SlideShare a Scribd company logo
1 of 63
Supply Chain Management
● The supply chain is the sequence of suppliers and
organizational buyers that spans all stages of
processing from raw materials to final customers.
● Supply chain management (SCM) involves managing
the external resources, i.e., those sources of goods and
services that are not under direct corporate control.
● It is the integration of the required activities to achieve
a sustainable competitive advantage,
Syllabus Highlights
Course Summary
This course is grounded in the new reality of globalization in
the production
and delivery of products and services. It is targeted to
practitioners who
participate in global production decision making to support
their
organization’s strategic and tactical supply chain goals.
It employs a variety of important and essential conceptual
theories,
qualitative concepts, and quantitative methodologies. Topics
that concern
the challenges faced by supply chain practitioners will be
addressed. Further,
the course addresses the integration of superior supply chain
and other
business practices across locations that are geographically
dispersed and
culturally diverse.
The products and services addressed include those that are
produced
offshore, those that are outsourced, and those that are produced
internally. They also span products and services that are mature
and those
that are new to the market. 6
Syllabus Highlights
9
Articles: During several weeks, all students will take part in a
set
of focused discussions that concern the material covered in the
lectures and the assigned articles.
Case Studies: Each of the case study assignments will evaluate
students’ ability to synthesize various aspects of the course and
apply them to a complex scenario. Analysis of a case study will
combine conceptual and cognitive elements.
Problem Set Assignments: Each of the problem set assignments
will evaluate students’ ability to apply the quantitative aspects
of
the course material. The problem set will require the use of
Excel
to practice developing or using a decision-making tool within a
global supply chain context. It will be an individual
assignment,
with a well-organized professional submittal.
Syllabus Highlights
10
Examinations: Two in-class exams will be given, on dates noted
above. The exams are closed book and notes. However, you
will
be allowed to use a one-page (double sided) sheet with notes
that
you create. Please bring a calculator to the exams (phones and
laptops cannot be used as calculators). In-class exams are not
cumulative and cover the material through the weeks indicated
on
the schedule. An entire class session will be devoted to the
final
exam. Check out more exam information on the Study Guide.
Syllabus Highlights
11
Course Summary
Sept. 5
Sept. 12
Lecture 1: Introduction to Global Supply Chains
Lecture 2: Supply Chain Strategy and Challenges
Sept. 19
Sept. 26
Lecture 3: Supply Chain Risks
Lecture 4: Time Series Forecasting
Oct. 3
Oct. 17
Lecture 5: Performance Metrics
Lecture 6: Aggregate Planning
Oct. 24
Oct. 31
Nov. 7
Lecture 7: Buffering & Risk Pooling
Mid-term Exam
Lecture 8: Delayed Differentiation
Nov. 14
Nov. 28
Lecture 9: Supply Chain Optimization
Lecture 10: Service Supply Chains and Logistics
Dec. 5
Dec. 12
Lecture 11: Use of Analytics in Supply Chains
Lecture 12: Business Function Integration
Dec. 19 Final Exam
The Supply Chain
Lecture 1- Introduction to
Global Supply Chains
SCM
SupplierSupplier
Supplier
Supplier Supplier
Supplier A Supplier DSupplier B Supplier C
Supply Chain Components
Supplier
Customers
2nd-Tier Suppliers
1st-Tier Suppliers
3rd-Tier Suppliers
4th-Tier Suppliers
Supply Chain Components (Example)
15
Suppliers
DownstreamUpstream
Logistics
Inbound
Logistics
Raw
Materials
Distributors
Retailers
Users
Suppliers (e.g.,
foil, cardboard)
Raw
Material
Suppliers
(e.g.,
multiple
vendors)
Logistics
(land)
Logistics
(air)
Packing
(Mexico)
Logistics
(sea)
Small Customer
Large Customer
(e.g., Wal-Mart , Target)
Consumers
Plastics Molding
(E. Europe)
A Global Supply Chain
Warehouse
16
ABS Plastic –
the raw
material used
to mold LEGO
bricks.
A LEGO “die” –
used to shape
melted plastic into
bricks (made in
Germany).
A LEGO mold – placed in an
injection molding machine
and used to produce bricks in
large quantities (mainly in
Eastern Europe).
LEGO
headquarters
in Billund,
Denmark.
17
LEGO bricks
produced in
large batches.
LEGO bricks
shipped to
Mexico.
LEGO bricks
stored prior to
shipment to
Mexico.
LEGO bricks
moved to the
packing facility.
18
http://www.stellacompanygroup.com/images/services/liner_and_
shipping.jpg
LEGO bricks
stored prior
to packing.
Pre-pack
packing into
foil bags.
Packing into
various
sized boxes.
Pre-packs
stored in
warehouse.
19
LEGO sets stored in
distribution center.
LEGO sets
shipped to
customers
(i.e., retailers).
LEGO sets
purchased by
consumers.
LEGO sets transported
to distribution facility.
20
http://www.geocities.com/WestHollywood/9172/Enfield/wh2.jp
g
http://images.google.com/imgres?imgurl=http://images.business
week.com/ss/06/12/1227_inhouse_brands/image/8_wal-
mart.jpg&imgrefurl=http://images.businessweek.com/ss/06/12/1
227_inhouse_brands/source/8.htm&h=453&w=440&sz=87&hl=e
n&start=5&um=1&tbnid=0YgrmIHD-
b6DbM:&tbnh=127&tbnw=123&prev=/images?q=wal-
mart&um=1&hl=en&rls=com.microsoft:en-us:IE-
SearchBox&rlz=1I7ADBF&sa=G
http://images.google.com/imgres?imgurl=http://www.lego.com/i
nfo/images/children1.jpg&imgrefurl=http://www.lego.com/eng/i
nfo/default.asp?page=pressdetail&contentid=503&countrycode=
2057&yearcode=2002&oldXML=true&archive=true&h=849&w=
1066&sz=834&hl=en&start=2&um=1&tbnid=C8KkukJkPanRtM
:&tbnh=119&tbnw=150&prev=/images?q=lego+child&um=1&hl
=en&rls=com.microsoft:en-us:IE-SearchBox&rlz=1I7ADBF
Customers want availability,
flexibility and cost-effective
solutions
Suppliers want
predictability &
certainty
shareholders want
growth &
profitability
21
Wants, Needs, and Expectations
http://images.google.com/imgres?imgurl=http://images.business
week.com/ss/06/12/1227_inhouse_brands/image/8_wal-
mart.jpg&imgrefurl=http://images.businessweek.com/ss/06/12/1
227_inhouse_brands/source/8.htm&h=453&w=440&sz=87&hl=e
n&start=5&um=1&tbnid=0YgrmIHD-
b6DbM:&tbnh=127&tbnw=123&prev=/images?q=wal-
mart&um=1&hl=en&rls=com.microsoft:en-us:IE-
SearchBox&rlz=1I7ADBF&sa=G
Example: New Toy Sales
Forecasts are made before the year starts & revised monthly,
based on current sales activity.
22
Sa
le
s
Jan DecApril July
All sales are expected to follow a
seasonal pattern, but popularity
of each product is uncertain.
Oct
Strategic Need for SCM
● Total supply chain costs represent better than
half of the total operating expenses for most
organizations
● The broader concept of the supply chain
includes the supply, storage, and movement of
materials, information, personnel, equipment,
and finished goods within the organization and
between it and its business environment
● The objective of SCM is to integrate the entire
process of satisfying the customer’s needs all
along the supply chain
Supply Chain Strategy
● Supply chain strategy needs to be tailored to meet
the needs of the customers which is multifaceted:
cost; quality; timeliness; reliability; etc.
– In situations where the goods are basic commodities
with standard benefits (food, home supplies,
standard clothing), then cost reduction is often the
focus
– In fashion goods, timeliness may be the focus of the
supply chain
– In high technology, new functionality may be more
important than cost
Supply Chain Strategy
● When operating in multiple markets, producers
may need a different supply chain for each
● Many organizations choose to outsource
portions of their requirements to third-party
companies
– Allows a firm to focus on its core
competencies
– Reduces capital investment
– Gains access to best practices
Management Goals
● BETTER: Maximize quality for customers:
– product (e.g., meets design specifications).
– service (satisfies customers’ needs and wants).
● COST EFFECTIVE: Minimize costs for
manufacturers/suppliers:
– low production/distribution costs.
– high resource utilization.
● FASTER: Minimize lead time for customers:
– B2B (e.g., meets lead time agreement).
– B2C (e.g., good availability & responsiveness).
● SUSTAINABLE: Provide great solutions:
– Sustainable solutions and sustainable success
– Reduced wasted, defects, and burdens 26
Matching Supply w/Demand
• Dealing with complexity
– interconnected processes, geographical dispersion, cultural
differences, geopolitical issues, multiple stakeholders, etc.
• Dealing with ambiguity
– customer preferences, “hidden” costs and benefits, etc.
• Dealing with externally-imposed change
– competition, partners, suppliers, global economy, etc.
• Dealing with risks & uncertainty
– consumer demand, lead time variation, quality, natural &
made-made disasters, etc.
27
Sourcing Strategies
● Global sourcing is an important aspect of supply
chain outsourcing strategy
● Outsourcing is the process of contracting with
external suppliers for goods and services that
were previously provided internally
● One danger to outsourcing is being hollowed out
● More recent trend is outsourcing entire
production process to contract manufacturers
Purchasing/Procurement
● Obtaining quality materials and services at the right
cost when they are needed
● Identify and quality suppliers, negotiate contracts,
arrange transportation, oversee and manage
suppliers
● Important considerations include price, quality, lead
times, and reliability
● Manufacturing organizations spend an average of 55
percent of revenue for outside materials and services.
Value Analysis
● A special responsibility of purchasing, or purchasing
working jointly with engineering/design and
operations is to regularly evaluate the function of
purchased items or services, especially those that
are expensive or used in high volumes
● The goal is to either reduce the cost of the item or
improve its performance
Logistics
● Planning and controlling efficient, effective flows
of goods, services, and information from one
point to another
● Consists of inventories, distribution networks,
storage and warehousing, transportation,
information processing, and even production
● Logistic is taking on tremendous importance
Decision Making in Supply Chains
● Supply chain practices should not rely on a simplified set of
assumptions, for example:
– minimization of labor costs across the supply chain, or
– minimization of all inventory using lean production
throughout the supply chain.
● When multiple decision criteria are not accounted for,
several problems can be expected, for example:
– excessive overstocks and/or understocks,
– time spent recovering from unanticipated events, and/or
– high operating/distribution costs that reduce profitability.
32
The Principles of Supply
Chain Management
● A Systems Approach- a guiding philosophy pertaining to
the supply chain that all elements are important.
● Strategic Direction - the enterprise is moving in the same
direction.
● Critical Mass - Every level in the enterprise has sufficient
resources to achieve the goals.
● Effective use of resources - Every level of the enterprise
utilizes its resources effectively.
Key SCM Considerations
● Value system and the related supply chain
consider the important aspects of customer value
creation, integration, and sustainable success.
● Supply chain has many elements of the push
systems of production and pull systems of lean.
● Services sometimes include the customer in the
supply chain
Factors Driving SCM
● Procurement costs are increasing
● Increasing global competition
● Outsourcing
● Internet
● Shorter life cycles
● Greater supply chain complexity
● Increasing concern for the natural environment
Location
● Location is a key supply chain decision - facilities
relative to suppliers, producers, and customers
● Decision is divided into three stages
– Regional
– Community
– Site
● Some services may only be concerned with site
selection
Supply Chain Design
● The supply chain consists of the network of
organizations that supply inputs to the business
unit, the business unit itself, and the customers
● Supplier networks can include external suppliers
● A broad view of the process focuses management
attention on the entire process that creates value
rather than individual activities
Push vs. Pull Systems
● Operating systems can be broadly classified in two ways:
– push systems create inventory in anticipation of demand, and
– pull systems create inventory in response to demand.
● Manufacturing systems can be push or pull systems:
– push systems are often called “make to stock,” while
– pull systems are often called “make to order.”
● Service systems are almost always pull systems:
– the service cannot be initiated until the customer expresses a
need (e.g., radiology, troubleshooting, product design,
background check, etc.).
38
Main Planning/Execution Options
● For component parts that are used in finished products,
push and pull are managed differently.
● In push systems, MRP (material requirements planning) is
often used:
– a final schedule is “explored” into component parts – they are
made ahead of time to be available when needed.
● In pull systems, JIT (just in time) is often used:
– the subsequent step in the production system “signals” the
need for component parts from the previous step in the
production system.
39
Push–Pull (Hybrid) Supply Chain
Initial forecast &
determination of
inventory buffer by
product (large batches)
e.g., make
“safe” quantities
for each product
“Push” Production
Revised forecast &
determination of
capacity buffer by
resource (small batches)
e.g., weekly
replenishment
cycle
“Pull” Production
Jan Dec
40
Forecasting
41
● A forecast can be based on judgements (i.e., by humans),
models (i.e., by mathematical equations), or collaboration
(i.e., by organizations).
● A forecasting model is chosen based on its ability to
accurately predict the past
– and therefore less than effective when the future is not
perfectly aligned with the past.
● To be most effective, those providing forecasts should be
integrated with those who use forecasts to make decisions,
– but this sometimes not the case, especially in large
organizations.
Applications of Forecasts
● Long-range facility planning (many years)
– e.g., buildings, major equipment, location.
● Medium-range capacity planning (many months)
– e.g., machines, labor, tools.
● Short-term scheduling (many weeks or days)
– e.g., personnel, supplies.
The most obvious applications of forecasting are for
products that may be manufactured in global supply
chains, but forecasting is also important in services.
42
Buffering
● With INVENTORY, at a targeted level of product
manufacturing:
– raw material (most desirable)
– work-in-process (i.e., partially made products)
– final products (least desirable)
● With CAPACITY, for critical resources:
– labor
– equipment
– facilities
Buffering is may be necessary,
but excessive buffering is costly
and increases lead times.
43
Summary
Our focus is on:
– The System
– Customers and Stakeholders
– The Processes
– Measures of Success
– Relationships of the Players
– The External Environment
– Long Term
–
Article 1 Discussion
Made in America, Again (by Sirkin, Zinser, and Hohner) Boston
Consulting Group
For this article discussion, read the article listed above and
react as you deem
appropriate. For example, you may agree with a point being
made. Or, you have
provided additional information related to the topic but not
addressed in the article.
Or, you may disagree with a point being made. In every case,
you must provide
arguments that are supported with your specific experience or
publications (e.g.,
peer reviewed articles, magazine stories, or newspaper
accounts).
If you did not attend the class, you are required to create one
post (using 150-250
words); your response to another student’s post must be
completed by Day 7 at
11:59 PM.
Grades will be based on the criteria described in the Discussion
Participation Grades
table found in the syllabus.
45
Made in America, Again
Why Manufacturing Will Return to the U.S.
The Boston Consulting Group (BCG) is a global
management consulting firm and the world’s
leading advisor on business strategy. We partner
with clients in all sectors and regions to identify
their highest-value opportunities, address their
most critical challenges, and transform their
businesses. Our customized approach combines
deep insight into the dynamics of companies
and markets with close collaboration at all levels
of the client organization. This ensures that our
clients achieve sustainable competitive advan-
tage, build more capable organizations, and
secure lasting results. Founded in 1963, BCG is a
private company with 74 offices in 42 countries.
For more information, please visit www.bcg.com.
Made in America, Again
Why Manufacturing Will Return to the U.S.
Harold L. Sirkin, Michael Zinser, and Douglas Hohner
August 2011
Made in America, Again2
China’s overwhelming manufacturing cost advantage over the
U.S. is shrinking fast.
Within five years, a Boston Consulting Group analysis
concludes, rising Chinese
wages, higher U.S. productivity, a weaker dollar, and other
factors will virtually close
the cost gap between the U.S. and China for many goods
consumed in North
America.
LOOK AT TOTAL COSTS
Companies should undertake a rigorous, product-by-product
analysis of their global
supply networks that fully accounts for total costs, rather than
just factory wages.
For many products sold in North America, the U.S. will become
a more attractive
manufacturing option.
REASSESS YOUR CHINA STRATEGY
For many products that have a high labor content and are
destined for Asian
markets, manufacturing in China will remain the best choice
because of technologi-
cal leadership or economies of scale. But China should no
longer be treated as the
default option.
AT A GLANCE
The Boston Consulting Group 3
For more than a decade, deciding where to build a
manufacturing plant to supply the world was simple for many
companies. With its seemingly limitless
supply of low-cost labor and an enormous, rapidly developing
domestic market, an
artificially low currency, and significant government incentives
to attract foreign
investment, China was the clear choice.
Now, however, a combination of economic forces is fast eroding
China’s cost advan-
tage as an export platform for the North American market.
Meanwhile, the U.S.,
with an increasingly flexible workforce and a resilient corporate
sector, is becoming
more attractive as a place to manufacture many goods consumed
on this continent.
An analysis by The Boston Consulting Group concludes that, by
sometime around
2015—for many goods destined for North American
consumers—manufacturing in
some parts of the U.S. will be just as economical as
manufacturing in China. The
key reasons for this shift include the following:
Wage and benefit increases of 15 to 20 percent per year at the
average Chinese •
factory will slash China’s labor-cost advantage over low-cost
states in the U.S.,
from 55 percent today to 39 percent in 2015, when adjusted for
the higher
productivity of U.S. workers. Because labor accounts for a
small portion of a
product’s manufacturing costs, the savings gained from
outsourcing to China
will drop to single digits for many products.
For many goods, when transportation, duties, supply chain
risks, industrial real •
estate, and other costs are fully accounted for, the cost savings
of manufacturing
in China rather than in some U.S. states will become minimal
within the next
five years.
Automation and other measures to improve productivity in
China won’t be •
enough to preserve the country’s cost advantage. Indeed, they
will undercut the
primary attraction of outsourcing to China—access to low-cost
labor.
Given rising income levels in China and the rest of developing
Asia, demand for •
goods in the region will increase rapidly. Multinational
companies are likely to
devote more of their capacity in China to serving the domestic
Chinese as well
as the larger Asian market, and to bring some production work
for the North
American market back to the U.S.
Manufacturing of some goods will shift from China to nations
with lower labor •
costs, such as Vietnam, Indonesia, and Mexico. But these
nations’ ability to
Made in America, Again4
absorb the higher-end manufacturing that would otherwise go to
China will be
limited by inadequate infrastructure, skilled workers, scale, and
domestic supply
networks, as well as by political and intellectual property risks.
Low worker
productivity, corruption, and the risk to personal safety are
added concerns in
some countries.
This reallocation of global manufacturing is in its very early
phases. It will vary
dramatically from industry to industry, depending on labor
content, transportation
costs, China’s competitive strengths, and the strategic needs of
individual compa-
nies. But we believe that it will become more pronounced over
the next five years,
especially as companies face decisions about where to add
future capacity. While
China will remain an important manufacturing platform for Asia
and Europe, the
U.S. will become increasingly attractive for the production of
many goods sold to
consumers in North America.
This report, the first in a series, examines the economic trends
that point to a U.S.
manufacturing renaissance. It also explores the strategic
implications of the shifting
cost equation for companies engaged in global sourcing.
The U.S. “Decline” and Renaissance in Perspective
The death of American manufacturing has been foretold many
times in the past
four decades. As the only major industrialized nation not
leveled by World War II,
the U.S. accounted for around 40 percent of the world’s
manufactured goods in the
early 1950s. But then, fueled by a relentless wave of imports
from a reconstructed
Europe and eventually from Japan, the U.S. experienced a
dramatic loss of market
share in industries such as color TVs, steel, cars, and computer
chips. In the 1970s
and 1980s, fears of the loss of U.S. industrial competitiveness
were particularly
acute, prompting a widespread debate over whether the nation
should adopt a
“Japan Inc.”-style industrial policy and teach its schoolchildren
to speak Japanese.
Then came the rise of such East Asian Tigers as South Korea
and Taiwan, which led
to a massive transfer of production of labor-intensive goods,
including apparel,
shoes, and toys, and then of much of the U.S. computer and
consumer-electronics
manufacturing industry.
The U.S. suffered through many painful adjustments to these
challenges. Unlike
most nations, however, it quickly ripped off the Band-Aid and
allowed industry to
adapt. Factories closed, companies failed, banks wrote off
losses, and workers had
to learn new skills. But U.S. industry and the economy
responded with surprising
flexibility and speed to reemerge more competitive and
productive than ever. By
the late 1990s, American companies dominated the world in
high-value industries
such as microprocessors, aerospace, networking equipment,
software, and pharma-
ceuticals. Manufacturing investment, output, and employment
surged.
It may not be obvious yet, but the U.S. manufacturing sector is
today in the midst
of a similar process of readjustment in response to perhaps its
greatest competitive
threat ever—the rise of China. Since opening its doors to
foreign investment and
trade, China has offered a virtually unbeatable combination of
seemingly limitless
cheap labor (less than $1 per hour), a growing pool of
engineers, a fixed currency,
The reallocation of
global manufacturing
will become more
pronounced over the
next five years,
especially as compa-
nies face decisions
about where to add
future capacity.
The Boston Consulting Group 5
and local governments willing to offer inexpensive land, free
infrastructure, and
generous financial incentives.
In the decade since it entered the World Trade Organization
(WTO) in 2001, China
has essentially become the default option for companies wishing
to outsource
production in order to lower costs. From 2000 to 2009, China’s
exports leapt nearly
fivefold, to $1.2 trillion, and its share of global exports rose
from 3.9 percent to
9.7 percent, according to United Nations Conference on Trade
and Development
data. These developments occurred in a remarkable breadth of
industries, from
labor-intensive assembly work to heavy industry and high-tech.
China’s portion of
global apparel exports increased from 17.4 percent to 32.1
percent, for example. Its
share of the world export market for furniture soared from 7.5
percent to 25.9 per-
cent, for ships from 4.1 percent to 19.6 percent, for telecom
equipment from
6.5 percent to 27.8 percent, and for office machines and
computer equipment from
4.9 percent to 32.6 percent. In the U.S., meanwhile, the loss of
some 6 million
manufacturing jobs and the closure of tens of thousands of
factories over the past
decade has fanned frequent warnings of a manufacturing crisis.
The Tide Is Turning
Once again, however, predictions of the demise of American
manufacturing are
likely to prove wrong. The U.S. manufacturing sector remains
robust. Output is
almost two and a half times its 1972 level in constant dollars,
even though employ-
ment has dropped by 33 percent. Despite the recent wave of
outsourcing to China,
the value of U.S. manufacturing output increased by one-third,
to $1.65 trillion, from
1997 to 2008—before the onset of the recession—thanks to the
strongest productiv-
ity growth in the industrial world. Although China accounted
for 19.8 percent of
global manufacturing value added in 2010, the U.S. still
accounted for 19.4 per-
cent—a share that has declined only slightly over the past three
decades.
The conditions are coalescing for another U.S. resurgence.
Rising wages, shipping
costs, and land prices—combined with a strengthening
renminbi—are rapidly
eroding China’s cost advantages. The U.S., meanwhile, is
becoming a lower-cost
country. Wages have declined or are rising only moderately.
The dollar is weaken-
ing. The workforce is becoming increasingly flexible.
Productivity growth continues.
Our analysis concludes that, within five years, the total cost of
production for many
products will be only about 10 to 15 percent less in Chinese
coastal cities than in
some parts of the U.S. where factories are likely to be built.
Factor in shipping,
inventory costs, and other considerations, and—for many goods
destined for the
North American market—the cost gap between sourcing in
China and manufactur-
ing in the U.S. will be minimal. In some cases, companies will
move work to inland
China to find lower wages. But this will not be an attractive
option in many indus-
tries. Chinese cities in the interior provinces lack the abundance
of skilled workers,
supply networks, and efficient transportation infrastructure of
those along the
coast, offsetting much of the savings afforded by slightly lower
labor costs.
When all costs are taken into account, certain U.S. states, such
as South Carolina,
Alabama, and Tennessee, will turn out to be among the least
expensive production
The U.S. is becoming
a lower-cost country,
with a workforce that
is increasingly flexible
and productivity
growth continuing.
Made in America, Again6
sites in the industrialized world. As a result, we expect
companies to begin building
more capacity in the U.S. to supply North America. The early
evidence of such a
shift is mounting.
NCR moved production of its ATMs to a plant in Columbus,
Georgia, that will •
employ 870 people by 2014.
The Coleman Company is moving production of its 16-quart
wheeled plastic •
cooler from China to Wichita, Kansas, owing to rising Chinese
manufacturing
and shipping costs.
Ford Motor Company is bringing up to 2,000 jobs back to the
U.S. in the wake of •
a favorable agreement with the United Auto Workers that allows
the company
to hire new workers at $14 per hour.
Sleek Audio has moved production of its high-end headphones
from Chinese •
suppliers to its plant in Manatee County, Florida.
Peerless Industries will consolidate all manufacturing of audio-
visual mounting •
systems in Illinois, moving work from China in order to achieve
cost efficiencies,
shorter lead times, and local control over manufacturing
processes.
Outdoor Greatroom Company moved production of its fire pits
and some •
outdoor shelters from China to the U.S., citing the
inconvenience of having to
book orders from Chinese contractors nine months in advance.
The reallocation of production is still in its early stages, but we
believe it will
accelerate in the years ahead. The impact of the changing cost
equation will vary
from industry to industry. Products in which labor accounts for
a small portion of
total costs and in which volumes are modest, such as auto parts,
construction
equipment, and appliances, will be among those that companies
reevaluate in
terms of their options for supplying the North American market.
But the manufac-
ture of goods with relatively higher labor content that are
produced in high vol-
umes will likely remain in China. Finally, companies that make
mass-produced,
labor-intensive products, like apparel and shoes, may move
production from China
to other low-cost nations. (We will assess the implications of
the new manufactur-
ing math for specific industries in the second report in this
series.)
These trends do not suggest that Chinese manufacturing will
decline or that multi-
national companies will shut their mainland plants. More
Chinese production
capacity will be devoted to supplying the country’s enormous
domestic market,
which is gaining millions of new middle-class households each
year, as well as other
growing economies in Asia. In addition, China will continue to
remain a low-cost
supplier to Western Europe. And China will remain competitive
in industries that
have developed strong “clusters of excellence” and that have an
immense installed
base of production capacity and component and material
suppliers.
This means that when it comes to building new production
capacity, companies will
likely choose to explore alternatives instead of automatically
opting for China. Over
The manufacture of
goods with relatively
high labor content
that are produced in
high volumes will
likely remain
in China.
The Boston Consulting Group 7
the next five years, we believe that the U.S. will be the optimal
choice for many
manufacturing investments aimed at serving the North American
market.
The New Manufacturing Math
A combination of factors is starting to dramatically shift the
manufacturing cost
equation in favor of the U.S.
China’s Rising Wages
Rising labor rates have been a fact of life in Chinese factories
for years. Average
wages leapt by 150 percent from 1999 through 2006, for
example, a period in which
China emerged as the world’s workshop for a range of
industries. Those increases
started from a low base, but now the tipping point is in sight.
For one thing, wage
growth has accelerated much faster than productivity growth.
From 2000 through
2005, pay and benefits for the average Chinese factory worker
rose by 10 percent
annually. (See Exhibit 1.) From 2005 through 2010, wage hikes
averaged 19 percent
per year, while the fully loaded cost of U.S. production workers
rose by only 4 per-
cent. The last few years have been especially volatile in China.
In 2010, the giant
contract manufacturer Foxconn International, which employs
920,000 people in
China alone, doubled wages at its immense Shenzhen campus
following a string of
worker suicides. After a factory supplying Honda was hit by
strikes last year, wages
rose by 47 percent. Minimum wages rose by more than 20
percent in 20 Chinese
regions, and by up to 30 percent in Sichuan province.
Average wages could approach 17 percent of those
in the U.S. by 2015, up from 3 percent in 2000
China
U.S. 2
10
4
19
2000–2005
(%)
2010–2015
(%)
3
17
CAGR
2005–2010
(%)
Ratio of
average
Chinese
to average
U.S. wage
rates
2009
2008
2007
2006
2005
18.8
2004
2003
2002
2001
2000
0.5
16.6
Fully loaded factory-worker wages ($/hour)
30
25
20
15
10
5
0
4%
9%
17%
2015E
26.1
2014E
2013E
2012E
2011E
2010
2.0
22.3
3%
4.5
0.8
Sources: Economist Intelligence Unit; U.S. Bureau of Labor
Statistics; selected company data; BCG analysis.
Exhibit 1 | China's Wage Rates Are Growing Rapidly
Made in America, Again8
BCG’s research projects that over the next five years, the fully
loaded cost of
Chinese workers in the Yangtze River Delta, which includes
Shanghai and the
provinces of Zhejiang and Jiangsu, will rise by an annual
average of 18 percent, to
about $6.31 per hour. This region has the highest manufacturing
output in the
country and is the heart of such high-skilled industries as
automobiles and electron-
ics. Chinese compensation packages will then be equal to about
25 percent of what
skilled workers are earning in the manufacturing states of the
southern U.S. While
this gap may still seem huge, consider that factory workers in
the Yangtze River
Delta averaged only 72 cents per hour in 2000, compared with
$15.81 per hour in
the U.S. South.
It is also possible that this trend will accelerate. Chinese labor
organizations are
gaining a greater ability to demand higher wages and benefits
from foreign compa-
nies. The government is enacting new labor laws that give
greater rights to workers,
requiring, for example, that companies pay laid-off workers one
month’s salary in
severance for every year that they worked.
Productivity Insufficient to Offset Wage Increases
One common belief is that rising Chinese productivity will
compensate for rising
wages. Indeed, manufacturing output per worker in China has
improved by an
average of 10 percent per year over the past decade, nearly five
times the pace of
U.S. productivity growth. Although we forecast that Chinese
productivity growth
will remain impressive, at 8.5 percent annually over the next
five years, output
per worker will increase at only half the pace of the rise in
wages. (See Exhibit 2.)
This means that productivity-adjusted costs are rising, which in
the past was not
always the case.
Chinese productivity relative to U.S. productivity (%)
80
60
40
20
100
0
2015 2014 2013 2012 2011 2010 2009 2008 2007 2006 2005
2004 2003 2002 2001 2000
40
29
20
13
Growing at nearly 10 percent per year, China’s productivity
could reach 40 percent of U.S. productivity by 2015
Average unit productivity, CAGR
2000–2010
(%)
U.S.: ~2
China: ~10
Average unit productivity, CAGR
2010–2015
(%)
U.S.: ~1
China: ~8.5
Sources: Economist Intelligence Unit; U.S. Bureau of Labor
Statistics; BCG analysis.
Note: All figures are based on real units.
Exhibit 2 | China’s Productivity Gains Will Lag Behind Wage
Increases
The Boston Consulting Group 9
Add in the difference in productivity itself, and the cost gap
between Chinese and
U.S. manufacturing shrinks much further. Adjusted for output
per worker, the
average cost of Chinese labor was 22 percent that of U.S. labor
in 2005. By 2010,
average Chinese labor costs had risen to 31 percent of the U.S.
level. Although the
Yangtze River Delta is more productive than other regions in
China, the gap in
wages is quickly closing there, as well. The hourly Chinese
factory wage adjusted for
productivity was $8.62 in the region in 2010, compared with
$21.25 in the U.S.
South. In 2015, labor adjusted for productivity will cost $15.03
an hour in the
Yangtze River Delta, compared with a projected $24.81 in the
U.S. South.
While it may appear that Chinese wages are still much lower,
keep in mind that
labor is only part of the cost of making a product. The labor
content ranges from
only about 7 percent for products like video cameras to about 25
percent for a
machined auto part. When transportation, duties, and other costs
are included, not
to mention the expected continued appreciation of China’s
currency, companies
may find that any cost savings to be gained from sourcing in
China may not be
worth the time and myriad risks and headaches associated with
operating a supply
chain extending halfway around the world.
To illustrate how the math is changing, let’s look at a
hypothetical part for a car
assembled in the U.S. One option is to make the part in the U.S.
South—say, in South
Carolina. The alternative is to make it in the Yangtze River
Delta. (See Exhibit 3.)
In 2000, it would have made economic sense to source the part
in China, where
wages were about 20 times lower. Now fast-forward to 2015.
The U.S. labor cost for
the part will come to $3.31. At a factory in the Yangtze River
Delta, workers will still
2000 2015E
Wage rate ($/hour) 15.81 24.81
Productivity (%) 100 100
Labor cost/part ($) 2.11 3.31
Wage rate ($/hour) 0.72 6.31
Productivity (%)1 13 42
Labor cost/part ($) 0.74 2.00
Labor cost savings (%) 65 39
Total cost savings before
transportation, duties,
and other costs (%)
16 10
Imagine a
company...
...with the following
choices of location
• U.S.-based auto parts
supplier
• Most customers are U.S.
OEMs that manufacture
in the U.S.
U.S.,
selected
southern
states
China,
Yangtze
River
Delta
• Flexible unions/
workforce
• Minimal wage
growth
• High worker
productivity
• Scarce labor
• Rapidly rising
wages
• Low productivity
relative to the U.S.
• Parts require eight
minutes of labor, on
average, in the U.S.
• Labor represents
one-quarter of the
total cost of the part
Sources: Economist Intelligence Unit; U.S. Bureau of Labor
Statistics; BCG analysis.
1Average productivity difference between the U.S. and China's
Yangtze River Delta. Productivity in the Yangtze River Delta
region is assumed to
grow at a CAGR of ~7 percent over a 2009 baseline, slightly
slower than overall Chinese manufacturing productivity (~8.5%)
as other regions adopt
more advanced manufacturing practices.
Exhibit 3 | Economics Will Drive Reinvestment in the U.S.
Made in America, Again10
be earning only one-quarter of their U.S. counterparts’ wages.
However, even with
massive productivity improvements, output per worker at the
Chinese factory will
be only 42 percent that of a southern U.S. plant. So the Chinese
labor cost for the
part will be $2.00, bringing the savings down to 39 percent.
Moreover, since labor
represents approximately one-quarter of the total cost of making
the part, the total
savings will shrink further, to less than 10 percent.
Thus, the cost savings, if any, are unlikely to be enough to
justify outsourcing the part
to China, once all the other costs and risks are taken into
account. If this trend contin-
ues through 2020, say, the equation might even reverse itself
completely—with
manufacture in the U.S. being cheaper even before those added
costs are considered.
The Limits of Automation
It might seem that greater investment in automation would solve
the problem of
China’s lower productivity. Multinational companies would
merely have to install
the same equipment used in their factories at home. That,
however, would under-
cut the chief competitive advantage of manufacturing in
China—low labor costs.
Automation reduces a product’s labor content. Despite the
greater productivity that
automation would afford, China’s total cost advantage over the
U.S. would likely not
increase significantly as a result.
Take a kitchen appliance for which labor accounts for 20
percent of the cost. (See
Exhibit 4.) In 2005, the product’s labor cost in a typical
Chinese factory would have
been 61 percent lower than in the U.S., and the total cost before
supply chain costs
would have been about 21 percent lower, accounting for
productivity differences.
By 2015, higher Chinese wages will have shrunk that total cost
advantage to 13 per-
cent. Now assume that the factory in China installs production
lines identical to
those in the U.S. and that it achieves the same level of
productivity. Because of the
reduced labor content of the appliance and the costs of
operating the advanced
factory, the total savings from manufacturing in China would
improve only slightly,
to 15 percent, according to our analysis. Again, that is before
shipping, duties,
inventory costs, and other expenses. For such an appliance
intended for sale in
North America, many companies would probably decide to build
it domestically.
Other Expenses
Labor isn’t the only part of China’s changing cost equation. The
cost of electricity
has surged by 15 percent since 2010. Rising prices for imported
thermal coal and an
end to preferential rates for high-energy-consuming businesses
are also pushing up
utility rates for industry, which consumes 74 percent of China’s
electricity.
In addition, industrial land is no longer cheap in China. In fact,
commercial prices
are dramatically higher than in most of the U.S. For example,
industrial land costs
$11.15 per square foot in the coastal city of Ningbo, $14.49 in
Nanjing, $17.29 in
Shanghai, and $21 in Shenzhen. The national average is $10.22
per square foot.
Industrial land in Alabama, by contrast, costs only $1.86 to
$7.43 per square foot; in
Tennessee and North Carolina, the price ranges from $1.30 to
$4.65. To secure low
real-estate costs in China, companies will need to move inland.
But in so doing, they
will incur higher transportation costs and lose some of the
benefits of being part of
the industrial clusters that have grown up in the major coastal
cities.
Greater investment
in automation
would undercut the
chief competitive
advantage of
manufacturing
in China—low
labor costs.
The Boston Consulting Group 11
Transpacific shipping rates are going up, too. While ocean
freight remains inexpen-
sive, the doubling of bunker-fuel prices since early 2009 is
causing rates to increase.
Rising oil prices, a falloff in new shipbuilding, and a projected
shortage in container
port capacity in 2015 are expected to boost ocean freight rates.
The steady appreciation of the renminbi against the U.S. dollar,
meanwhile, is further
increasing the price of Chinese exports to the U.S. We expect
that trend to continue.
Finally, there are the many costs and headaches of relying on
extended supply
chains. These include inventory expenses, quality control
problems, unanticipated
travel needs, and the threat of supply disruptions due to port
closures or natural
disasters. With China, there are added concerns about
intellectual-property theft
and trade disputes that result in punitive duties. In response to a
petition by the
United Steelworkers, for instance, the U.S. in 2010 began
investigating subsidies of
Chinese green-technology products, such as wind turbines and
solar panels, for
possible unfair trade practices. In September 2009, the U.S.
imposed extra duties
of 25 to 35 percent on certain Chinese car and truck tires under
a WTO “safe-
guard” provision that allows countries to curb surges of Chinese
imports that
cause market disruptions.
Other Low-Cost Countries
It might seem reasonable for many companies to look for
sourcing opportunities in
other low-cost nations and to shift much of their export
manufacturing from China
to these cheaper locations. Fully loaded hourly manufacturing
wages average $1.80
60
40
20
0
2015
100
15
75
2015E
42
13
39
2010
27
16
44
2005
19
21
61
2000
13
25
66
Cost savings (%)
100
80
China’s productivity relative to U.S. productivity (%)
Total cost savings in China (%)
Labor cost savings in China (%)1
Product with 20 percent labor content
(China’s productivity
assumed to be equal
to U.S. productivity)
Total savings before
supply chain costs
Source: BCG analysis.
1Total labor cost in China divided by total labor cost in the U.S.
Exhibit 4 | Increased Automation in China Is Unlikely to
Change the Cost Equation
Made in America, Again12
in Thailand, 49 cents in Vietnam, 38 cents in Indonesia, and 35
cents in Cambodia.
There has already been a significant transfer of work in apparel,
footwear, sporting
goods, and other labor-intensive products to South and
Southeast Asia.
Other low-cost nations won’t be able to absorb all the export
manufacturing that is
likely to leave China, however. A simple reason is that there is
no replacement for
China’s labor force. China not only has the world’s largest
population (1.34 billion),
it also has the highest proportion of able-bodied adults in the
workforce (84 per-
cent). Twenty-eight percent of those workers are employed by
industry, far more
than in Southeast Asia, indicating that China has an estimated
215 million industri-
al jobs. That is approximately 58 percent more than the
industrial workforce of all
of Southeast Asia and India combined. Chinese workers are also
more productive
than workers in other low-cost nations. Vietnamese workers
earn only 25 percent of
what their Chinese counterparts earn, but Chinese workers are
significantly more
productive, which mitigates much of the labor savings
advantage. What’s more, as
labor markets grow tighter, wages are rising fast in low-cost
Asian nations, as well.
Nor can many other low-cost nations match the first-rate
infrastructure, skilled
talent pool, well-developed supply networks, and worker
productivity of China’s
coastal industrial zones. Add to that the advantageous treatment
by Chinese
bureaucracies, from the central government down to the
villages, which have
showered foreign investors in targeted industries with
incentives and have speedily
cut through red tape. Indeed, for the manufacturing world,
China has been the
opposite of a perfect storm, offering a total package unlikely to
be matched by any
other low-cost nation.
Mexico, on the other hand, has the potential to be a big winner
when it comes to
supplying North America. It has the enormous advantage of
bordering the U.S.,
which means that goods can reach much of the country in a day
or two, as opposed
to at least 21 days by ship from China. Goods imported from
Mexico can also enter
duty-free, thanks to the North American Free Trade Agreement.
In addition, by
2015, wages in Mexico will be significantly lower than in
China. In 2000, Mexican
factory workers earned more than four times as much as Chinese
workers. After
China’s entry into the WTO in 2001, however, maquiladora
industrial zones border-
ing the U.S. suffered a large loss in manufacturing. Now that
has changed. By 2010,
Chinese workers were earning only two-thirds as much as their
Mexican counter-
parts. By 2015, BCG forecasts that the fully loaded cost of
hiring Chinese workers
will be 25 percent higher than the cost of using Mexican
workers.
Mexico’s gains will be limited, however, especially in higher-
value work now done
in China. Because of concerns over personal safety, skill
shortages, and poor infra-
structure, many companies will keep manufacturing high-end
products in the U.S.
The Role of Government Incentives
Governments in Asia and Europe have used generous financial
incentives to per-
suade multinational companies to build high-tech plants in
targeted industries.
Frequently they offered terms that the U.S. could not match,
such as ten-year
holidays from corporate taxes, cash grants, and cheap loans. In
recent years, the
federal government and many states have closed the gap with
aggressive incentive
Other low-cost
nations won’t be able
to absorb all the
export manufacturing
that is likely to leave
China. There is no
replacement for
China's labor force.
The Boston Consulting Group 13
packages, making the U.S. more competitive in the chase for
manufacturing facili-
ties. GlobalFoundries, for example, is receiving $1.3 billion in
cash reimbursements
and tax breaks over the next 15 years from the State of New
York to build a
$4.2 billion state-of-the-art silicon-wafer plant in Malta, New
York, and Nissan
received a $1.45 billion loan under the Advanced Technology
Vehicles Manufactur-
ing Program managed by the U.S. Department of Energy that
covered most of the
company’s $1.8 billion investment in a new plant in Tennessee.
While government subsidies won’t make a major difference in
determining whether
a plant is built in the U.S. instead of in Asia, they can make the
decision easier at a
time when other cost factors are shifting in favor of the U.S.
China’s Manufacturing Future
A U.S. resurgence will not diminish China’s role as a global
manufacturing power.
The nation’s immense domestic market, installed base across a
range of capital-
intensive industries, and pool of skilled talent guarantee that it
will be a rising force
in a range of manufacturing sectors.
Instead of pulling out of China, most multinational companies
will orient more of
their production to serve China and the rest of a growing Asia.
In nominal terms,
China’s economy is projected to be about two-thirds the size of
the U.S. economy by
2015. It is already slightly larger than Japan’s and will be
nearly twice as big in
another five years. Disposable income is expected to grow by
230 percent, to $5.57
trillion. Over the next five years, China will add nearly 90
million households
earning at least $9,000 per year.
China also will continue to be a major low-cost export base for
Western Europe,
even though the wage gap will narrow significantly. In 2010,
fully loaded wage costs
adjusted for productivity in the Yangtze River Delta were 25
percent of those in
Western Europe. In 2015, wages in the region will be only 38
percent of those in
Western Europe. This change will probably not be enough to
generate a tipping
point, so Europe will continue to rely on China as a primary
source of manufac-
tured products five years from now.
The Implications for Companies
The shifting cost structure between China and the U.S. will
present more manufac-
turing and sourcing choices. For many products that have a high
labor content and
are destined for Asian markets, manufacturing in China will
still make sense
because of technological leadership or economies of scale. But
China should no
longer be treated as the default option.
Companies should undertake a fresh, rigorous, product-by-
product analysis of their
global supply networks that takes into account the total cost of
production. Rather
than fixate on labor rates, this analysis should factor in worker
productivity, transit
costs, time-to-market considerations, logistical risks, energy
costs, and other expens-
es in a range of scenarios. Companies should also make sure
that their supply
chains are flexible, dynamic, and globally balanced, providing
the leeway to shift
A U.S. resurgence will
not diminish China’s
role as a global
manufacturing power.
Made in America, Again14
production and sourcing to other locations when the time is
right. And they should
weigh the many intrinsic advantages of locating manufacturing
close to consumers,
such as the ability to more quickly get products into the hands
of customers, replace
depleted inventory of popular items, and make design changes
in response to
market trends or customer demands.
In some cases, companies may find that now is the time it
makes tactical sense to
move some production away from China and into the U.S.,
Mexico, or Southeast
Asia. Manufacturers that remain in China for economic or
strategic reasons will
have to find dramatic ways to improve efficiency if they are to
preserve current
levels of profitability in the face of double-digit annual wage
hikes.
More-strategic decisions will have to be made when the time
comes to consider
where to build new manufacturing capacity to serve markets
outside of China. Our
analysis suggests that the U.S. will become an increasingly
attractive option, espe-
cially for products consumed in North America. As long as it
provides a favorable
investment climate and flexible labor force, the U.S. can look
forward to a manufac-
turing renaissance.
The Boston Consulting Group 15
About the Authors
Harold L. Sirkin is a senior partner and managing director in the
Chicago office of The Boston
Consulting Group and the author of GLOBALITY: Competing
with Everyone from Everywhere for Every-
thing. You may contact him by e-mail at [email protected]
Michael Zinser is a partner and managing director in the firm’s
Chicago office. You may contact
him by e-mail at [email protected]
Douglas Hohner is a partner and managing director in BCG’s
Chicago office. You may contact
him by e-mail at [email protected]
Acknowledgments
This report would not have been possible without the efforts of
Justin Rose, Chris Erickson, and
Jonas Bengtson of BCG’s project team. The authors also would
like to thank David Fondiller, Lexie
Corriveau, Beth Gillette, and Mike Petkewich for their guidance
and interactions with the media,
Pete Engardio for his writing assistance, and BCG’s editorial
and production staff, including Gary
Callahan, Angela DiBattista, Abby Garland, Sean Hourihan, and
Gina Goldstein.
For Further Contact
If you would like to discuss this Focus report, please contact
one of the authors.
For a complete list of BCG publications and information about
how to obtain copies, please visit our website at
www.bcg.com/publications.
To receive future publications in electronic form about this
topic or others, please visit our subscription website at
www.bcg.com/subscribe.
© The Boston Consulting Group, Inc. 2011. All rights reserved.
8/11
Abu Dhabi
Amsterdam
Athens
Atlanta
Auckland
Bangkok
Barcelona
Beijing
Berlin
Boston
Brussels
Budapest
Buenos Aires
Canberra
Casablanca
Chicago
Cologne
Copenhagen
Dallas
Detroit
Dubai
Düsseldorf
Frankfurt
Geneva
Hamburg
Helsinki
Hong Kong
Houston
Istanbul
Jakarta
Johannesburg
Kiev
Kuala Lumpur
Lisbon
London
Los Angeles
Madrid
Melbourne
Mexico City
Miami
Milan
Minneapolis
Monterrey
Moscow
Mumbai
Munich
Nagoya
New Delhi
New Jersey
New York
Oslo
Paris
Perth
Philadelphia
Prague
Rio de Janeiro
Rome
San Francisco
Santiago
São Paulo
Seoul
Shanghai
Singapore
Stockholm
Stuttgart
Sydney
Taipei
Tel Aviv
Tokyo
Toronto
Vienna
Warsaw
Washington
Zurich
bcg.com

More Related Content

Similar to Supply Chain Management ● The supply chain is the sequence.docx

Portfolio Management 2017
Portfolio Management 2017Portfolio Management 2017
Portfolio Management 2017
Chris Haller
 
Mike Danby Introduction (Dec 11 2014)
Mike Danby Introduction (Dec 11 2014)Mike Danby Introduction (Dec 11 2014)
Mike Danby Introduction (Dec 11 2014)
Mike Danby
 
New product development costing. Carles Debart
New product development costing. Carles DebartNew product development costing. Carles Debart
New product development costing. Carles Debart
Carles Debart
 
MCE Learning and Teaching Version 2.0 Page 1 of 6 Cour
MCE  Learning and Teaching Version 2.0  Page 1 of 6 CourMCE  Learning and Teaching Version 2.0  Page 1 of 6 Cour
MCE Learning and Teaching Version 2.0 Page 1 of 6 Cour
AbramMartino96
 
Mike Danby Introduction (Dec. 2014)
Mike Danby Introduction (Dec. 2014)Mike Danby Introduction (Dec. 2014)
Mike Danby Introduction (Dec. 2014)
Mike Danby
 

Similar to Supply Chain Management ● The supply chain is the sequence.docx (20)

L2.ppt
L2.pptL2.ppt
L2.ppt
 
Six ways to build circular business models
Six ways to build circular business modelsSix ways to build circular business models
Six ways to build circular business models
 
IVAR DDMRP journey v.06.1 | DDtech conference Bilbao 28 - 29 march 2019
IVAR DDMRP journey v.06.1 | DDtech conference Bilbao 28 - 29 march 2019IVAR DDMRP journey v.06.1 | DDtech conference Bilbao 28 - 29 march 2019
IVAR DDMRP journey v.06.1 | DDtech conference Bilbao 28 - 29 march 2019
 
Nantha Kumaran CV_1
Nantha Kumaran CV_1Nantha Kumaran CV_1
Nantha Kumaran CV_1
 
Products & processes
Products & processesProducts & processes
Products & processes
 
Introduction risk management
Introduction risk managementIntroduction risk management
Introduction risk management
 
Portfolio Management 2017
Portfolio Management 2017Portfolio Management 2017
Portfolio Management 2017
 
Ipi masterbroschuere 2016_small
Ipi masterbroschuere 2016_smallIpi masterbroschuere 2016_small
Ipi masterbroschuere 2016_small
 
Mike Danby Introduction (Dec 11 2014)
Mike Danby Introduction (Dec 11 2014)Mike Danby Introduction (Dec 11 2014)
Mike Danby Introduction (Dec 11 2014)
 
the global environment and operations strategy Operation management
 the global environment and operations strategy Operation management the global environment and operations strategy Operation management
the global environment and operations strategy Operation management
 
New product development costing. Carles Debart
New product development costing. Carles DebartNew product development costing. Carles Debart
New product development costing. Carles Debart
 
Final projects
Final projectsFinal projects
Final projects
 
midterm MGT311
midterm MGT311 midterm MGT311
midterm MGT311
 
Ch 2 product design (1)
Ch 2  product design (1)Ch 2  product design (1)
Ch 2 product design (1)
 
Mod 1 Lecture_PDC.pdf
Mod 1 Lecture_PDC.pdfMod 1 Lecture_PDC.pdf
Mod 1 Lecture_PDC.pdf
 
Building Client Capability to Deliver Megaprojects - J. Denicol, professor at...
Building Client Capability to Deliver Megaprojects - J. Denicol, professor at...Building Client Capability to Deliver Megaprojects - J. Denicol, professor at...
Building Client Capability to Deliver Megaprojects - J. Denicol, professor at...
 
IRJET- Application of Decision Making Tool in Sustainable Construction
IRJET- Application of Decision Making Tool in Sustainable ConstructionIRJET- Application of Decision Making Tool in Sustainable Construction
IRJET- Application of Decision Making Tool in Sustainable Construction
 
MCE Learning and Teaching Version 2.0 Page 1 of 6 Cour
MCE  Learning and Teaching Version 2.0  Page 1 of 6 CourMCE  Learning and Teaching Version 2.0  Page 1 of 6 Cour
MCE Learning and Teaching Version 2.0 Page 1 of 6 Cour
 
Bba501 & production and operations management
Bba501 & production and operations managementBba501 & production and operations management
Bba501 & production and operations management
 
Mike Danby Introduction (Dec. 2014)
Mike Danby Introduction (Dec. 2014)Mike Danby Introduction (Dec. 2014)
Mike Danby Introduction (Dec. 2014)
 

More from calvins9

Supporting Developmentally Appropriate PracticesSupporting D.docx
Supporting Developmentally Appropriate PracticesSupporting D.docxSupporting Developmentally Appropriate PracticesSupporting D.docx
Supporting Developmentally Appropriate PracticesSupporting D.docx
calvins9
 
Supporting Developmentally Appropriate Practices.For this as.docx
Supporting Developmentally Appropriate Practices.For this as.docxSupporting Developmentally Appropriate Practices.For this as.docx
Supporting Developmentally Appropriate Practices.For this as.docx
calvins9
 
Supporting Developmentally Appropriate PracticesSupporting.docx
Supporting Developmentally Appropriate PracticesSupporting.docxSupporting Developmentally Appropriate PracticesSupporting.docx
Supporting Developmentally Appropriate PracticesSupporting.docx
calvins9
 
supporting docu-mentation.In 2005, the more than 70 agencies of .docx
supporting docu-mentation.In 2005, the more than 70 agencies of .docxsupporting docu-mentation.In 2005, the more than 70 agencies of .docx
supporting docu-mentation.In 2005, the more than 70 agencies of .docx
calvins9
 
Supply and Demand GuideTo solve the homework problems do the f.docx
Supply and Demand GuideTo solve the homework problems do the f.docxSupply and Demand GuideTo solve the homework problems do the f.docx
Supply and Demand GuideTo solve the homework problems do the f.docx
calvins9
 
Support or refute this statement [T]he Declaration functioned .docx
Support or refute this statement [T]he Declaration functioned .docxSupport or refute this statement [T]he Declaration functioned .docx
Support or refute this statement [T]he Declaration functioned .docx
calvins9
 
Support for Caregivers of Cancer Patient.docx
Support for Caregivers of Cancer Patient.docxSupport for Caregivers of Cancer Patient.docx
Support for Caregivers of Cancer Patient.docx
calvins9
 
SUPPLEMENTARY LOW SPEED AERODYNAMICS (DEN233) .docx
SUPPLEMENTARY   LOW SPEED AERODYNAMICS (DEN233)  .docxSUPPLEMENTARY   LOW SPEED AERODYNAMICS (DEN233)  .docx
SUPPLEMENTARY LOW SPEED AERODYNAMICS (DEN233) .docx
calvins9
 
Supply Market Analysis for a Competitive Advantage Davi.docx
Supply Market Analysis for a Competitive Advantage  Davi.docxSupply Market Analysis for a Competitive Advantage  Davi.docx
Supply Market Analysis for a Competitive Advantage Davi.docx
calvins9
 
Supply ChainManagementA LOGISTICS PERSPECTIVE9e.docx
Supply ChainManagementA LOGISTICS PERSPECTIVE9e.docxSupply ChainManagementA LOGISTICS PERSPECTIVE9e.docx
Supply ChainManagementA LOGISTICS PERSPECTIVE9e.docx
calvins9
 
Summative Productivity Lab Maxi Widjojo IB S1 ESS Mrs. .docx
Summative Productivity Lab Maxi Widjojo  IB S1 ESS Mrs. .docxSummative Productivity Lab Maxi Widjojo  IB S1 ESS Mrs. .docx
Summative Productivity Lab Maxi Widjojo IB S1 ESS Mrs. .docx
calvins9
 
Sun, sea, sand and tsunami examiningdisaster vulnerability .docx
Sun, sea, sand and tsunami examiningdisaster vulnerability .docxSun, sea, sand and tsunami examiningdisaster vulnerability .docx
Sun, sea, sand and tsunami examiningdisaster vulnerability .docx
calvins9
 
Summary 1271 Wordssecond hand smoke55SIMILARITY.docx
Summary 1271 Wordssecond hand smoke55SIMILARITY.docxSummary 1271 Wordssecond hand smoke55SIMILARITY.docx
Summary 1271 Wordssecond hand smoke55SIMILARITY.docx
calvins9
 
Superior Electrical (Superior) was in the business of installing ele.docx
Superior Electrical (Superior) was in the business of installing ele.docxSuperior Electrical (Superior) was in the business of installing ele.docx
Superior Electrical (Superior) was in the business of installing ele.docx
calvins9
 
Superstorm scenario–a so-called Superstorm” is predicted to affe.docx
Superstorm scenario–a so-called Superstorm” is predicted to affe.docxSuperstorm scenario–a so-called Superstorm” is predicted to affe.docx
Superstorm scenario–a so-called Superstorm” is predicted to affe.docx
calvins9
 
Supply Chain ManagementSTRATEGY, PLANNING, AND OPERATION.docx
Supply Chain ManagementSTRATEGY, PLANNING, AND OPERATION.docxSupply Chain ManagementSTRATEGY, PLANNING, AND OPERATION.docx
Supply Chain ManagementSTRATEGY, PLANNING, AND OPERATION.docx
calvins9
 

More from calvins9 (20)

Supporting Developmentally Appropriate PracticesSupporting D.docx
Supporting Developmentally Appropriate PracticesSupporting D.docxSupporting Developmentally Appropriate PracticesSupporting D.docx
Supporting Developmentally Appropriate PracticesSupporting D.docx
 
Supporting Developmentally Appropriate Practices.For this as.docx
Supporting Developmentally Appropriate Practices.For this as.docxSupporting Developmentally Appropriate Practices.For this as.docx
Supporting Developmentally Appropriate Practices.For this as.docx
 
Supporting Developmentally Appropriate PracticesSupporting.docx
Supporting Developmentally Appropriate PracticesSupporting.docxSupporting Developmentally Appropriate PracticesSupporting.docx
Supporting Developmentally Appropriate PracticesSupporting.docx
 
Supporting LecturesRefer to the following lectureNut.docx
Supporting LecturesRefer to the following lectureNut.docxSupporting LecturesRefer to the following lectureNut.docx
Supporting LecturesRefer to the following lectureNut.docx
 
supporting docu-mentation.In 2005, the more than 70 agencies of .docx
supporting docu-mentation.In 2005, the more than 70 agencies of .docxsupporting docu-mentation.In 2005, the more than 70 agencies of .docx
supporting docu-mentation.In 2005, the more than 70 agencies of .docx
 
Support or oppose the statement Young people do too much cell phon.docx
Support or oppose the statement Young people do too much cell phon.docxSupport or oppose the statement Young people do too much cell phon.docx
Support or oppose the statement Young people do too much cell phon.docx
 
Supply and Demand GuideTo solve the homework problems do the f.docx
Supply and Demand GuideTo solve the homework problems do the f.docxSupply and Demand GuideTo solve the homework problems do the f.docx
Supply and Demand GuideTo solve the homework problems do the f.docx
 
Support or refute this statement [T]he Declaration functioned .docx
Support or refute this statement [T]he Declaration functioned .docxSupport or refute this statement [T]he Declaration functioned .docx
Support or refute this statement [T]he Declaration functioned .docx
 
Support your argument for and against hospice. As well as furthe.docx
Support your argument for and against hospice. As well as furthe.docxSupport your argument for and against hospice. As well as furthe.docx
Support your argument for and against hospice. As well as furthe.docx
 
Support for Caregivers of Cancer Patient.docx
Support for Caregivers of Cancer Patient.docxSupport for Caregivers of Cancer Patient.docx
Support for Caregivers of Cancer Patient.docx
 
SUPPLEMENTARY LOW SPEED AERODYNAMICS (DEN233) .docx
SUPPLEMENTARY   LOW SPEED AERODYNAMICS (DEN233)  .docxSUPPLEMENTARY   LOW SPEED AERODYNAMICS (DEN233)  .docx
SUPPLEMENTARY LOW SPEED AERODYNAMICS (DEN233) .docx
 
Supply Market Analysis for a Competitive Advantage Davi.docx
Supply Market Analysis for a Competitive Advantage  Davi.docxSupply Market Analysis for a Competitive Advantage  Davi.docx
Supply Market Analysis for a Competitive Advantage Davi.docx
 
Supply ChainManagementA LOGISTICS PERSPECTIVE9e.docx
Supply ChainManagementA LOGISTICS PERSPECTIVE9e.docxSupply ChainManagementA LOGISTICS PERSPECTIVE9e.docx
Supply ChainManagementA LOGISTICS PERSPECTIVE9e.docx
 
Summative Productivity Lab Maxi Widjojo IB S1 ESS Mrs. .docx
Summative Productivity Lab Maxi Widjojo  IB S1 ESS Mrs. .docxSummative Productivity Lab Maxi Widjojo  IB S1 ESS Mrs. .docx
Summative Productivity Lab Maxi Widjojo IB S1 ESS Mrs. .docx
 
Summative Discussion BoardReview and reflect on the knowledg.docx
Summative Discussion BoardReview and reflect on the knowledg.docxSummative Discussion BoardReview and reflect on the knowledg.docx
Summative Discussion BoardReview and reflect on the knowledg.docx
 
Sun, sea, sand and tsunami examiningdisaster vulnerability .docx
Sun, sea, sand and tsunami examiningdisaster vulnerability .docxSun, sea, sand and tsunami examiningdisaster vulnerability .docx
Sun, sea, sand and tsunami examiningdisaster vulnerability .docx
 
Summary 1271 Wordssecond hand smoke55SIMILARITY.docx
Summary 1271 Wordssecond hand smoke55SIMILARITY.docxSummary 1271 Wordssecond hand smoke55SIMILARITY.docx
Summary 1271 Wordssecond hand smoke55SIMILARITY.docx
 
Superior Electrical (Superior) was in the business of installing ele.docx
Superior Electrical (Superior) was in the business of installing ele.docxSuperior Electrical (Superior) was in the business of installing ele.docx
Superior Electrical (Superior) was in the business of installing ele.docx
 
Superstorm scenario–a so-called Superstorm” is predicted to affe.docx
Superstorm scenario–a so-called Superstorm” is predicted to affe.docxSuperstorm scenario–a so-called Superstorm” is predicted to affe.docx
Superstorm scenario–a so-called Superstorm” is predicted to affe.docx
 
Supply Chain ManagementSTRATEGY, PLANNING, AND OPERATION.docx
Supply Chain ManagementSTRATEGY, PLANNING, AND OPERATION.docxSupply Chain ManagementSTRATEGY, PLANNING, AND OPERATION.docx
Supply Chain ManagementSTRATEGY, PLANNING, AND OPERATION.docx
 

Recently uploaded

SPLICE Working Group: Reusable Code Examples
SPLICE Working Group:Reusable Code ExamplesSPLICE Working Group:Reusable Code Examples
SPLICE Working Group: Reusable Code Examples
Peter Brusilovsky
 
Transparency, Recognition and the role of eSealing - Ildiko Mazar and Koen No...
Transparency, Recognition and the role of eSealing - Ildiko Mazar and Koen No...Transparency, Recognition and the role of eSealing - Ildiko Mazar and Koen No...
Transparency, Recognition and the role of eSealing - Ildiko Mazar and Koen No...
EADTU
 
會考英文會考英文會考英文會考英文會考英文會考英文會考英文會考英文會考英文會考英文會考英文
會考英文會考英文會考英文會考英文會考英文會考英文會考英文會考英文會考英文會考英文會考英文會考英文會考英文會考英文會考英文會考英文會考英文會考英文會考英文會考英文會考英文會考英文
會考英文會考英文會考英文會考英文會考英文會考英文會考英文會考英文會考英文會考英文會考英文
中 央社
 

Recently uploaded (20)

Sternal Fractures & Dislocations - EMGuidewire Radiology Reading Room
Sternal Fractures & Dislocations - EMGuidewire Radiology Reading RoomSternal Fractures & Dislocations - EMGuidewire Radiology Reading Room
Sternal Fractures & Dislocations - EMGuidewire Radiology Reading Room
 
ĐỀ THAM KHẢO KÌ THI TUYỂN SINH VÀO LỚP 10 MÔN TIẾNG ANH FORM 50 CÂU TRẮC NGHI...
ĐỀ THAM KHẢO KÌ THI TUYỂN SINH VÀO LỚP 10 MÔN TIẾNG ANH FORM 50 CÂU TRẮC NGHI...ĐỀ THAM KHẢO KÌ THI TUYỂN SINH VÀO LỚP 10 MÔN TIẾNG ANH FORM 50 CÂU TRẮC NGHI...
ĐỀ THAM KHẢO KÌ THI TUYỂN SINH VÀO LỚP 10 MÔN TIẾNG ANH FORM 50 CÂU TRẮC NGHI...
 
TỔNG HỢP HƠN 100 ĐỀ THI THỬ TỐT NGHIỆP THPT TOÁN 2024 - TỪ CÁC TRƯỜNG, TRƯỜNG...
TỔNG HỢP HƠN 100 ĐỀ THI THỬ TỐT NGHIỆP THPT TOÁN 2024 - TỪ CÁC TRƯỜNG, TRƯỜNG...TỔNG HỢP HƠN 100 ĐỀ THI THỬ TỐT NGHIỆP THPT TOÁN 2024 - TỪ CÁC TRƯỜNG, TRƯỜNG...
TỔNG HỢP HƠN 100 ĐỀ THI THỬ TỐT NGHIỆP THPT TOÁN 2024 - TỪ CÁC TRƯỜNG, TRƯỜNG...
 
Improved Approval Flow in Odoo 17 Studio App
Improved Approval Flow in Odoo 17 Studio AppImproved Approval Flow in Odoo 17 Studio App
Improved Approval Flow in Odoo 17 Studio App
 
Graduate Outcomes Presentation Slides - English (v3).pptx
Graduate Outcomes Presentation Slides - English (v3).pptxGraduate Outcomes Presentation Slides - English (v3).pptx
Graduate Outcomes Presentation Slides - English (v3).pptx
 
How to Manage Website in Odoo 17 Studio App.pptx
How to Manage Website in Odoo 17 Studio App.pptxHow to Manage Website in Odoo 17 Studio App.pptx
How to Manage Website in Odoo 17 Studio App.pptx
 
SPLICE Working Group: Reusable Code Examples
SPLICE Working Group:Reusable Code ExamplesSPLICE Working Group:Reusable Code Examples
SPLICE Working Group: Reusable Code Examples
 
Transparency, Recognition and the role of eSealing - Ildiko Mazar and Koen No...
Transparency, Recognition and the role of eSealing - Ildiko Mazar and Koen No...Transparency, Recognition and the role of eSealing - Ildiko Mazar and Koen No...
Transparency, Recognition and the role of eSealing - Ildiko Mazar and Koen No...
 
Including Mental Health Support in Project Delivery, 14 May.pdf
Including Mental Health Support in Project Delivery, 14 May.pdfIncluding Mental Health Support in Project Delivery, 14 May.pdf
Including Mental Health Support in Project Delivery, 14 May.pdf
 
AIM of Education-Teachers Training-2024.ppt
AIM of Education-Teachers Training-2024.pptAIM of Education-Teachers Training-2024.ppt
AIM of Education-Teachers Training-2024.ppt
 
Stl Algorithms in C++ jjjjjjjjjjjjjjjjjj
Stl Algorithms in C++ jjjjjjjjjjjjjjjjjjStl Algorithms in C++ jjjjjjjjjjjjjjjjjj
Stl Algorithms in C++ jjjjjjjjjjjjjjjjjj
 
ANTI PARKISON DRUGS.pptx
ANTI         PARKISON          DRUGS.pptxANTI         PARKISON          DRUGS.pptx
ANTI PARKISON DRUGS.pptx
 
diagnosting testing bsc 2nd sem.pptx....
diagnosting testing bsc 2nd sem.pptx....diagnosting testing bsc 2nd sem.pptx....
diagnosting testing bsc 2nd sem.pptx....
 
An Overview of the Odoo 17 Knowledge App
An Overview of the Odoo 17 Knowledge AppAn Overview of the Odoo 17 Knowledge App
An Overview of the Odoo 17 Knowledge App
 
Andreas Schleicher presents at the launch of What does child empowerment mean...
Andreas Schleicher presents at the launch of What does child empowerment mean...Andreas Schleicher presents at the launch of What does child empowerment mean...
Andreas Schleicher presents at the launch of What does child empowerment mean...
 
會考英文會考英文會考英文會考英文會考英文會考英文會考英文會考英文會考英文會考英文會考英文
會考英文會考英文會考英文會考英文會考英文會考英文會考英文會考英文會考英文會考英文會考英文會考英文會考英文會考英文會考英文會考英文會考英文會考英文會考英文會考英文會考英文會考英文
會考英文會考英文會考英文會考英文會考英文會考英文會考英文會考英文會考英文會考英文會考英文
 
8 Tips for Effective Working Capital Management
8 Tips for Effective Working Capital Management8 Tips for Effective Working Capital Management
8 Tips for Effective Working Capital Management
 
PSYPACT- Practicing Over State Lines May 2024.pptx
PSYPACT- Practicing Over State Lines May 2024.pptxPSYPACT- Practicing Over State Lines May 2024.pptx
PSYPACT- Practicing Over State Lines May 2024.pptx
 
Spring gala 2024 photo slideshow - Celebrating School-Community Partnerships
Spring gala 2024 photo slideshow - Celebrating School-Community PartnershipsSpring gala 2024 photo slideshow - Celebrating School-Community Partnerships
Spring gala 2024 photo slideshow - Celebrating School-Community Partnerships
 
When Quality Assurance Meets Innovation in Higher Education - Report launch w...
When Quality Assurance Meets Innovation in Higher Education - Report launch w...When Quality Assurance Meets Innovation in Higher Education - Report launch w...
When Quality Assurance Meets Innovation in Higher Education - Report launch w...
 

Supply Chain Management ● The supply chain is the sequence.docx

  • 1. Supply Chain Management ● The supply chain is the sequence of suppliers and organizational buyers that spans all stages of processing from raw materials to final customers. ● Supply chain management (SCM) involves managing the external resources, i.e., those sources of goods and services that are not under direct corporate control. ● It is the integration of the required activities to achieve a sustainable competitive advantage, Syllabus Highlights Course Summary This course is grounded in the new reality of globalization in the production and delivery of products and services. It is targeted to practitioners who participate in global production decision making to support their organization’s strategic and tactical supply chain goals. It employs a variety of important and essential conceptual theories, qualitative concepts, and quantitative methodologies. Topics that concern the challenges faced by supply chain practitioners will be addressed. Further, the course addresses the integration of superior supply chain
  • 2. and other business practices across locations that are geographically dispersed and culturally diverse. The products and services addressed include those that are produced offshore, those that are outsourced, and those that are produced internally. They also span products and services that are mature and those that are new to the market. 6 Syllabus Highlights 9 Articles: During several weeks, all students will take part in a set of focused discussions that concern the material covered in the lectures and the assigned articles. Case Studies: Each of the case study assignments will evaluate students’ ability to synthesize various aspects of the course and apply them to a complex scenario. Analysis of a case study will combine conceptual and cognitive elements. Problem Set Assignments: Each of the problem set assignments will evaluate students’ ability to apply the quantitative aspects of the course material. The problem set will require the use of Excel to practice developing or using a decision-making tool within a global supply chain context. It will be an individual assignment, with a well-organized professional submittal.
  • 3. Syllabus Highlights 10 Examinations: Two in-class exams will be given, on dates noted above. The exams are closed book and notes. However, you will be allowed to use a one-page (double sided) sheet with notes that you create. Please bring a calculator to the exams (phones and laptops cannot be used as calculators). In-class exams are not cumulative and cover the material through the weeks indicated on the schedule. An entire class session will be devoted to the final exam. Check out more exam information on the Study Guide. Syllabus Highlights 11 Course Summary Sept. 5 Sept. 12 Lecture 1: Introduction to Global Supply Chains Lecture 2: Supply Chain Strategy and Challenges Sept. 19 Sept. 26 Lecture 3: Supply Chain Risks
  • 4. Lecture 4: Time Series Forecasting Oct. 3 Oct. 17 Lecture 5: Performance Metrics Lecture 6: Aggregate Planning Oct. 24 Oct. 31 Nov. 7 Lecture 7: Buffering & Risk Pooling Mid-term Exam Lecture 8: Delayed Differentiation Nov. 14 Nov. 28 Lecture 9: Supply Chain Optimization Lecture 10: Service Supply Chains and Logistics Dec. 5 Dec. 12 Lecture 11: Use of Analytics in Supply Chains Lecture 12: Business Function Integration Dec. 19 Final Exam The Supply Chain Lecture 1- Introduction to Global Supply Chains
  • 5. SCM SupplierSupplier Supplier Supplier Supplier Supplier A Supplier DSupplier B Supplier C Supply Chain Components Supplier Customers 2nd-Tier Suppliers 1st-Tier Suppliers 3rd-Tier Suppliers 4th-Tier Suppliers Supply Chain Components (Example) 15 Suppliers
  • 7. Logistics (sea) Small Customer Large Customer (e.g., Wal-Mart , Target) Consumers Plastics Molding (E. Europe) A Global Supply Chain Warehouse 16 ABS Plastic – the raw material used to mold LEGO bricks. A LEGO “die” – used to shape melted plastic into bricks (made in
  • 8. Germany). A LEGO mold – placed in an injection molding machine and used to produce bricks in large quantities (mainly in Eastern Europe). LEGO headquarters in Billund, Denmark. 17 LEGO bricks produced in large batches. LEGO bricks shipped to Mexico. LEGO bricks stored prior to shipment to Mexico.
  • 9. LEGO bricks moved to the packing facility. 18 http://www.stellacompanygroup.com/images/services/liner_and_ shipping.jpg LEGO bricks stored prior to packing. Pre-pack packing into foil bags. Packing into various sized boxes. Pre-packs stored in warehouse. 19 LEGO sets stored in distribution center.
  • 10. LEGO sets shipped to customers (i.e., retailers). LEGO sets purchased by consumers. LEGO sets transported to distribution facility. 20 http://www.geocities.com/WestHollywood/9172/Enfield/wh2.jp g http://images.google.com/imgres?imgurl=http://images.business week.com/ss/06/12/1227_inhouse_brands/image/8_wal- mart.jpg&imgrefurl=http://images.businessweek.com/ss/06/12/1 227_inhouse_brands/source/8.htm&h=453&w=440&sz=87&hl=e n&start=5&um=1&tbnid=0YgrmIHD- b6DbM:&tbnh=127&tbnw=123&prev=/images?q=wal- mart&um=1&hl=en&rls=com.microsoft:en-us:IE- SearchBox&rlz=1I7ADBF&sa=G http://images.google.com/imgres?imgurl=http://www.lego.com/i nfo/images/children1.jpg&imgrefurl=http://www.lego.com/eng/i nfo/default.asp?page=pressdetail&contentid=503&countrycode= 2057&yearcode=2002&oldXML=true&archive=true&h=849&w= 1066&sz=834&hl=en&start=2&um=1&tbnid=C8KkukJkPanRtM :&tbnh=119&tbnw=150&prev=/images?q=lego+child&um=1&hl =en&rls=com.microsoft:en-us:IE-SearchBox&rlz=1I7ADBF Customers want availability,
  • 11. flexibility and cost-effective solutions Suppliers want predictability & certainty shareholders want growth & profitability 21 Wants, Needs, and Expectations http://images.google.com/imgres?imgurl=http://images.business week.com/ss/06/12/1227_inhouse_brands/image/8_wal- mart.jpg&imgrefurl=http://images.businessweek.com/ss/06/12/1 227_inhouse_brands/source/8.htm&h=453&w=440&sz=87&hl=e n&start=5&um=1&tbnid=0YgrmIHD- b6DbM:&tbnh=127&tbnw=123&prev=/images?q=wal- mart&um=1&hl=en&rls=com.microsoft:en-us:IE- SearchBox&rlz=1I7ADBF&sa=G Example: New Toy Sales Forecasts are made before the year starts & revised monthly, based on current sales activity. 22 Sa le
  • 12. s Jan DecApril July All sales are expected to follow a seasonal pattern, but popularity of each product is uncertain. Oct Strategic Need for SCM ● Total supply chain costs represent better than half of the total operating expenses for most organizations ● The broader concept of the supply chain includes the supply, storage, and movement of materials, information, personnel, equipment, and finished goods within the organization and between it and its business environment ● The objective of SCM is to integrate the entire process of satisfying the customer’s needs all along the supply chain Supply Chain Strategy ● Supply chain strategy needs to be tailored to meet the needs of the customers which is multifaceted: cost; quality; timeliness; reliability; etc.
  • 13. – In situations where the goods are basic commodities with standard benefits (food, home supplies, standard clothing), then cost reduction is often the focus – In fashion goods, timeliness may be the focus of the supply chain – In high technology, new functionality may be more important than cost Supply Chain Strategy ● When operating in multiple markets, producers may need a different supply chain for each ● Many organizations choose to outsource portions of their requirements to third-party companies – Allows a firm to focus on its core competencies – Reduces capital investment – Gains access to best practices Management Goals ● BETTER: Maximize quality for customers: – product (e.g., meets design specifications). – service (satisfies customers’ needs and wants).
  • 14. ● COST EFFECTIVE: Minimize costs for manufacturers/suppliers: – low production/distribution costs. – high resource utilization. ● FASTER: Minimize lead time for customers: – B2B (e.g., meets lead time agreement). – B2C (e.g., good availability & responsiveness). ● SUSTAINABLE: Provide great solutions: – Sustainable solutions and sustainable success – Reduced wasted, defects, and burdens 26 Matching Supply w/Demand • Dealing with complexity – interconnected processes, geographical dispersion, cultural differences, geopolitical issues, multiple stakeholders, etc. • Dealing with ambiguity – customer preferences, “hidden” costs and benefits, etc. • Dealing with externally-imposed change – competition, partners, suppliers, global economy, etc. • Dealing with risks & uncertainty – consumer demand, lead time variation, quality, natural & made-made disasters, etc. 27
  • 15. Sourcing Strategies ● Global sourcing is an important aspect of supply chain outsourcing strategy ● Outsourcing is the process of contracting with external suppliers for goods and services that were previously provided internally ● One danger to outsourcing is being hollowed out ● More recent trend is outsourcing entire production process to contract manufacturers Purchasing/Procurement ● Obtaining quality materials and services at the right cost when they are needed ● Identify and quality suppliers, negotiate contracts, arrange transportation, oversee and manage suppliers ● Important considerations include price, quality, lead times, and reliability ● Manufacturing organizations spend an average of 55 percent of revenue for outside materials and services. Value Analysis ● A special responsibility of purchasing, or purchasing
  • 16. working jointly with engineering/design and operations is to regularly evaluate the function of purchased items or services, especially those that are expensive or used in high volumes ● The goal is to either reduce the cost of the item or improve its performance Logistics ● Planning and controlling efficient, effective flows of goods, services, and information from one point to another ● Consists of inventories, distribution networks, storage and warehousing, transportation, information processing, and even production ● Logistic is taking on tremendous importance Decision Making in Supply Chains ● Supply chain practices should not rely on a simplified set of assumptions, for example: – minimization of labor costs across the supply chain, or – minimization of all inventory using lean production throughout the supply chain. ● When multiple decision criteria are not accounted for, several problems can be expected, for example: – excessive overstocks and/or understocks,
  • 17. – time spent recovering from unanticipated events, and/or – high operating/distribution costs that reduce profitability. 32 The Principles of Supply Chain Management ● A Systems Approach- a guiding philosophy pertaining to the supply chain that all elements are important. ● Strategic Direction - the enterprise is moving in the same direction. ● Critical Mass - Every level in the enterprise has sufficient resources to achieve the goals. ● Effective use of resources - Every level of the enterprise utilizes its resources effectively. Key SCM Considerations ● Value system and the related supply chain consider the important aspects of customer value creation, integration, and sustainable success. ● Supply chain has many elements of the push systems of production and pull systems of lean. ● Services sometimes include the customer in the supply chain
  • 18. Factors Driving SCM ● Procurement costs are increasing ● Increasing global competition ● Outsourcing ● Internet ● Shorter life cycles ● Greater supply chain complexity ● Increasing concern for the natural environment Location ● Location is a key supply chain decision - facilities relative to suppliers, producers, and customers ● Decision is divided into three stages – Regional – Community – Site ● Some services may only be concerned with site selection Supply Chain Design
  • 19. ● The supply chain consists of the network of organizations that supply inputs to the business unit, the business unit itself, and the customers ● Supplier networks can include external suppliers ● A broad view of the process focuses management attention on the entire process that creates value rather than individual activities Push vs. Pull Systems ● Operating systems can be broadly classified in two ways: – push systems create inventory in anticipation of demand, and – pull systems create inventory in response to demand. ● Manufacturing systems can be push or pull systems: – push systems are often called “make to stock,” while – pull systems are often called “make to order.” ● Service systems are almost always pull systems: – the service cannot be initiated until the customer expresses a need (e.g., radiology, troubleshooting, product design, background check, etc.). 38 Main Planning/Execution Options ● For component parts that are used in finished products, push and pull are managed differently.
  • 20. ● In push systems, MRP (material requirements planning) is often used: – a final schedule is “explored” into component parts – they are made ahead of time to be available when needed. ● In pull systems, JIT (just in time) is often used: – the subsequent step in the production system “signals” the need for component parts from the previous step in the production system. 39 Push–Pull (Hybrid) Supply Chain Initial forecast & determination of inventory buffer by product (large batches) e.g., make “safe” quantities for each product “Push” Production Revised forecast & determination of capacity buffer by resource (small batches)
  • 21. e.g., weekly replenishment cycle “Pull” Production Jan Dec 40 Forecasting 41 ● A forecast can be based on judgements (i.e., by humans), models (i.e., by mathematical equations), or collaboration (i.e., by organizations). ● A forecasting model is chosen based on its ability to accurately predict the past – and therefore less than effective when the future is not perfectly aligned with the past. ● To be most effective, those providing forecasts should be integrated with those who use forecasts to make decisions, – but this sometimes not the case, especially in large organizations. Applications of Forecasts
  • 22. ● Long-range facility planning (many years) – e.g., buildings, major equipment, location. ● Medium-range capacity planning (many months) – e.g., machines, labor, tools. ● Short-term scheduling (many weeks or days) – e.g., personnel, supplies. The most obvious applications of forecasting are for products that may be manufactured in global supply chains, but forecasting is also important in services. 42 Buffering ● With INVENTORY, at a targeted level of product manufacturing: – raw material (most desirable) – work-in-process (i.e., partially made products) – final products (least desirable) ● With CAPACITY, for critical resources: – labor – equipment – facilities Buffering is may be necessary, but excessive buffering is costly and increases lead times.
  • 23. 43 Summary Our focus is on: – The System – Customers and Stakeholders – The Processes – Measures of Success – Relationships of the Players – The External Environment – Long Term – Article 1 Discussion Made in America, Again (by Sirkin, Zinser, and Hohner) Boston Consulting Group For this article discussion, read the article listed above and react as you deem appropriate. For example, you may agree with a point being made. Or, you have provided additional information related to the topic but not addressed in the article. Or, you may disagree with a point being made. In every case, you must provide arguments that are supported with your specific experience or publications (e.g., peer reviewed articles, magazine stories, or newspaper accounts).
  • 24. If you did not attend the class, you are required to create one post (using 150-250 words); your response to another student’s post must be completed by Day 7 at 11:59 PM. Grades will be based on the criteria described in the Discussion Participation Grades table found in the syllabus. 45 Made in America, Again Why Manufacturing Will Return to the U.S. The Boston Consulting Group (BCG) is a global management consulting firm and the world’s leading advisor on business strategy. We partner with clients in all sectors and regions to identify their highest-value opportunities, address their most critical challenges, and transform their businesses. Our customized approach combines deep insight into the dynamics of companies and markets with close collaboration at all levels of the client organization. This ensures that our clients achieve sustainable competitive advan- tage, build more capable organizations, and secure lasting results. Founded in 1963, BCG is a private company with 74 offices in 42 countries. For more information, please visit www.bcg.com.
  • 25. Made in America, Again Why Manufacturing Will Return to the U.S. Harold L. Sirkin, Michael Zinser, and Douglas Hohner August 2011 Made in America, Again2 China’s overwhelming manufacturing cost advantage over the U.S. is shrinking fast. Within five years, a Boston Consulting Group analysis concludes, rising Chinese wages, higher U.S. productivity, a weaker dollar, and other factors will virtually close the cost gap between the U.S. and China for many goods consumed in North America. LOOK AT TOTAL COSTS Companies should undertake a rigorous, product-by-product analysis of their global supply networks that fully accounts for total costs, rather than just factory wages. For many products sold in North America, the U.S. will become a more attractive manufacturing option. REASSESS YOUR CHINA STRATEGY For many products that have a high labor content and are destined for Asian markets, manufacturing in China will remain the best choice
  • 26. because of technologi- cal leadership or economies of scale. But China should no longer be treated as the default option. AT A GLANCE The Boston Consulting Group 3 For more than a decade, deciding where to build a manufacturing plant to supply the world was simple for many companies. With its seemingly limitless supply of low-cost labor and an enormous, rapidly developing domestic market, an artificially low currency, and significant government incentives to attract foreign investment, China was the clear choice. Now, however, a combination of economic forces is fast eroding China’s cost advan- tage as an export platform for the North American market. Meanwhile, the U.S., with an increasingly flexible workforce and a resilient corporate sector, is becoming more attractive as a place to manufacture many goods consumed on this continent. An analysis by The Boston Consulting Group concludes that, by sometime around 2015—for many goods destined for North American consumers—manufacturing in some parts of the U.S. will be just as economical as manufacturing in China. The key reasons for this shift include the following:
  • 27. Wage and benefit increases of 15 to 20 percent per year at the average Chinese • factory will slash China’s labor-cost advantage over low-cost states in the U.S., from 55 percent today to 39 percent in 2015, when adjusted for the higher productivity of U.S. workers. Because labor accounts for a small portion of a product’s manufacturing costs, the savings gained from outsourcing to China will drop to single digits for many products. For many goods, when transportation, duties, supply chain risks, industrial real • estate, and other costs are fully accounted for, the cost savings of manufacturing in China rather than in some U.S. states will become minimal within the next five years. Automation and other measures to improve productivity in China won’t be • enough to preserve the country’s cost advantage. Indeed, they will undercut the primary attraction of outsourcing to China—access to low-cost labor. Given rising income levels in China and the rest of developing Asia, demand for • goods in the region will increase rapidly. Multinational companies are likely to devote more of their capacity in China to serving the domestic Chinese as well as the larger Asian market, and to bring some production work for the North American market back to the U.S.
  • 28. Manufacturing of some goods will shift from China to nations with lower labor • costs, such as Vietnam, Indonesia, and Mexico. But these nations’ ability to Made in America, Again4 absorb the higher-end manufacturing that would otherwise go to China will be limited by inadequate infrastructure, skilled workers, scale, and domestic supply networks, as well as by political and intellectual property risks. Low worker productivity, corruption, and the risk to personal safety are added concerns in some countries. This reallocation of global manufacturing is in its very early phases. It will vary dramatically from industry to industry, depending on labor content, transportation costs, China’s competitive strengths, and the strategic needs of individual compa- nies. But we believe that it will become more pronounced over the next five years, especially as companies face decisions about where to add future capacity. While China will remain an important manufacturing platform for Asia and Europe, the U.S. will become increasingly attractive for the production of many goods sold to consumers in North America.
  • 29. This report, the first in a series, examines the economic trends that point to a U.S. manufacturing renaissance. It also explores the strategic implications of the shifting cost equation for companies engaged in global sourcing. The U.S. “Decline” and Renaissance in Perspective The death of American manufacturing has been foretold many times in the past four decades. As the only major industrialized nation not leveled by World War II, the U.S. accounted for around 40 percent of the world’s manufactured goods in the early 1950s. But then, fueled by a relentless wave of imports from a reconstructed Europe and eventually from Japan, the U.S. experienced a dramatic loss of market share in industries such as color TVs, steel, cars, and computer chips. In the 1970s and 1980s, fears of the loss of U.S. industrial competitiveness were particularly acute, prompting a widespread debate over whether the nation should adopt a “Japan Inc.”-style industrial policy and teach its schoolchildren to speak Japanese. Then came the rise of such East Asian Tigers as South Korea and Taiwan, which led to a massive transfer of production of labor-intensive goods, including apparel, shoes, and toys, and then of much of the U.S. computer and consumer-electronics manufacturing industry. The U.S. suffered through many painful adjustments to these challenges. Unlike most nations, however, it quickly ripped off the Band-Aid and
  • 30. allowed industry to adapt. Factories closed, companies failed, banks wrote off losses, and workers had to learn new skills. But U.S. industry and the economy responded with surprising flexibility and speed to reemerge more competitive and productive than ever. By the late 1990s, American companies dominated the world in high-value industries such as microprocessors, aerospace, networking equipment, software, and pharma- ceuticals. Manufacturing investment, output, and employment surged. It may not be obvious yet, but the U.S. manufacturing sector is today in the midst of a similar process of readjustment in response to perhaps its greatest competitive threat ever—the rise of China. Since opening its doors to foreign investment and trade, China has offered a virtually unbeatable combination of seemingly limitless cheap labor (less than $1 per hour), a growing pool of engineers, a fixed currency, The reallocation of global manufacturing will become more pronounced over the next five years, especially as compa- nies face decisions about where to add
  • 31. future capacity. The Boston Consulting Group 5 and local governments willing to offer inexpensive land, free infrastructure, and generous financial incentives. In the decade since it entered the World Trade Organization (WTO) in 2001, China has essentially become the default option for companies wishing to outsource production in order to lower costs. From 2000 to 2009, China’s exports leapt nearly fivefold, to $1.2 trillion, and its share of global exports rose from 3.9 percent to 9.7 percent, according to United Nations Conference on Trade and Development data. These developments occurred in a remarkable breadth of industries, from labor-intensive assembly work to heavy industry and high-tech. China’s portion of global apparel exports increased from 17.4 percent to 32.1 percent, for example. Its share of the world export market for furniture soared from 7.5 percent to 25.9 per- cent, for ships from 4.1 percent to 19.6 percent, for telecom equipment from 6.5 percent to 27.8 percent, and for office machines and computer equipment from 4.9 percent to 32.6 percent. In the U.S., meanwhile, the loss of some 6 million manufacturing jobs and the closure of tens of thousands of
  • 32. factories over the past decade has fanned frequent warnings of a manufacturing crisis. The Tide Is Turning Once again, however, predictions of the demise of American manufacturing are likely to prove wrong. The U.S. manufacturing sector remains robust. Output is almost two and a half times its 1972 level in constant dollars, even though employ- ment has dropped by 33 percent. Despite the recent wave of outsourcing to China, the value of U.S. manufacturing output increased by one-third, to $1.65 trillion, from 1997 to 2008—before the onset of the recession—thanks to the strongest productiv- ity growth in the industrial world. Although China accounted for 19.8 percent of global manufacturing value added in 2010, the U.S. still accounted for 19.4 per- cent—a share that has declined only slightly over the past three decades. The conditions are coalescing for another U.S. resurgence. Rising wages, shipping costs, and land prices—combined with a strengthening renminbi—are rapidly eroding China’s cost advantages. The U.S., meanwhile, is becoming a lower-cost country. Wages have declined or are rising only moderately. The dollar is weaken- ing. The workforce is becoming increasingly flexible. Productivity growth continues. Our analysis concludes that, within five years, the total cost of production for many
  • 33. products will be only about 10 to 15 percent less in Chinese coastal cities than in some parts of the U.S. where factories are likely to be built. Factor in shipping, inventory costs, and other considerations, and—for many goods destined for the North American market—the cost gap between sourcing in China and manufactur- ing in the U.S. will be minimal. In some cases, companies will move work to inland China to find lower wages. But this will not be an attractive option in many indus- tries. Chinese cities in the interior provinces lack the abundance of skilled workers, supply networks, and efficient transportation infrastructure of those along the coast, offsetting much of the savings afforded by slightly lower labor costs. When all costs are taken into account, certain U.S. states, such as South Carolina, Alabama, and Tennessee, will turn out to be among the least expensive production The U.S. is becoming a lower-cost country, with a workforce that is increasingly flexible and productivity growth continuing. Made in America, Again6 sites in the industrialized world. As a result, we expect
  • 34. companies to begin building more capacity in the U.S. to supply North America. The early evidence of such a shift is mounting. NCR moved production of its ATMs to a plant in Columbus, Georgia, that will • employ 870 people by 2014. The Coleman Company is moving production of its 16-quart wheeled plastic • cooler from China to Wichita, Kansas, owing to rising Chinese manufacturing and shipping costs. Ford Motor Company is bringing up to 2,000 jobs back to the U.S. in the wake of • a favorable agreement with the United Auto Workers that allows the company to hire new workers at $14 per hour. Sleek Audio has moved production of its high-end headphones from Chinese • suppliers to its plant in Manatee County, Florida. Peerless Industries will consolidate all manufacturing of audio- visual mounting • systems in Illinois, moving work from China in order to achieve cost efficiencies, shorter lead times, and local control over manufacturing processes. Outdoor Greatroom Company moved production of its fire pits and some • outdoor shelters from China to the U.S., citing the inconvenience of having to
  • 35. book orders from Chinese contractors nine months in advance. The reallocation of production is still in its early stages, but we believe it will accelerate in the years ahead. The impact of the changing cost equation will vary from industry to industry. Products in which labor accounts for a small portion of total costs and in which volumes are modest, such as auto parts, construction equipment, and appliances, will be among those that companies reevaluate in terms of their options for supplying the North American market. But the manufac- ture of goods with relatively higher labor content that are produced in high vol- umes will likely remain in China. Finally, companies that make mass-produced, labor-intensive products, like apparel and shoes, may move production from China to other low-cost nations. (We will assess the implications of the new manufactur- ing math for specific industries in the second report in this series.) These trends do not suggest that Chinese manufacturing will decline or that multi- national companies will shut their mainland plants. More Chinese production capacity will be devoted to supplying the country’s enormous domestic market, which is gaining millions of new middle-class households each year, as well as other growing economies in Asia. In addition, China will continue to remain a low-cost supplier to Western Europe. And China will remain competitive
  • 36. in industries that have developed strong “clusters of excellence” and that have an immense installed base of production capacity and component and material suppliers. This means that when it comes to building new production capacity, companies will likely choose to explore alternatives instead of automatically opting for China. Over The manufacture of goods with relatively high labor content that are produced in high volumes will likely remain in China. The Boston Consulting Group 7 the next five years, we believe that the U.S. will be the optimal choice for many manufacturing investments aimed at serving the North American market. The New Manufacturing Math A combination of factors is starting to dramatically shift the manufacturing cost equation in favor of the U.S.
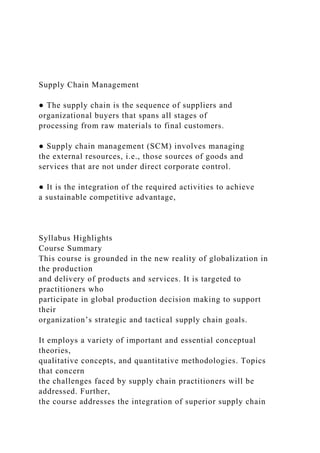
  • 37. China’s Rising Wages Rising labor rates have been a fact of life in Chinese factories for years. Average wages leapt by 150 percent from 1999 through 2006, for example, a period in which China emerged as the world’s workshop for a range of industries. Those increases started from a low base, but now the tipping point is in sight. For one thing, wage growth has accelerated much faster than productivity growth. From 2000 through 2005, pay and benefits for the average Chinese factory worker rose by 10 percent annually. (See Exhibit 1.) From 2005 through 2010, wage hikes averaged 19 percent per year, while the fully loaded cost of U.S. production workers rose by only 4 per- cent. The last few years have been especially volatile in China. In 2010, the giant contract manufacturer Foxconn International, which employs 920,000 people in China alone, doubled wages at its immense Shenzhen campus following a string of worker suicides. After a factory supplying Honda was hit by strikes last year, wages rose by 47 percent. Minimum wages rose by more than 20 percent in 20 Chinese regions, and by up to 30 percent in Sichuan province. Average wages could approach 17 percent of those in the U.S. by 2015, up from 3 percent in 2000 China U.S. 2
  • 39. 18.8 2004 2003 2002 2001 2000 0.5 16.6 Fully loaded factory-worker wages ($/hour) 30 25 20 15 10 5 0 4% 9% 17% 2015E
  • 40. 26.1 2014E 2013E 2012E 2011E 2010 2.0 22.3 3% 4.5 0.8 Sources: Economist Intelligence Unit; U.S. Bureau of Labor Statistics; selected company data; BCG analysis. Exhibit 1 | China's Wage Rates Are Growing Rapidly Made in America, Again8 BCG’s research projects that over the next five years, the fully loaded cost of Chinese workers in the Yangtze River Delta, which includes Shanghai and the provinces of Zhejiang and Jiangsu, will rise by an annual average of 18 percent, to about $6.31 per hour. This region has the highest manufacturing output in the country and is the heart of such high-skilled industries as
  • 41. automobiles and electron- ics. Chinese compensation packages will then be equal to about 25 percent of what skilled workers are earning in the manufacturing states of the southern U.S. While this gap may still seem huge, consider that factory workers in the Yangtze River Delta averaged only 72 cents per hour in 2000, compared with $15.81 per hour in the U.S. South. It is also possible that this trend will accelerate. Chinese labor organizations are gaining a greater ability to demand higher wages and benefits from foreign compa- nies. The government is enacting new labor laws that give greater rights to workers, requiring, for example, that companies pay laid-off workers one month’s salary in severance for every year that they worked. Productivity Insufficient to Offset Wage Increases One common belief is that rising Chinese productivity will compensate for rising wages. Indeed, manufacturing output per worker in China has improved by an average of 10 percent per year over the past decade, nearly five times the pace of U.S. productivity growth. Although we forecast that Chinese productivity growth will remain impressive, at 8.5 percent annually over the next five years, output per worker will increase at only half the pace of the rise in wages. (See Exhibit 2.) This means that productivity-adjusted costs are rising, which in the past was not
  • 42. always the case. Chinese productivity relative to U.S. productivity (%) 80 60 40 20 100 0 2015 2014 2013 2012 2011 2010 2009 2008 2007 2006 2005 2004 2003 2002 2001 2000 40 29 20 13 Growing at nearly 10 percent per year, China’s productivity could reach 40 percent of U.S. productivity by 2015 Average unit productivity, CAGR 2000–2010 (%) U.S.: ~2 China: ~10
  • 43. Average unit productivity, CAGR 2010–2015 (%) U.S.: ~1 China: ~8.5 Sources: Economist Intelligence Unit; U.S. Bureau of Labor Statistics; BCG analysis. Note: All figures are based on real units. Exhibit 2 | China’s Productivity Gains Will Lag Behind Wage Increases The Boston Consulting Group 9 Add in the difference in productivity itself, and the cost gap between Chinese and U.S. manufacturing shrinks much further. Adjusted for output per worker, the average cost of Chinese labor was 22 percent that of U.S. labor in 2005. By 2010, average Chinese labor costs had risen to 31 percent of the U.S. level. Although the Yangtze River Delta is more productive than other regions in China, the gap in wages is quickly closing there, as well. The hourly Chinese factory wage adjusted for productivity was $8.62 in the region in 2010, compared with $21.25 in the U.S. South. In 2015, labor adjusted for productivity will cost $15.03 an hour in the Yangtze River Delta, compared with a projected $24.81 in the
  • 44. U.S. South. While it may appear that Chinese wages are still much lower, keep in mind that labor is only part of the cost of making a product. The labor content ranges from only about 7 percent for products like video cameras to about 25 percent for a machined auto part. When transportation, duties, and other costs are included, not to mention the expected continued appreciation of China’s currency, companies may find that any cost savings to be gained from sourcing in China may not be worth the time and myriad risks and headaches associated with operating a supply chain extending halfway around the world. To illustrate how the math is changing, let’s look at a hypothetical part for a car assembled in the U.S. One option is to make the part in the U.S. South—say, in South Carolina. The alternative is to make it in the Yangtze River Delta. (See Exhibit 3.) In 2000, it would have made economic sense to source the part in China, where wages were about 20 times lower. Now fast-forward to 2015. The U.S. labor cost for the part will come to $3.31. At a factory in the Yangtze River Delta, workers will still 2000 2015E Wage rate ($/hour) 15.81 24.81
  • 45. Productivity (%) 100 100 Labor cost/part ($) 2.11 3.31 Wage rate ($/hour) 0.72 6.31 Productivity (%)1 13 42 Labor cost/part ($) 0.74 2.00 Labor cost savings (%) 65 39 Total cost savings before transportation, duties, and other costs (%) 16 10 Imagine a company... ...with the following choices of location • U.S.-based auto parts supplier • Most customers are U.S. OEMs that manufacture in the U.S. U.S., selected southern states
  • 46. China, Yangtze River Delta • Flexible unions/ workforce • Minimal wage growth • High worker productivity • Scarce labor • Rapidly rising wages • Low productivity relative to the U.S. • Parts require eight minutes of labor, on average, in the U.S. • Labor represents one-quarter of the total cost of the part Sources: Economist Intelligence Unit; U.S. Bureau of Labor Statistics; BCG analysis. 1Average productivity difference between the U.S. and China's Yangtze River Delta. Productivity in the Yangtze River Delta
  • 47. region is assumed to grow at a CAGR of ~7 percent over a 2009 baseline, slightly slower than overall Chinese manufacturing productivity (~8.5%) as other regions adopt more advanced manufacturing practices. Exhibit 3 | Economics Will Drive Reinvestment in the U.S. Made in America, Again10 be earning only one-quarter of their U.S. counterparts’ wages. However, even with massive productivity improvements, output per worker at the Chinese factory will be only 42 percent that of a southern U.S. plant. So the Chinese labor cost for the part will be $2.00, bringing the savings down to 39 percent. Moreover, since labor represents approximately one-quarter of the total cost of making the part, the total savings will shrink further, to less than 10 percent. Thus, the cost savings, if any, are unlikely to be enough to justify outsourcing the part to China, once all the other costs and risks are taken into account. If this trend contin- ues through 2020, say, the equation might even reverse itself completely—with manufacture in the U.S. being cheaper even before those added costs are considered. The Limits of Automation It might seem that greater investment in automation would solve the problem of
  • 48. China’s lower productivity. Multinational companies would merely have to install the same equipment used in their factories at home. That, however, would under- cut the chief competitive advantage of manufacturing in China—low labor costs. Automation reduces a product’s labor content. Despite the greater productivity that automation would afford, China’s total cost advantage over the U.S. would likely not increase significantly as a result. Take a kitchen appliance for which labor accounts for 20 percent of the cost. (See Exhibit 4.) In 2005, the product’s labor cost in a typical Chinese factory would have been 61 percent lower than in the U.S., and the total cost before supply chain costs would have been about 21 percent lower, accounting for productivity differences. By 2015, higher Chinese wages will have shrunk that total cost advantage to 13 per- cent. Now assume that the factory in China installs production lines identical to those in the U.S. and that it achieves the same level of productivity. Because of the reduced labor content of the appliance and the costs of operating the advanced factory, the total savings from manufacturing in China would improve only slightly, to 15 percent, according to our analysis. Again, that is before shipping, duties, inventory costs, and other expenses. For such an appliance intended for sale in North America, many companies would probably decide to build it domestically.
  • 49. Other Expenses Labor isn’t the only part of China’s changing cost equation. The cost of electricity has surged by 15 percent since 2010. Rising prices for imported thermal coal and an end to preferential rates for high-energy-consuming businesses are also pushing up utility rates for industry, which consumes 74 percent of China’s electricity. In addition, industrial land is no longer cheap in China. In fact, commercial prices are dramatically higher than in most of the U.S. For example, industrial land costs $11.15 per square foot in the coastal city of Ningbo, $14.49 in Nanjing, $17.29 in Shanghai, and $21 in Shenzhen. The national average is $10.22 per square foot. Industrial land in Alabama, by contrast, costs only $1.86 to $7.43 per square foot; in Tennessee and North Carolina, the price ranges from $1.30 to $4.65. To secure low real-estate costs in China, companies will need to move inland. But in so doing, they will incur higher transportation costs and lose some of the benefits of being part of the industrial clusters that have grown up in the major coastal cities. Greater investment in automation would undercut the chief competitive
  • 50. advantage of manufacturing in China—low labor costs. The Boston Consulting Group 11 Transpacific shipping rates are going up, too. While ocean freight remains inexpen- sive, the doubling of bunker-fuel prices since early 2009 is causing rates to increase. Rising oil prices, a falloff in new shipbuilding, and a projected shortage in container port capacity in 2015 are expected to boost ocean freight rates. The steady appreciation of the renminbi against the U.S. dollar, meanwhile, is further increasing the price of Chinese exports to the U.S. We expect that trend to continue. Finally, there are the many costs and headaches of relying on extended supply chains. These include inventory expenses, quality control problems, unanticipated travel needs, and the threat of supply disruptions due to port closures or natural disasters. With China, there are added concerns about intellectual-property theft and trade disputes that result in punitive duties. In response to a petition by the United Steelworkers, for instance, the U.S. in 2010 began investigating subsidies of Chinese green-technology products, such as wind turbines and
  • 51. solar panels, for possible unfair trade practices. In September 2009, the U.S. imposed extra duties of 25 to 35 percent on certain Chinese car and truck tires under a WTO “safe- guard” provision that allows countries to curb surges of Chinese imports that cause market disruptions. Other Low-Cost Countries It might seem reasonable for many companies to look for sourcing opportunities in other low-cost nations and to shift much of their export manufacturing from China to these cheaper locations. Fully loaded hourly manufacturing wages average $1.80 60 40 20 0 2015 100 15 75 2015E 42
  • 52. 13 39 2010 27 16 44 2005 19 21 61 2000 13 25 66 Cost savings (%) 100 80 China’s productivity relative to U.S. productivity (%) Total cost savings in China (%) Labor cost savings in China (%)1
  • 53. Product with 20 percent labor content (China’s productivity assumed to be equal to U.S. productivity) Total savings before supply chain costs Source: BCG analysis. 1Total labor cost in China divided by total labor cost in the U.S. Exhibit 4 | Increased Automation in China Is Unlikely to Change the Cost Equation Made in America, Again12 in Thailand, 49 cents in Vietnam, 38 cents in Indonesia, and 35 cents in Cambodia. There has already been a significant transfer of work in apparel, footwear, sporting goods, and other labor-intensive products to South and Southeast Asia. Other low-cost nations won’t be able to absorb all the export manufacturing that is likely to leave China, however. A simple reason is that there is no replacement for China’s labor force. China not only has the world’s largest population (1.34 billion), it also has the highest proportion of able-bodied adults in the
  • 54. workforce (84 per- cent). Twenty-eight percent of those workers are employed by industry, far more than in Southeast Asia, indicating that China has an estimated 215 million industri- al jobs. That is approximately 58 percent more than the industrial workforce of all of Southeast Asia and India combined. Chinese workers are also more productive than workers in other low-cost nations. Vietnamese workers earn only 25 percent of what their Chinese counterparts earn, but Chinese workers are significantly more productive, which mitigates much of the labor savings advantage. What’s more, as labor markets grow tighter, wages are rising fast in low-cost Asian nations, as well. Nor can many other low-cost nations match the first-rate infrastructure, skilled talent pool, well-developed supply networks, and worker productivity of China’s coastal industrial zones. Add to that the advantageous treatment by Chinese bureaucracies, from the central government down to the villages, which have showered foreign investors in targeted industries with incentives and have speedily cut through red tape. Indeed, for the manufacturing world, China has been the opposite of a perfect storm, offering a total package unlikely to be matched by any other low-cost nation. Mexico, on the other hand, has the potential to be a big winner when it comes to
  • 55. supplying North America. It has the enormous advantage of bordering the U.S., which means that goods can reach much of the country in a day or two, as opposed to at least 21 days by ship from China. Goods imported from Mexico can also enter duty-free, thanks to the North American Free Trade Agreement. In addition, by 2015, wages in Mexico will be significantly lower than in China. In 2000, Mexican factory workers earned more than four times as much as Chinese workers. After China’s entry into the WTO in 2001, however, maquiladora industrial zones border- ing the U.S. suffered a large loss in manufacturing. Now that has changed. By 2010, Chinese workers were earning only two-thirds as much as their Mexican counter- parts. By 2015, BCG forecasts that the fully loaded cost of hiring Chinese workers will be 25 percent higher than the cost of using Mexican workers. Mexico’s gains will be limited, however, especially in higher- value work now done in China. Because of concerns over personal safety, skill shortages, and poor infra- structure, many companies will keep manufacturing high-end products in the U.S. The Role of Government Incentives Governments in Asia and Europe have used generous financial incentives to per- suade multinational companies to build high-tech plants in targeted industries. Frequently they offered terms that the U.S. could not match,
  • 56. such as ten-year holidays from corporate taxes, cash grants, and cheap loans. In recent years, the federal government and many states have closed the gap with aggressive incentive Other low-cost nations won’t be able to absorb all the export manufacturing that is likely to leave China. There is no replacement for China's labor force. The Boston Consulting Group 13 packages, making the U.S. more competitive in the chase for manufacturing facili- ties. GlobalFoundries, for example, is receiving $1.3 billion in cash reimbursements and tax breaks over the next 15 years from the State of New York to build a $4.2 billion state-of-the-art silicon-wafer plant in Malta, New York, and Nissan received a $1.45 billion loan under the Advanced Technology Vehicles Manufactur- ing Program managed by the U.S. Department of Energy that covered most of the company’s $1.8 billion investment in a new plant in Tennessee.
  • 57. While government subsidies won’t make a major difference in determining whether a plant is built in the U.S. instead of in Asia, they can make the decision easier at a time when other cost factors are shifting in favor of the U.S. China’s Manufacturing Future A U.S. resurgence will not diminish China’s role as a global manufacturing power. The nation’s immense domestic market, installed base across a range of capital- intensive industries, and pool of skilled talent guarantee that it will be a rising force in a range of manufacturing sectors. Instead of pulling out of China, most multinational companies will orient more of their production to serve China and the rest of a growing Asia. In nominal terms, China’s economy is projected to be about two-thirds the size of the U.S. economy by 2015. It is already slightly larger than Japan’s and will be nearly twice as big in another five years. Disposable income is expected to grow by 230 percent, to $5.57 trillion. Over the next five years, China will add nearly 90 million households earning at least $9,000 per year. China also will continue to be a major low-cost export base for Western Europe, even though the wage gap will narrow significantly. In 2010, fully loaded wage costs adjusted for productivity in the Yangtze River Delta were 25 percent of those in Western Europe. In 2015, wages in the region will be only 38
  • 58. percent of those in Western Europe. This change will probably not be enough to generate a tipping point, so Europe will continue to rely on China as a primary source of manufac- tured products five years from now. The Implications for Companies The shifting cost structure between China and the U.S. will present more manufac- turing and sourcing choices. For many products that have a high labor content and are destined for Asian markets, manufacturing in China will still make sense because of technological leadership or economies of scale. But China should no longer be treated as the default option. Companies should undertake a fresh, rigorous, product-by- product analysis of their global supply networks that takes into account the total cost of production. Rather than fixate on labor rates, this analysis should factor in worker productivity, transit costs, time-to-market considerations, logistical risks, energy costs, and other expens- es in a range of scenarios. Companies should also make sure that their supply chains are flexible, dynamic, and globally balanced, providing the leeway to shift A U.S. resurgence will not diminish China’s role as a global manufacturing power.
  • 59. Made in America, Again14 production and sourcing to other locations when the time is right. And they should weigh the many intrinsic advantages of locating manufacturing close to consumers, such as the ability to more quickly get products into the hands of customers, replace depleted inventory of popular items, and make design changes in response to market trends or customer demands. In some cases, companies may find that now is the time it makes tactical sense to move some production away from China and into the U.S., Mexico, or Southeast Asia. Manufacturers that remain in China for economic or strategic reasons will have to find dramatic ways to improve efficiency if they are to preserve current levels of profitability in the face of double-digit annual wage hikes. More-strategic decisions will have to be made when the time comes to consider where to build new manufacturing capacity to serve markets outside of China. Our analysis suggests that the U.S. will become an increasingly attractive option, espe- cially for products consumed in North America. As long as it provides a favorable investment climate and flexible labor force, the U.S. can look forward to a manufac- turing renaissance.
  • 60. The Boston Consulting Group 15 About the Authors Harold L. Sirkin is a senior partner and managing director in the Chicago office of The Boston Consulting Group and the author of GLOBALITY: Competing with Everyone from Everywhere for Every- thing. You may contact him by e-mail at [email protected] Michael Zinser is a partner and managing director in the firm’s Chicago office. You may contact him by e-mail at [email protected] Douglas Hohner is a partner and managing director in BCG’s Chicago office. You may contact him by e-mail at [email protected] Acknowledgments This report would not have been possible without the efforts of Justin Rose, Chris Erickson, and Jonas Bengtson of BCG’s project team. The authors also would like to thank David Fondiller, Lexie Corriveau, Beth Gillette, and Mike Petkewich for their guidance and interactions with the media, Pete Engardio for his writing assistance, and BCG’s editorial and production staff, including Gary Callahan, Angela DiBattista, Abby Garland, Sean Hourihan, and Gina Goldstein. For Further Contact If you would like to discuss this Focus report, please contact one of the authors. For a complete list of BCG publications and information about
  • 61. how to obtain copies, please visit our website at www.bcg.com/publications. To receive future publications in electronic form about this topic or others, please visit our subscription website at www.bcg.com/subscribe. © The Boston Consulting Group, Inc. 2011. All rights reserved. 8/11 Abu Dhabi Amsterdam Athens Atlanta Auckland Bangkok Barcelona Beijing Berlin Boston Brussels Budapest Buenos Aires Canberra Casablanca Chicago Cologne Copenhagen Dallas Detroit Dubai Düsseldorf Frankfurt
  • 62. Geneva Hamburg Helsinki Hong Kong Houston Istanbul Jakarta Johannesburg Kiev Kuala Lumpur Lisbon London Los Angeles Madrid Melbourne Mexico City Miami Milan Minneapolis Monterrey Moscow Mumbai Munich Nagoya New Delhi New Jersey New York Oslo Paris Perth Philadelphia Prague Rio de Janeiro Rome