Downloaded 134 times
![Wilson Perumal & Company, Inc. 2
Why isn’t it getting any easier?
[2013] Garment factory tragedy directly impacts a
number of multi-nationals including Wal-Mart Stores Inc.,
Sears Holding Co. and The Walt Disney company.
“Never has so much technology and brainpower been applied to improving supply
chain performance… nonetheless, the performance of many supply chains has
never been worse.” -- Prof. Marshal Fisher (Harvard Business Review)
1997
[2014/2015] Reuters reports on more 787 production
problems which Boeing refers to as “output hiccups”.
Noted are “unusual shifts” in the company’s supply chain.
[2012] Best Buy’s much-publicized failure to fulfill many
online orders in time for Christmas exposed ongoing problems
that hadn’t been resolved. Critics suggest “avoid them”.](https://image.slidesharecdn.com/wilsonperumalsupplychaincomplexity-150522202439-lva1-app6891/75/Supply-Chain-Complexity-The-growing-challenge-for-performance-2-2048.jpg)
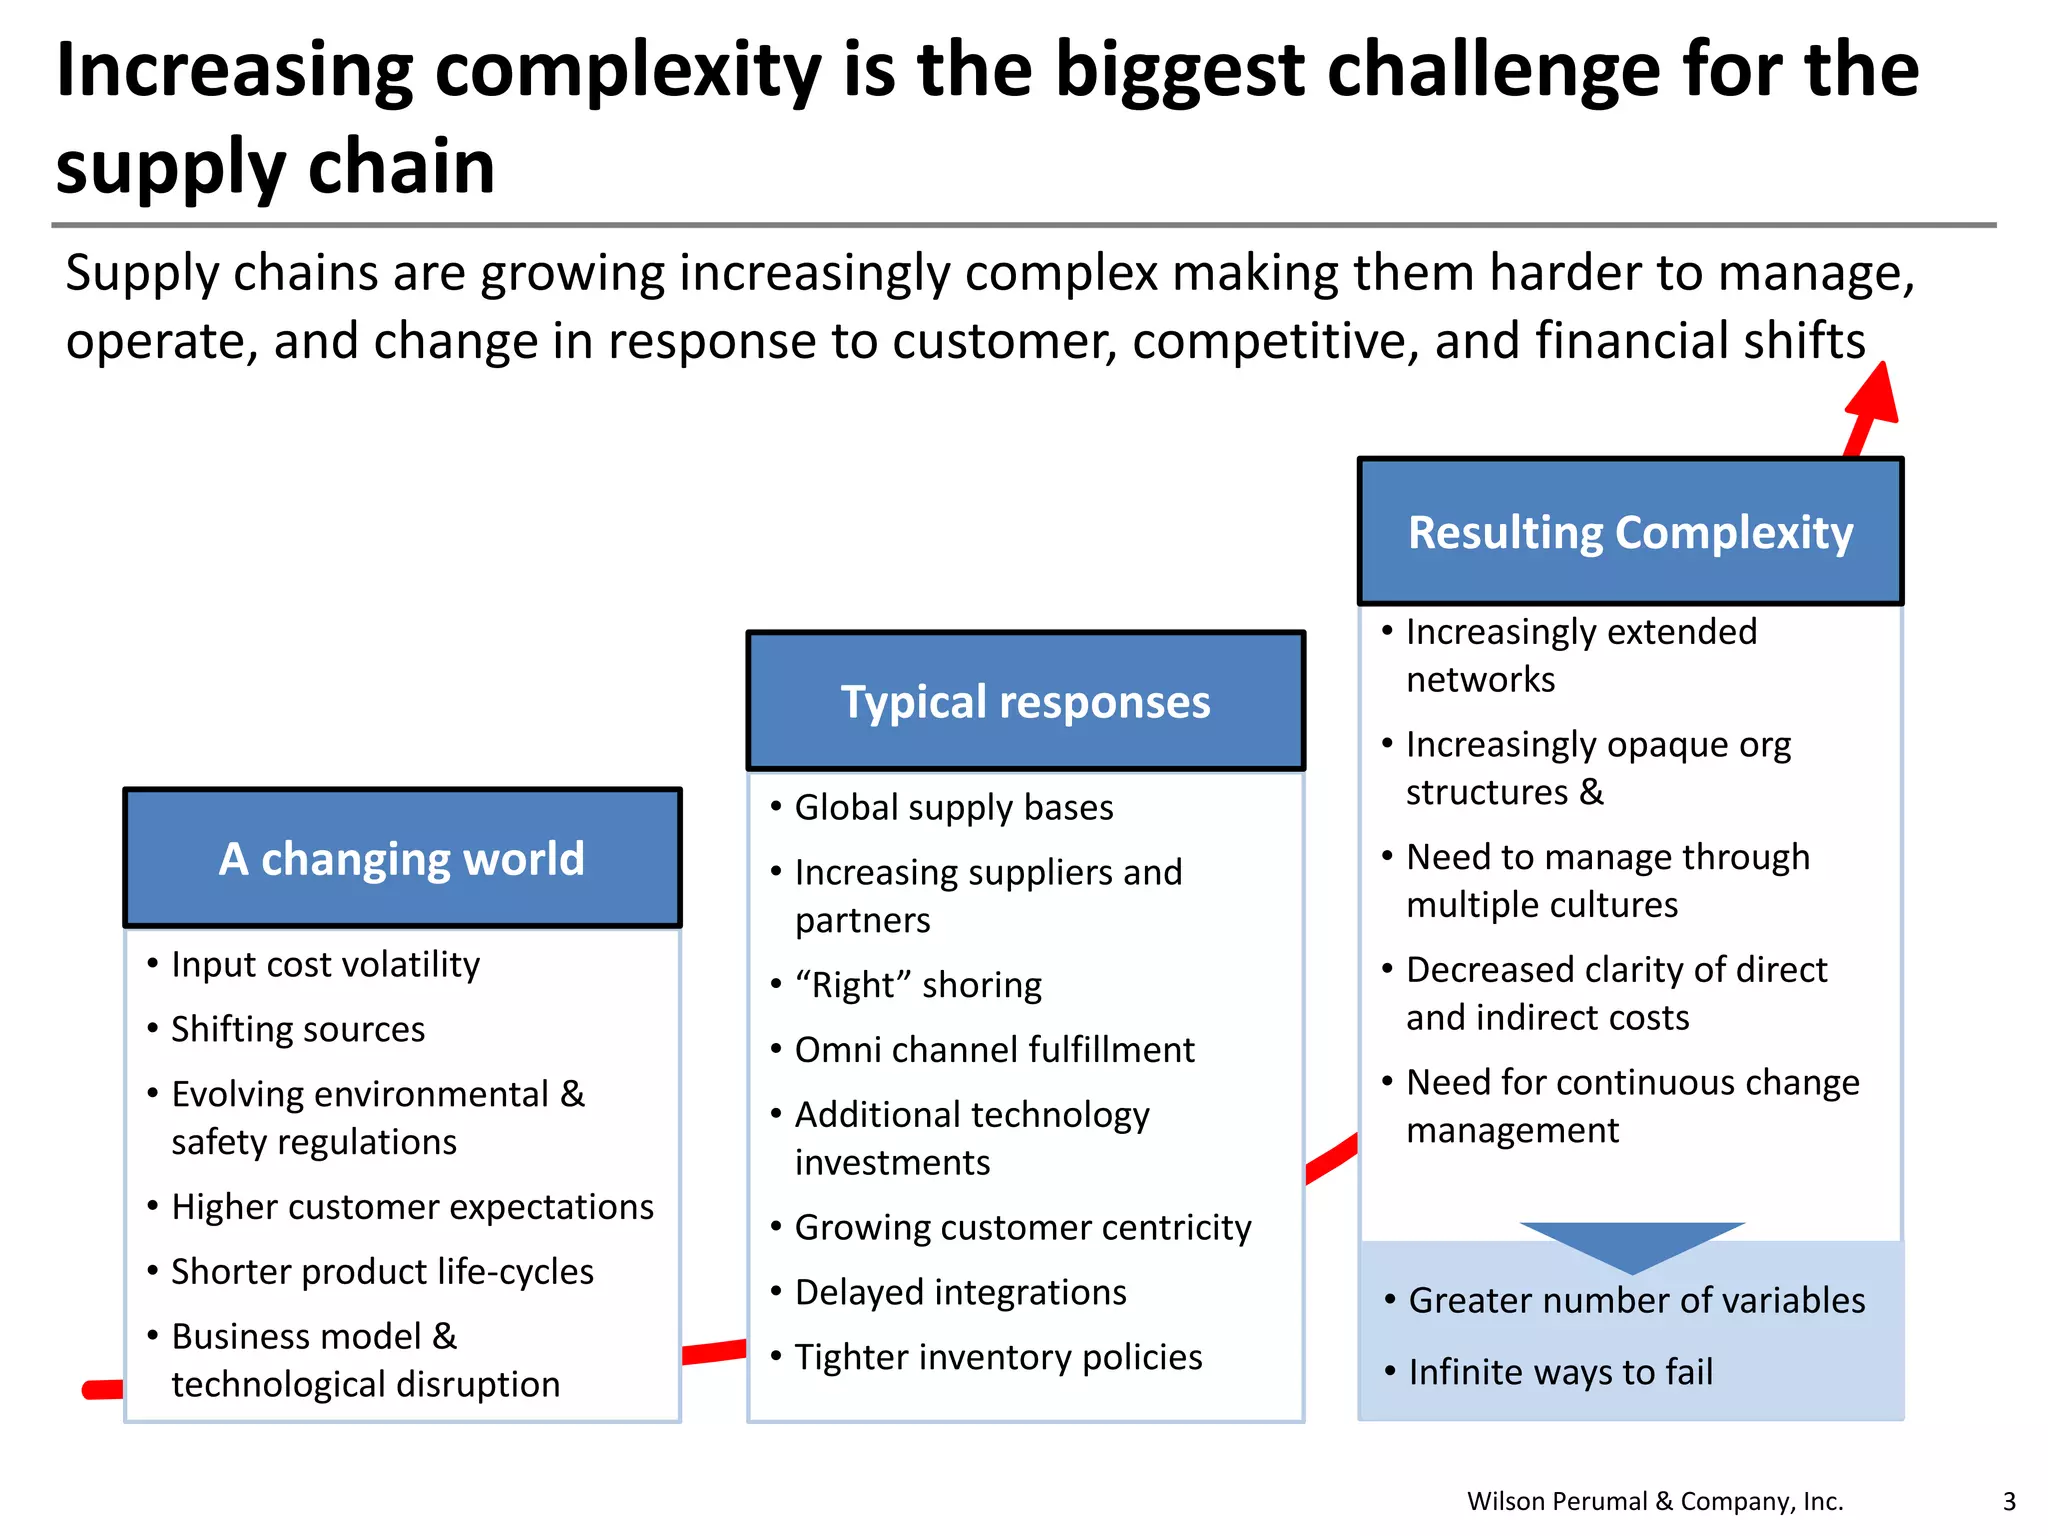
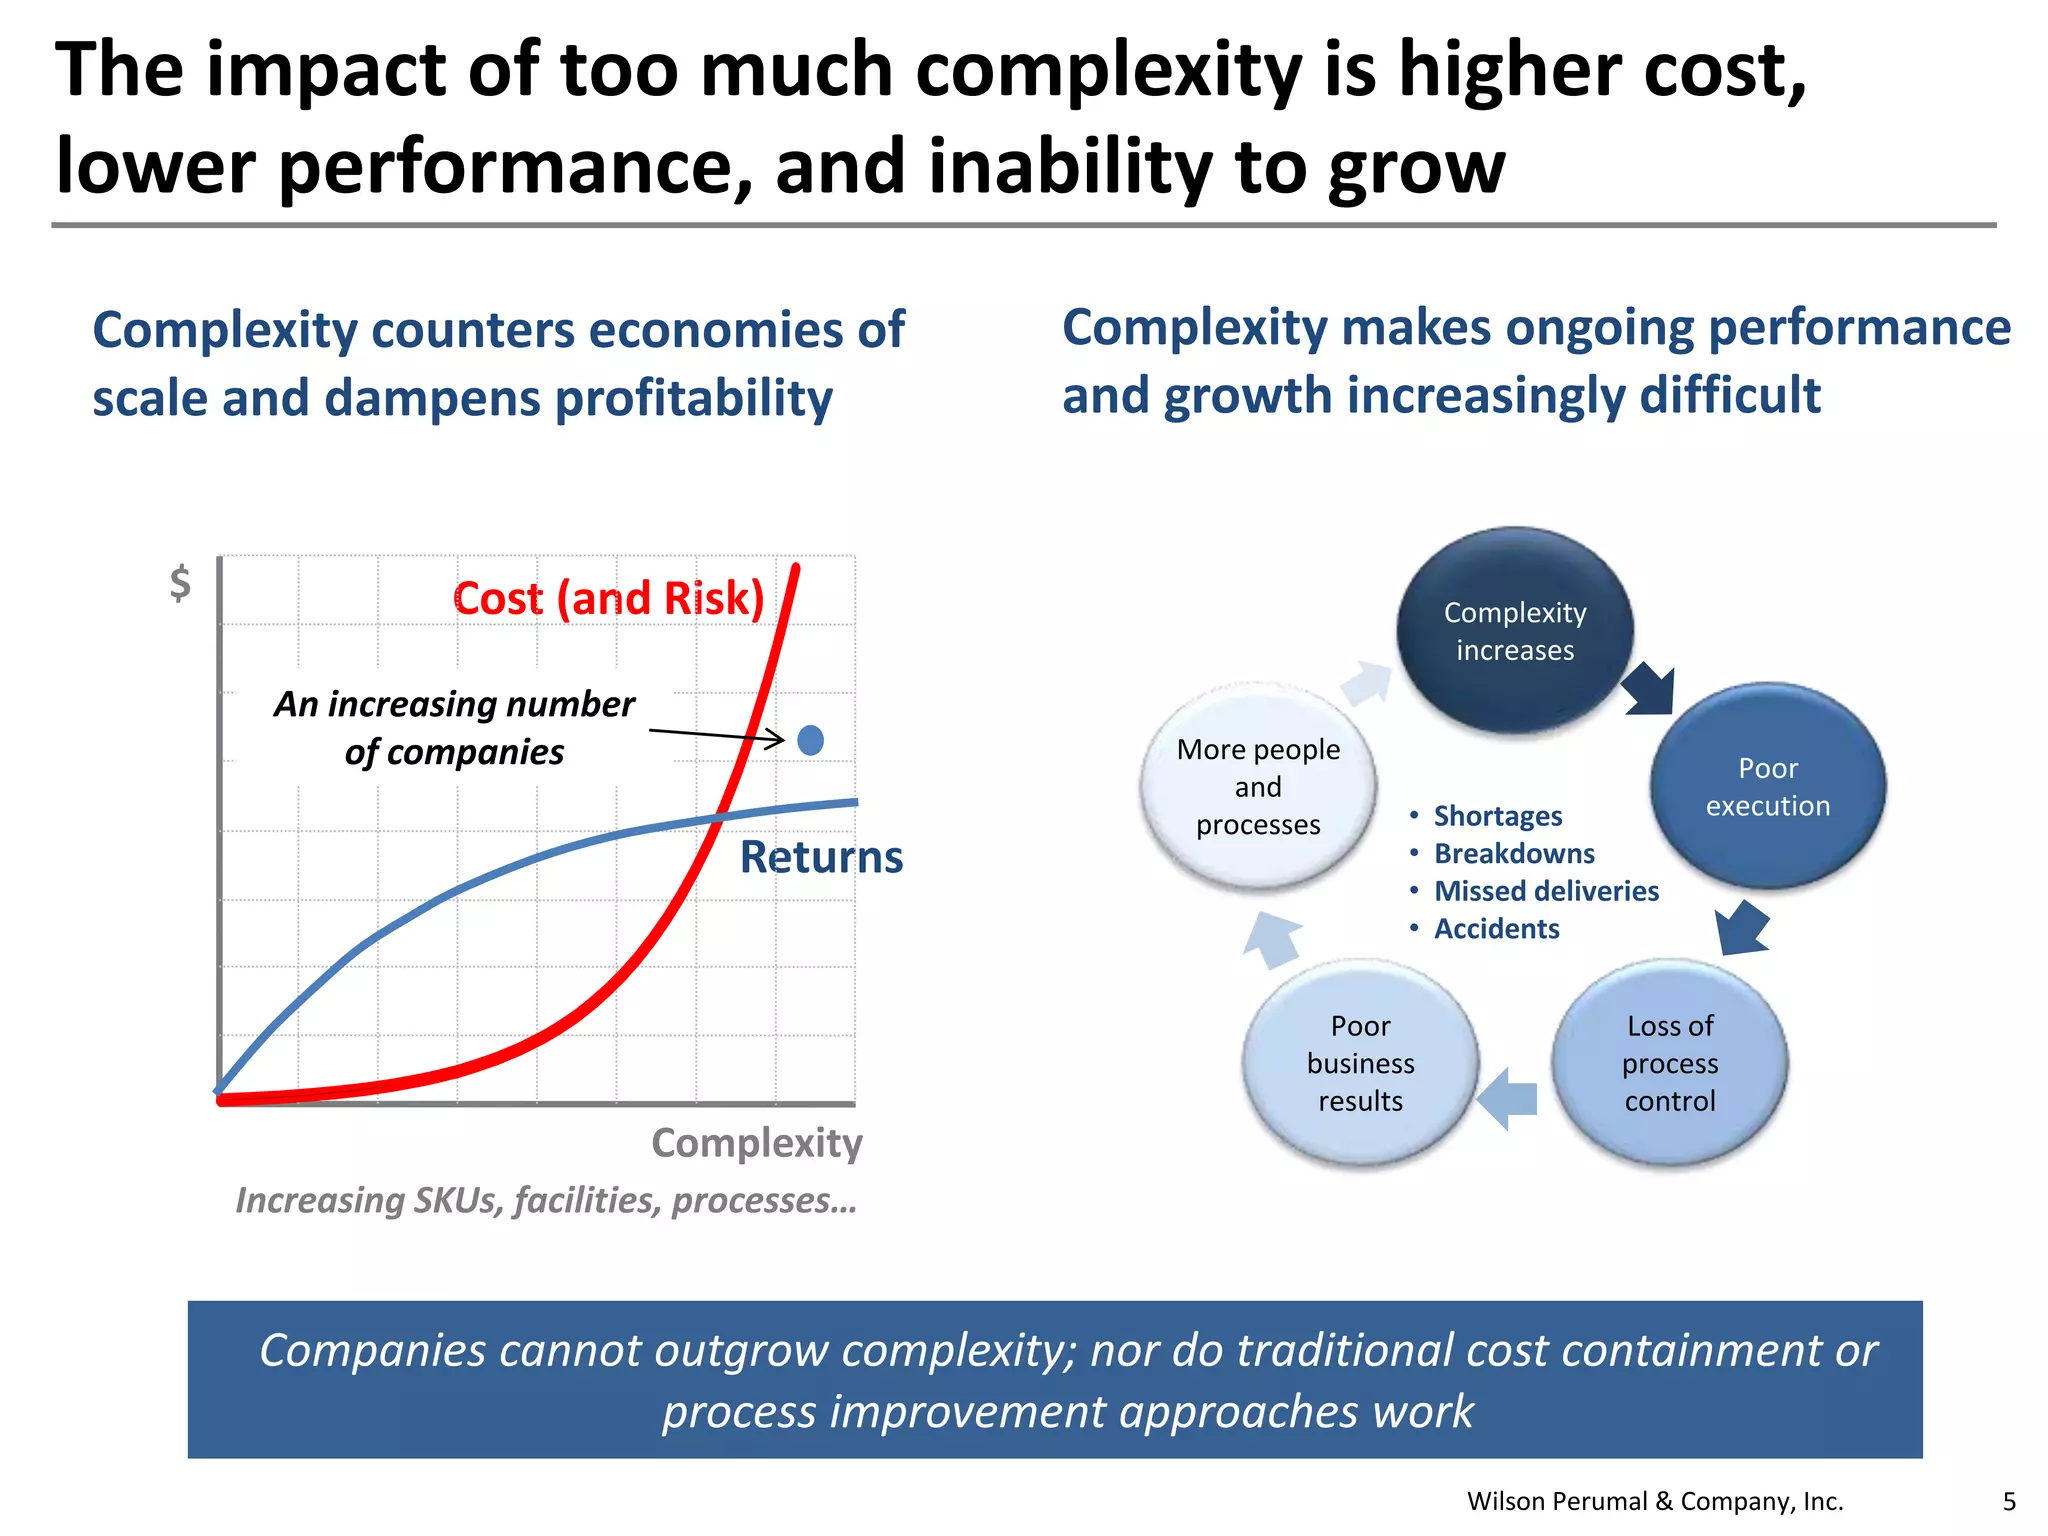
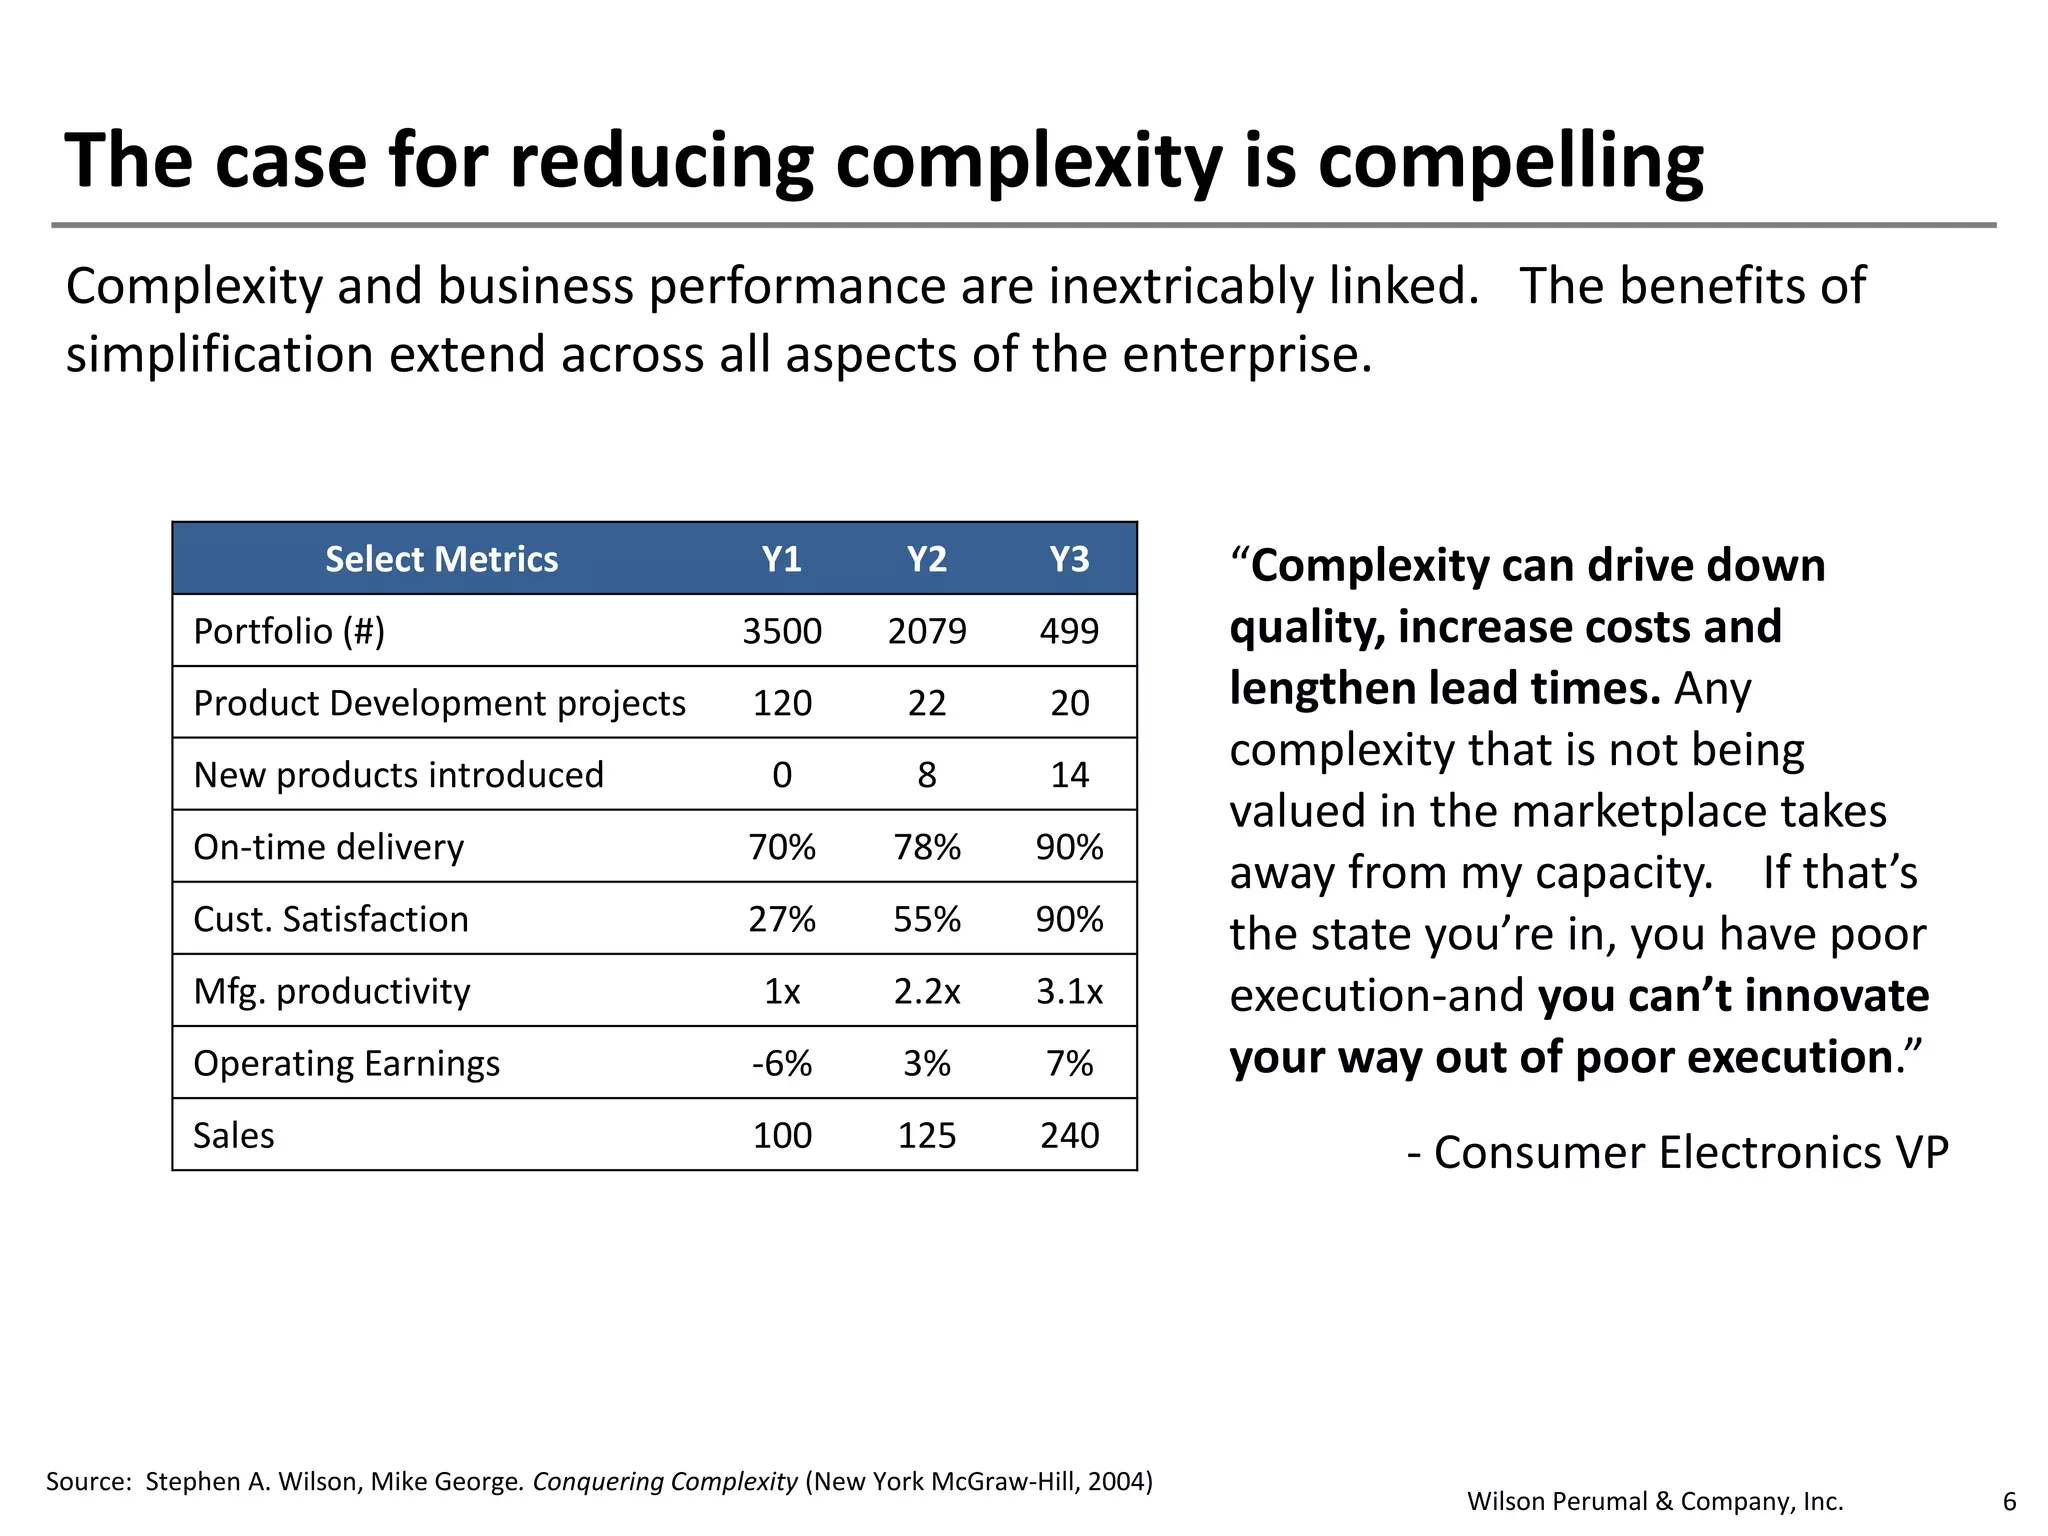
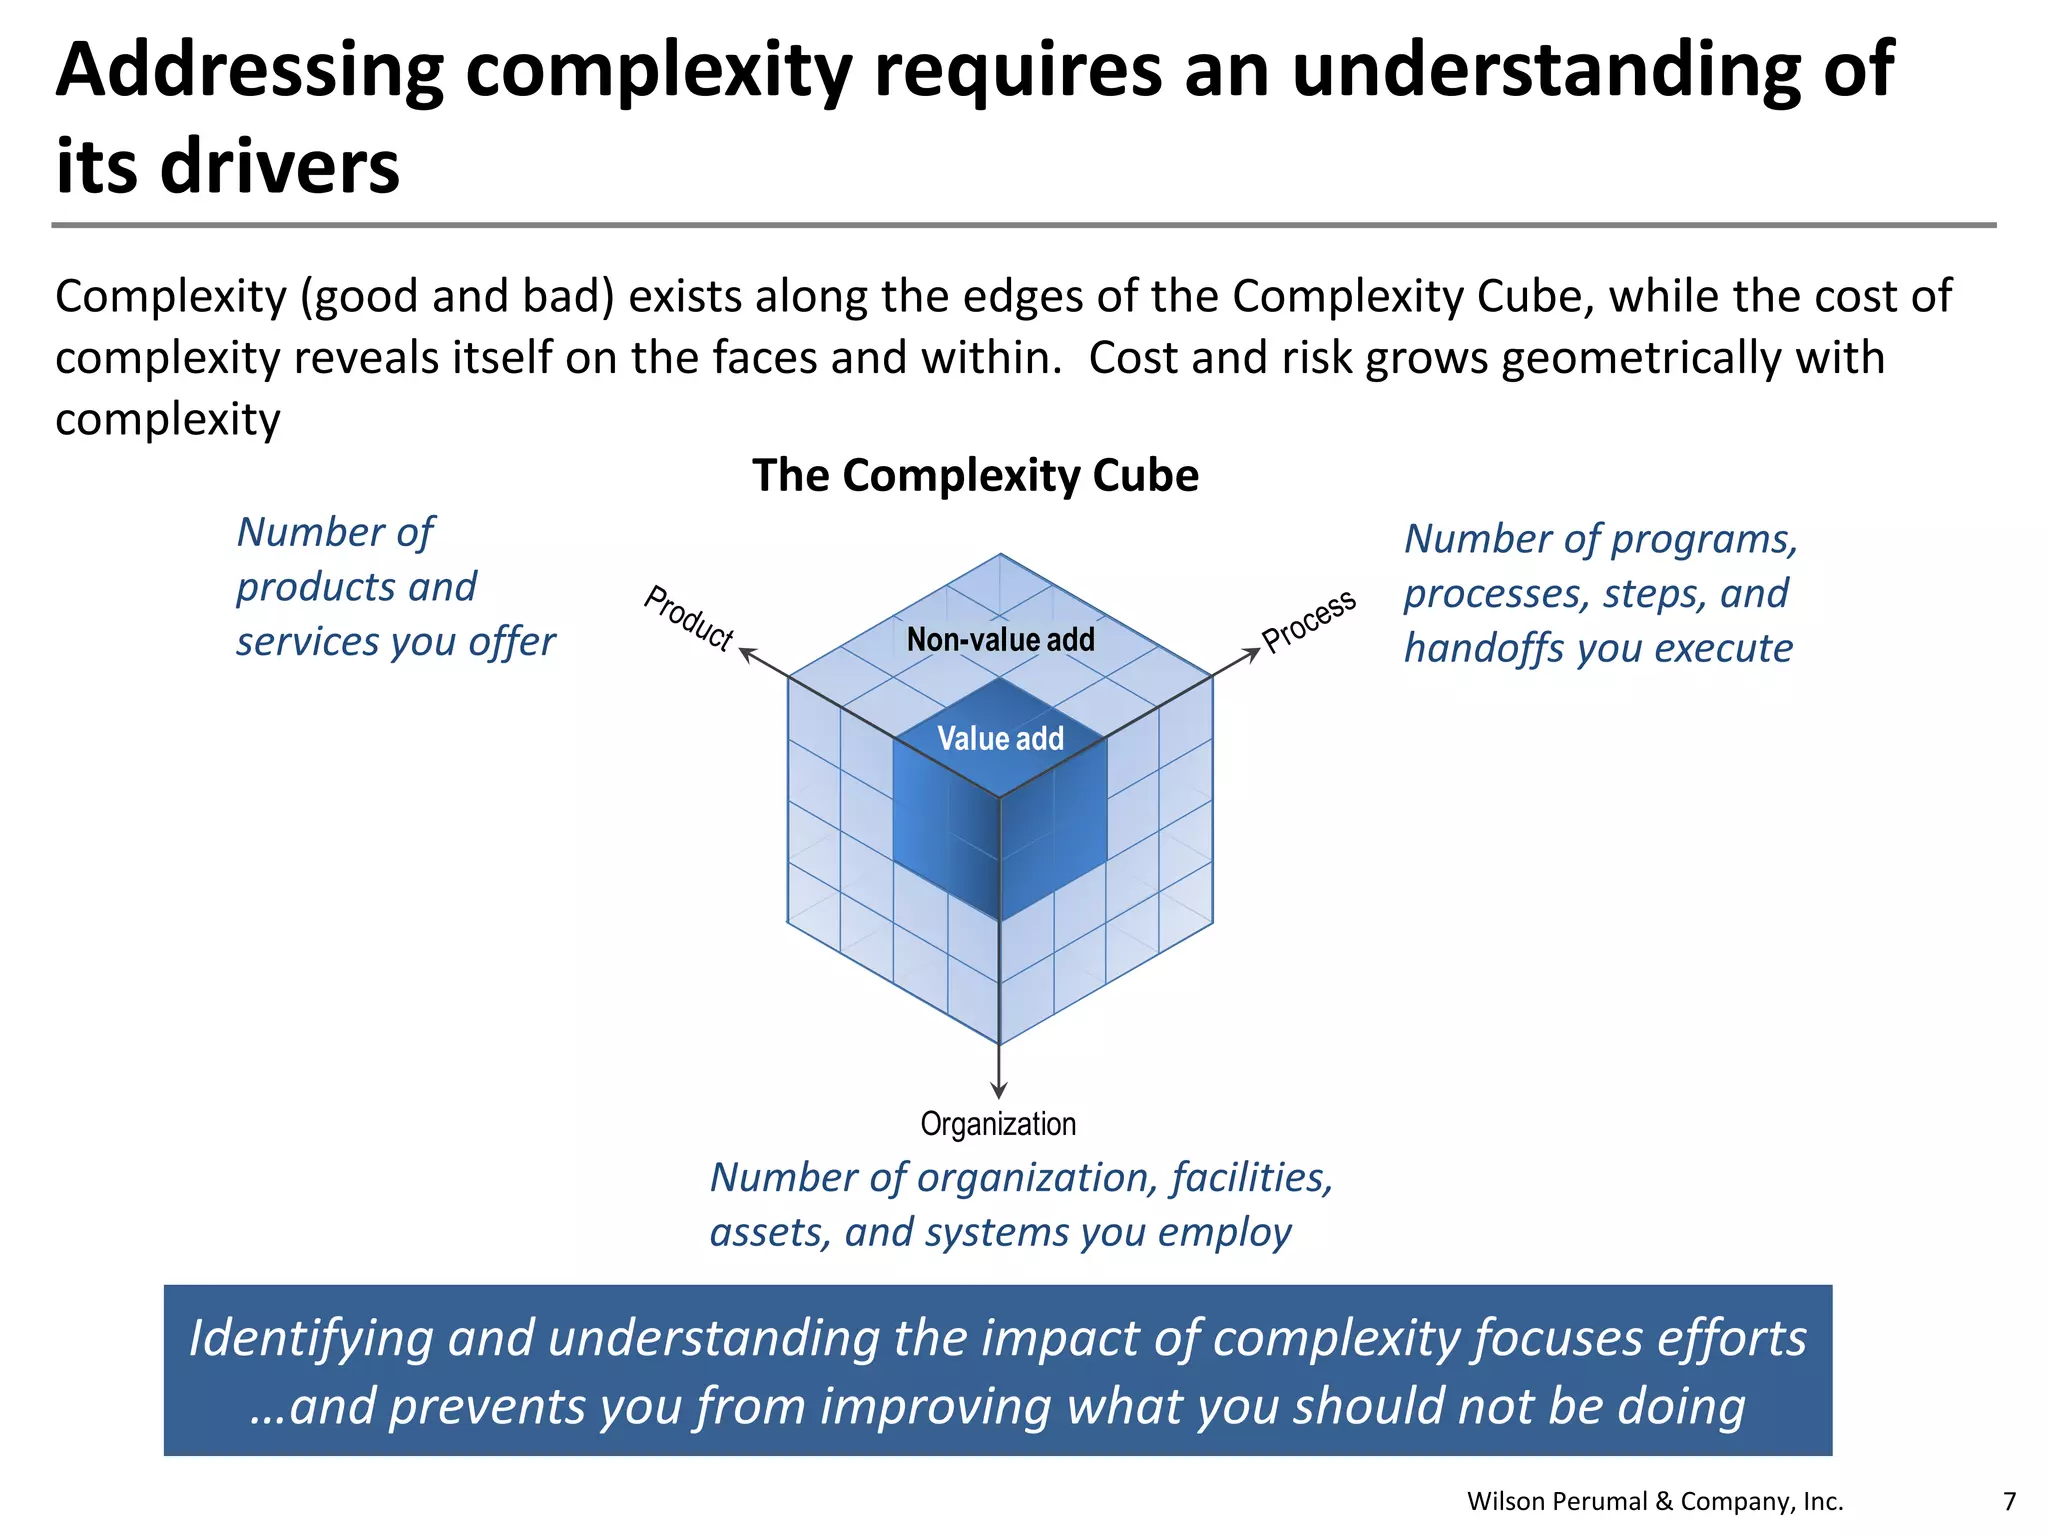
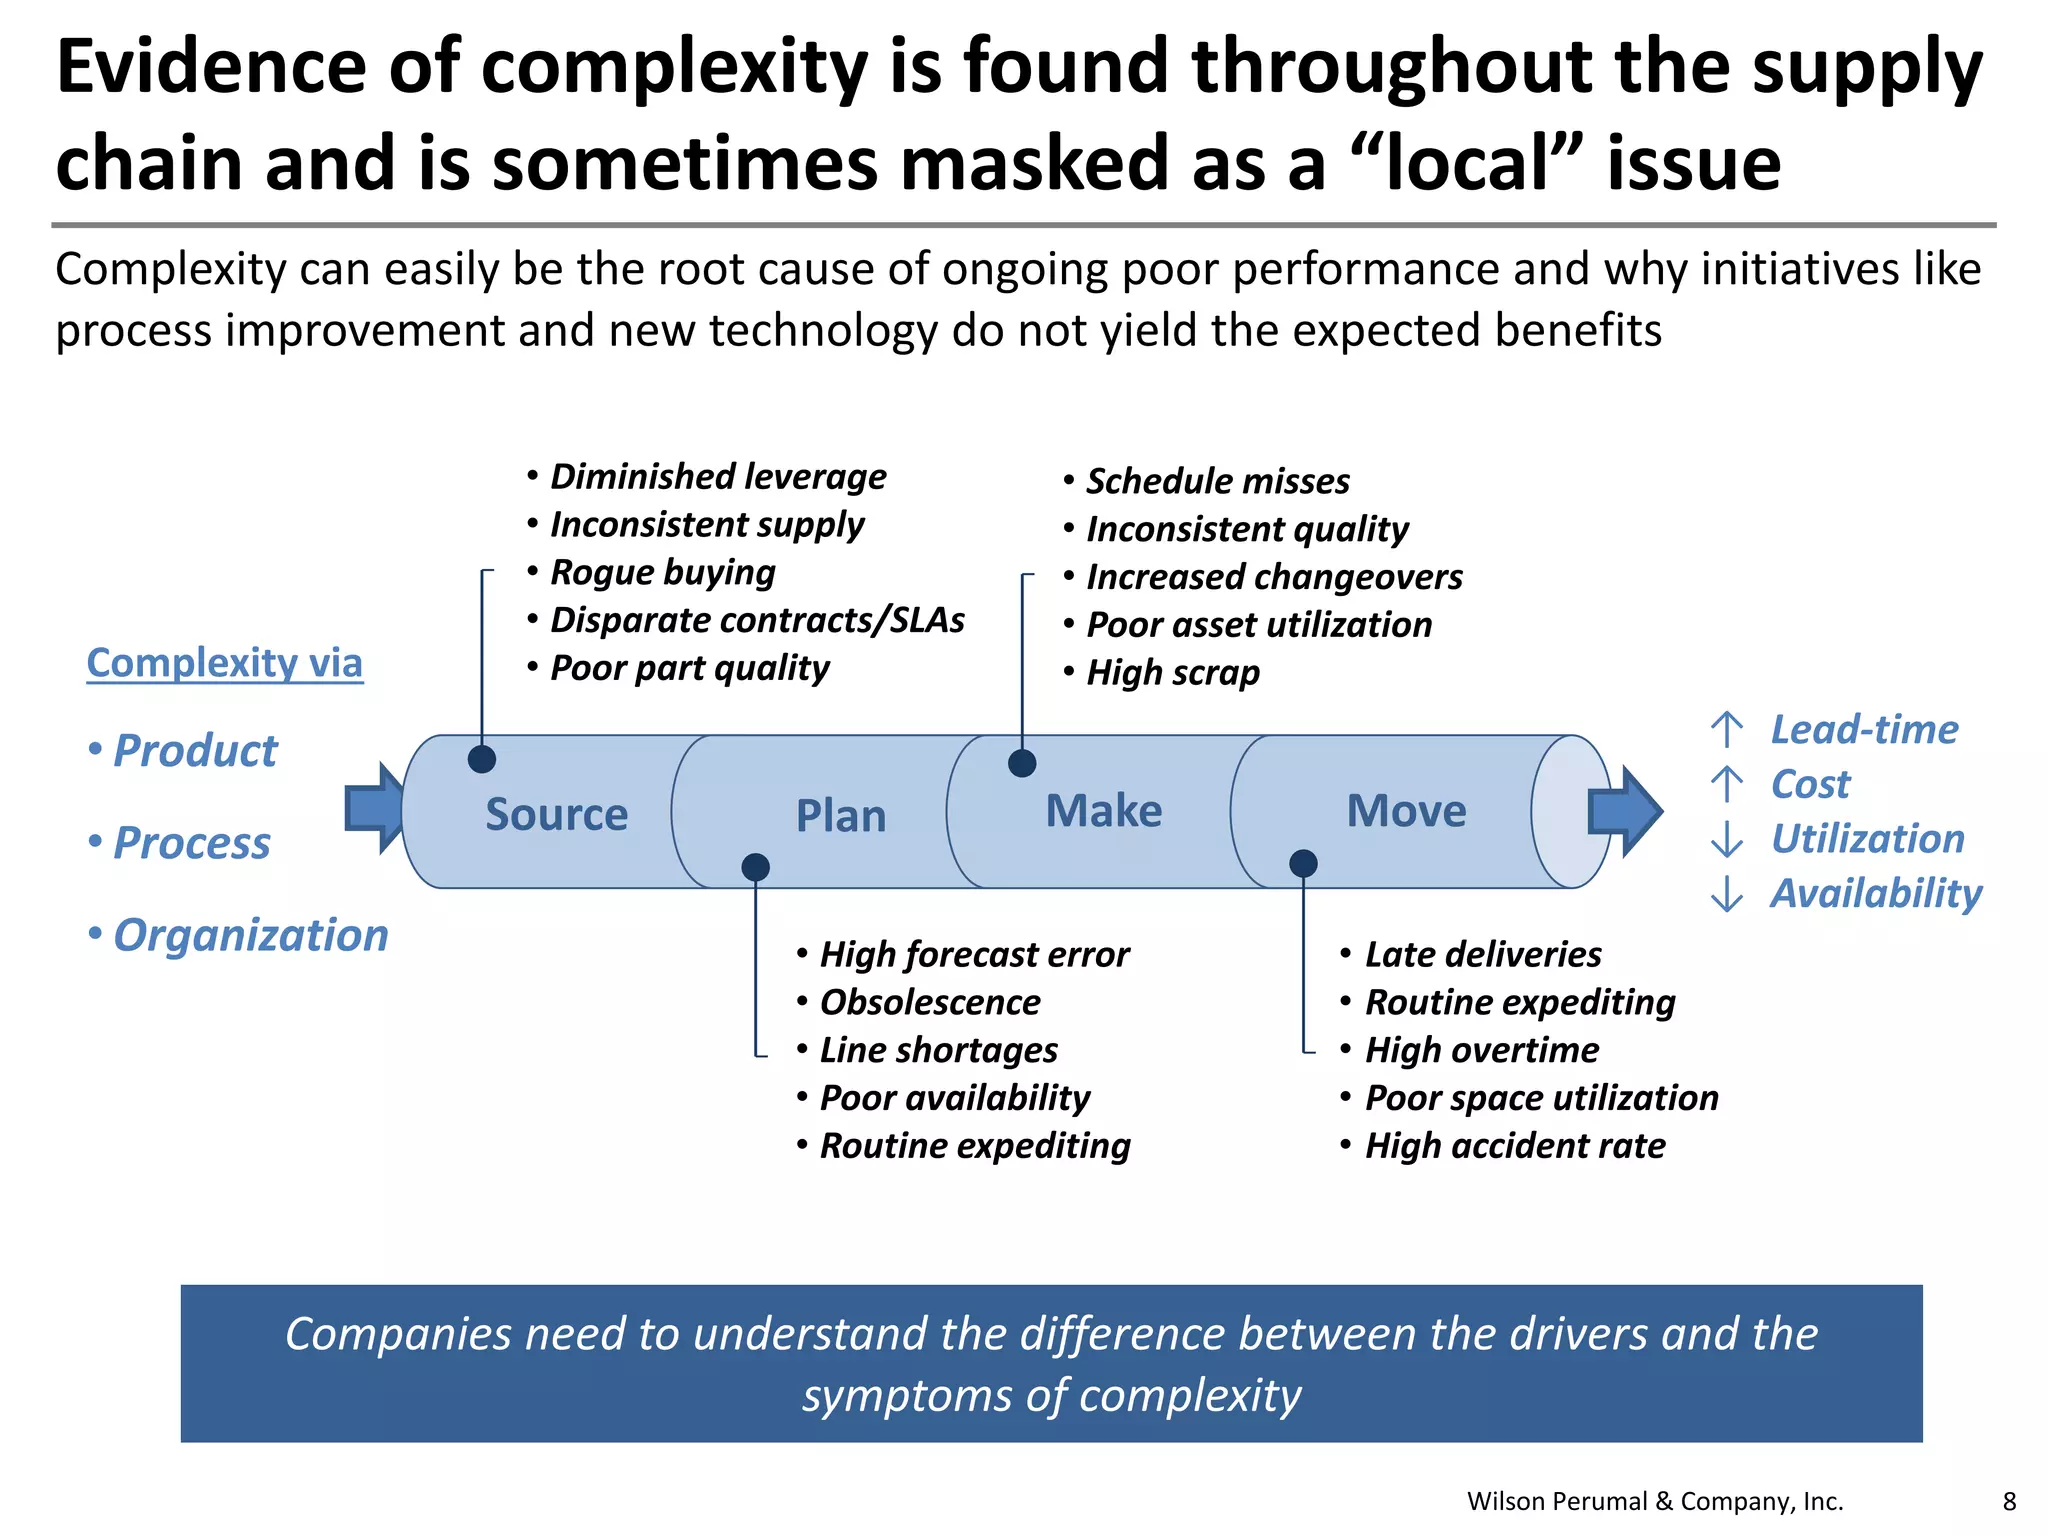
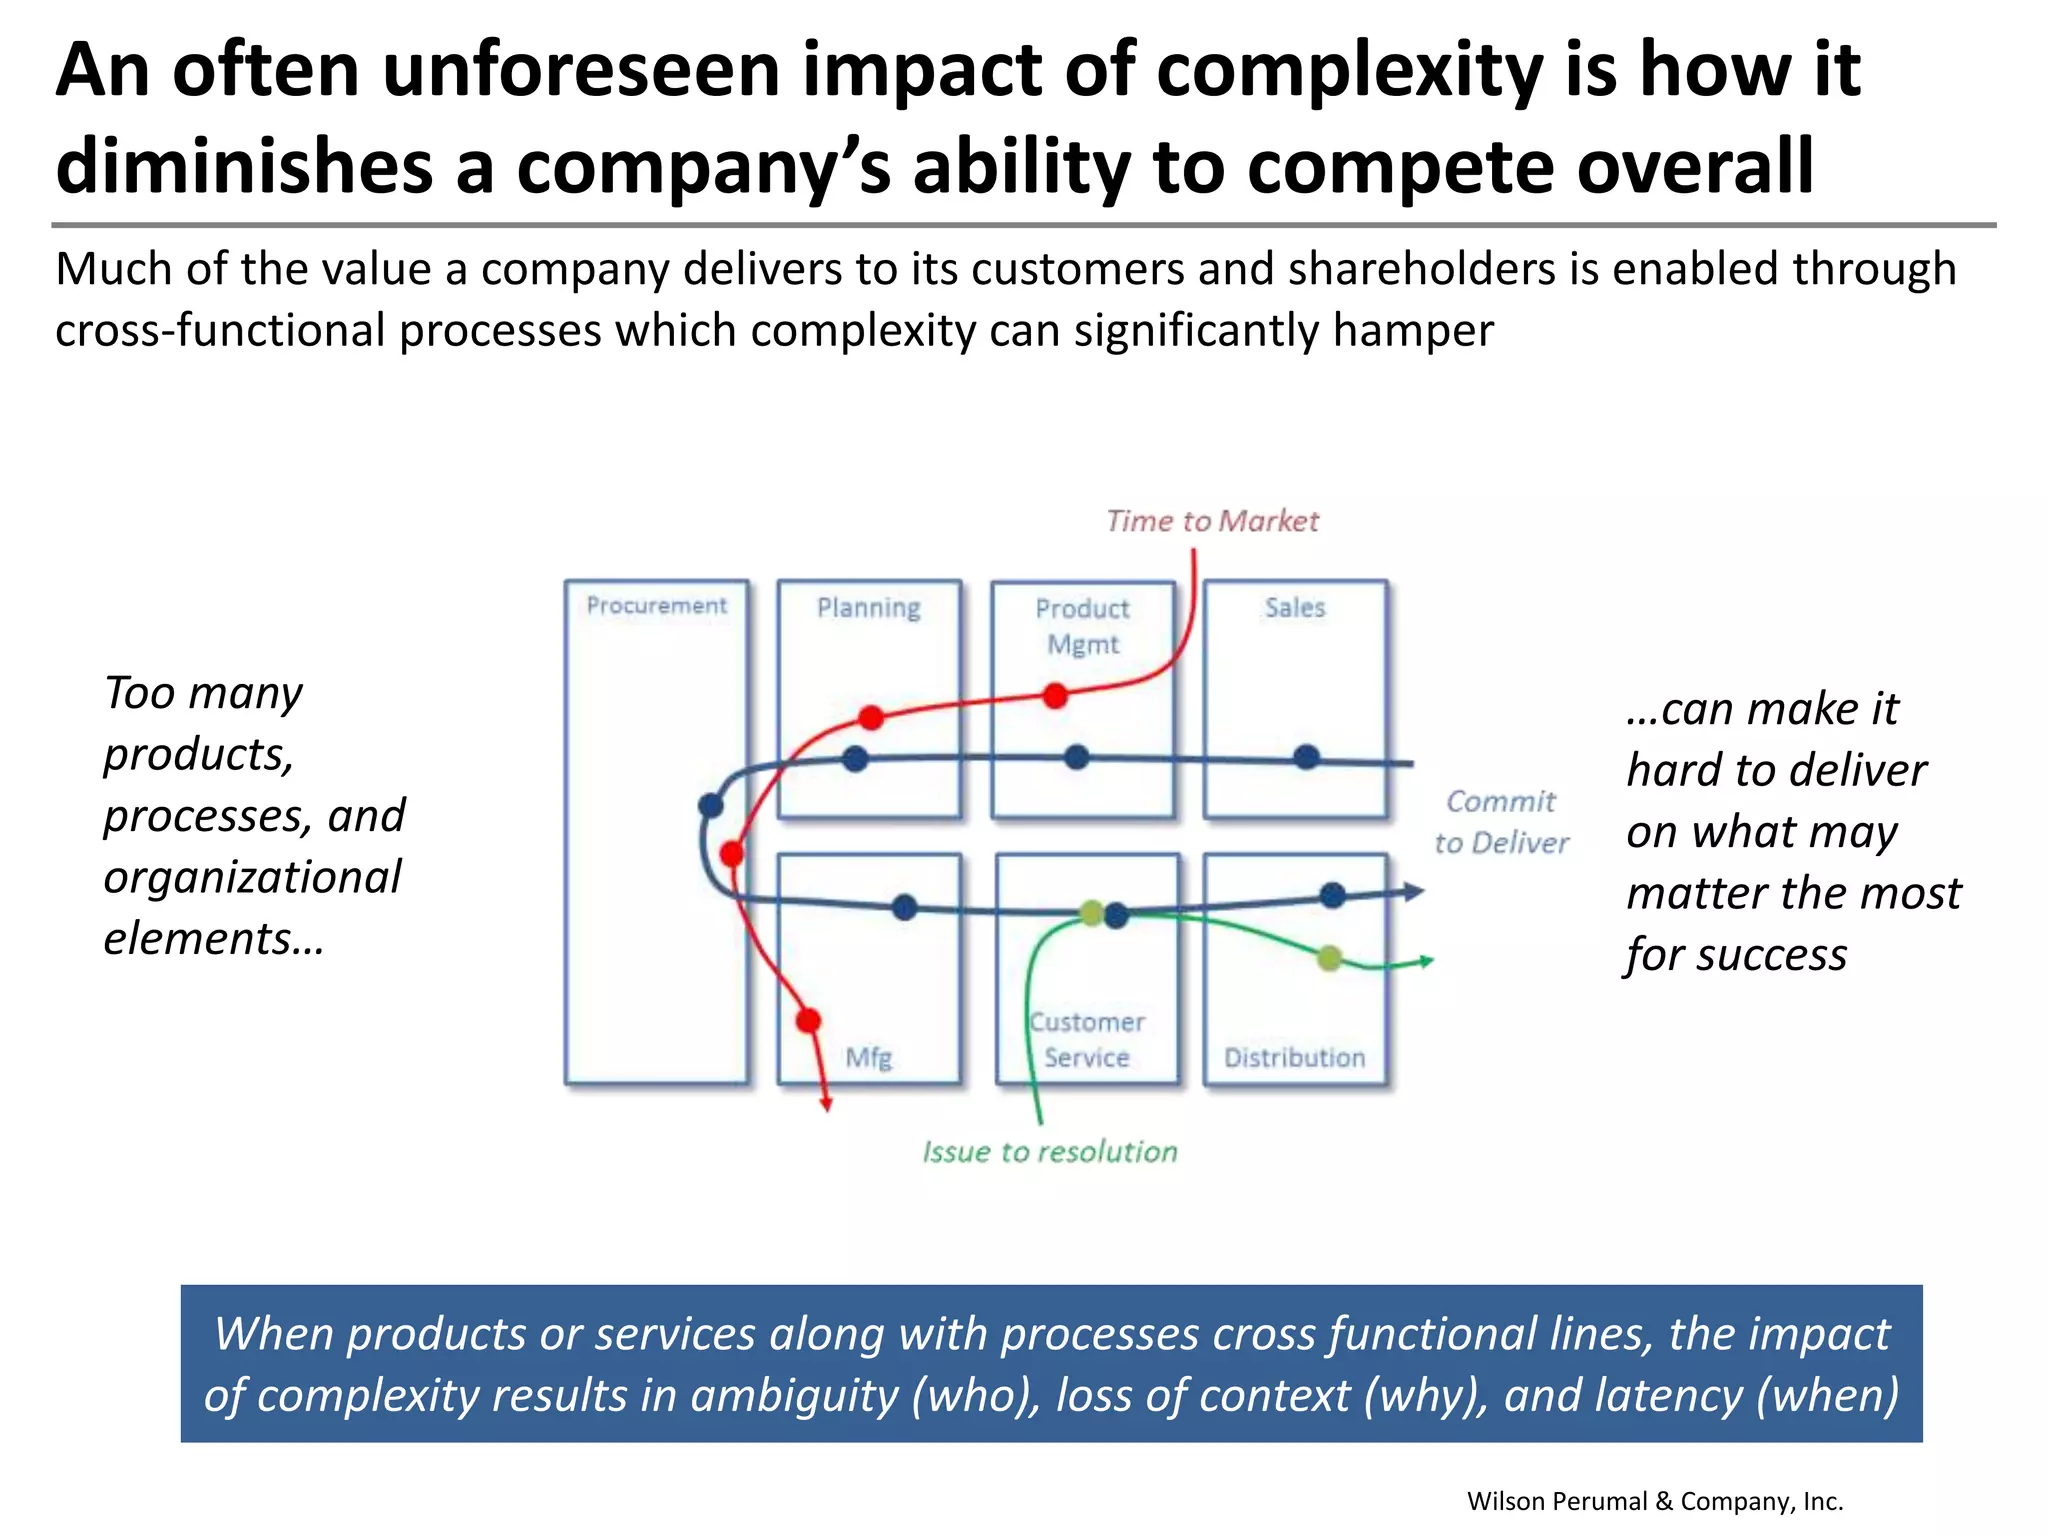
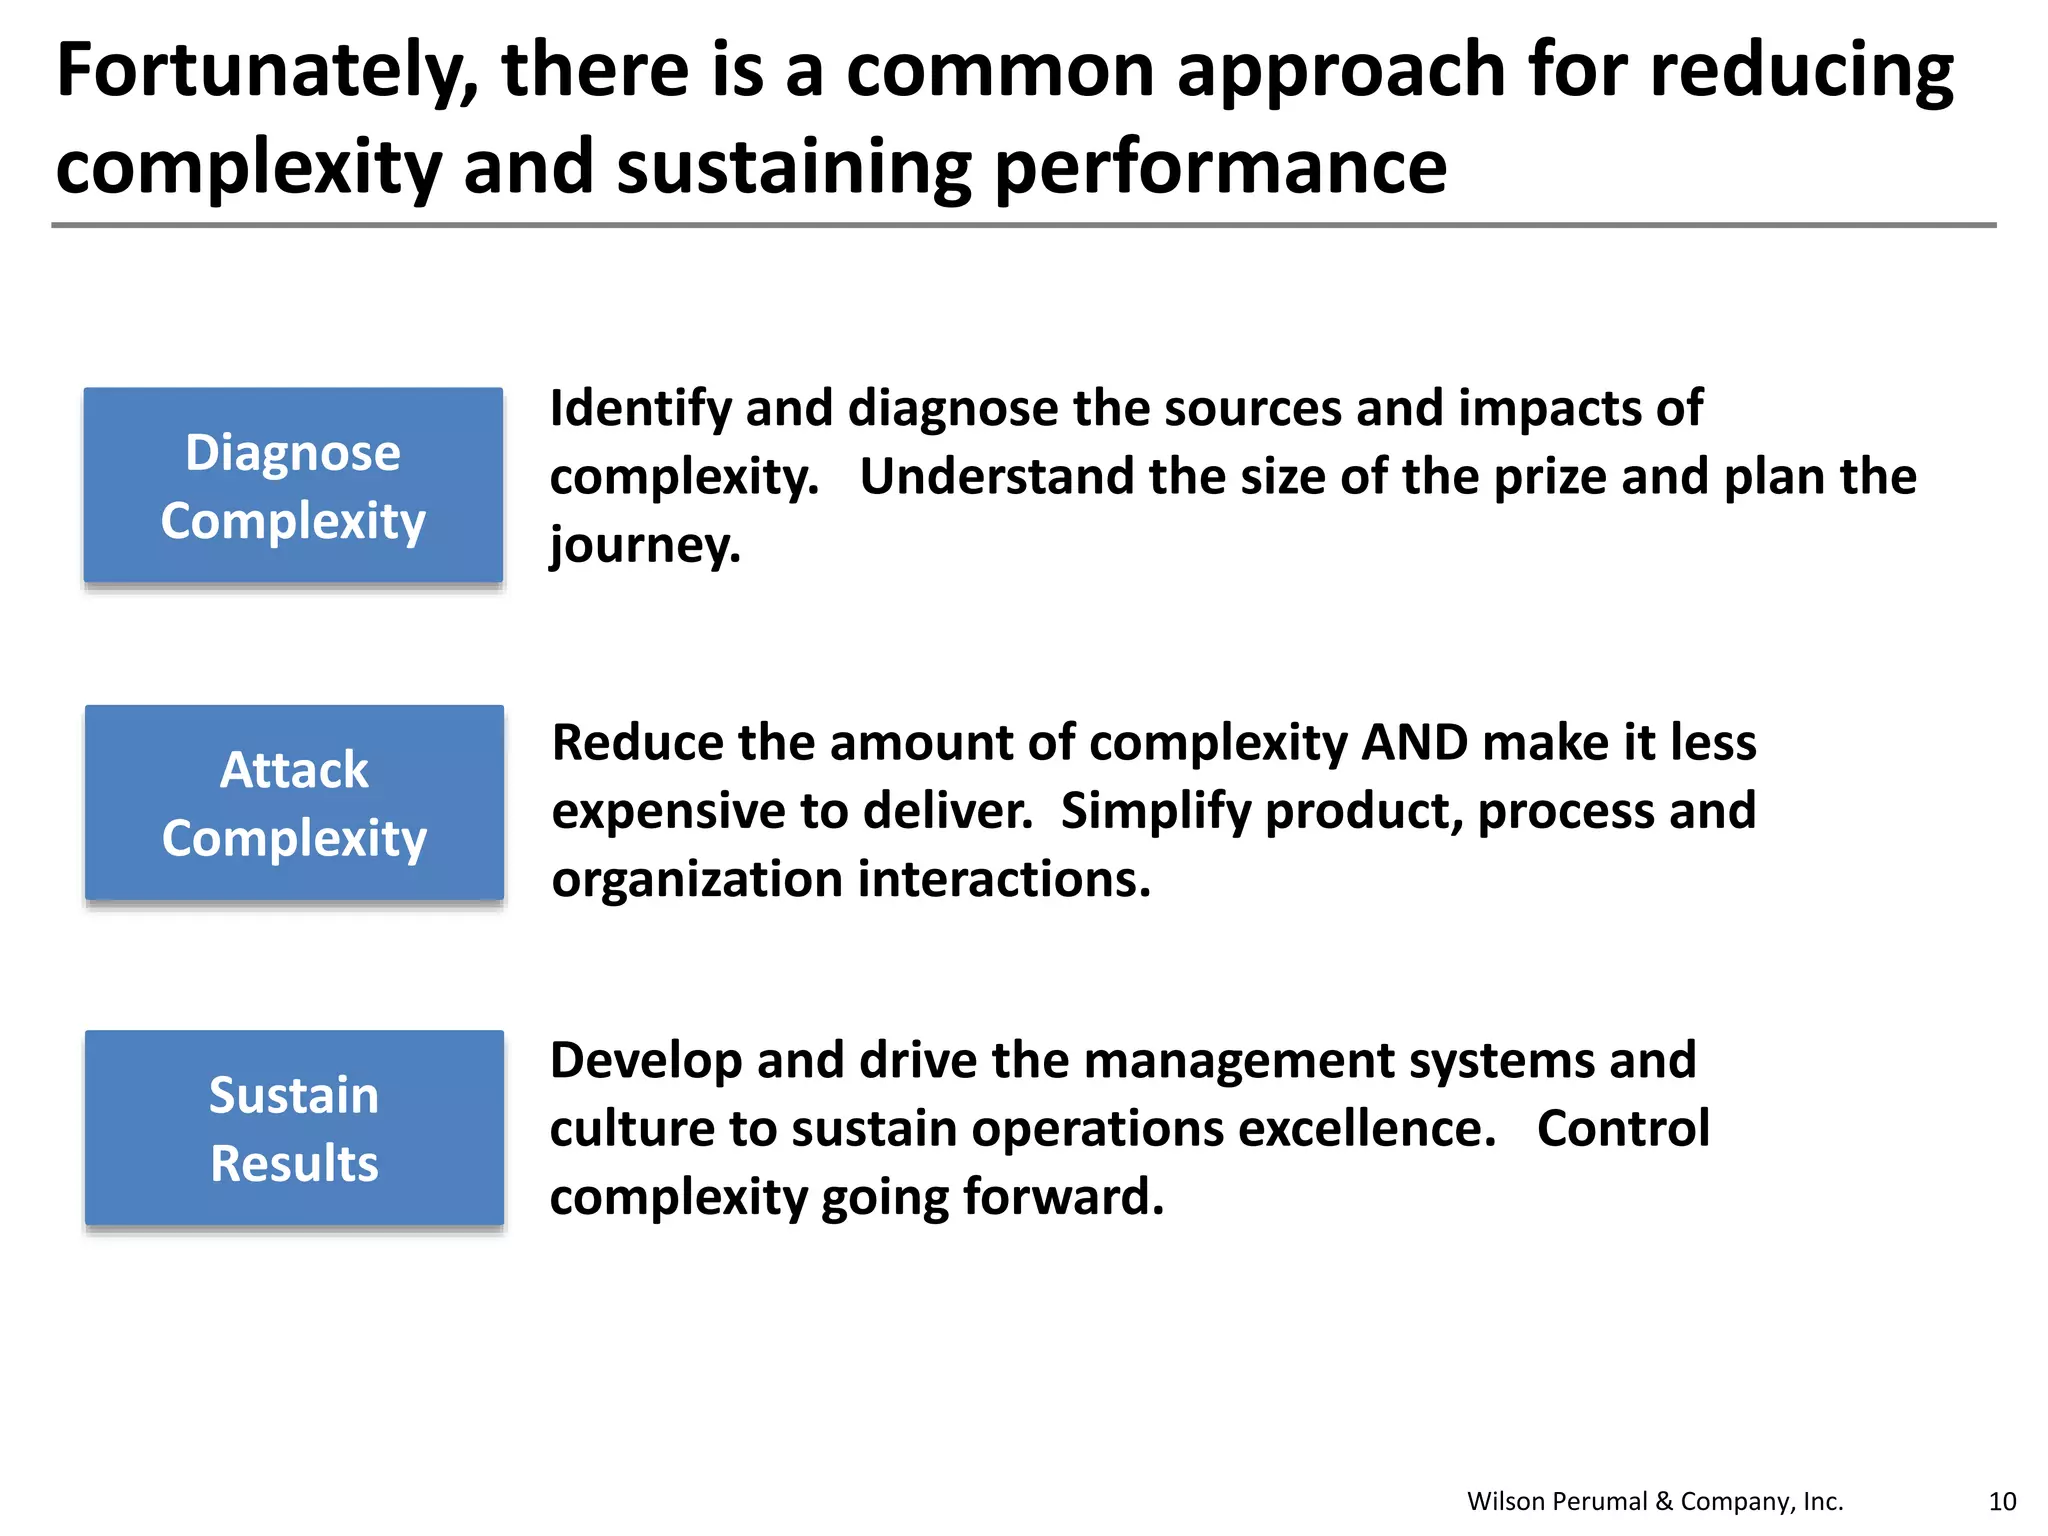
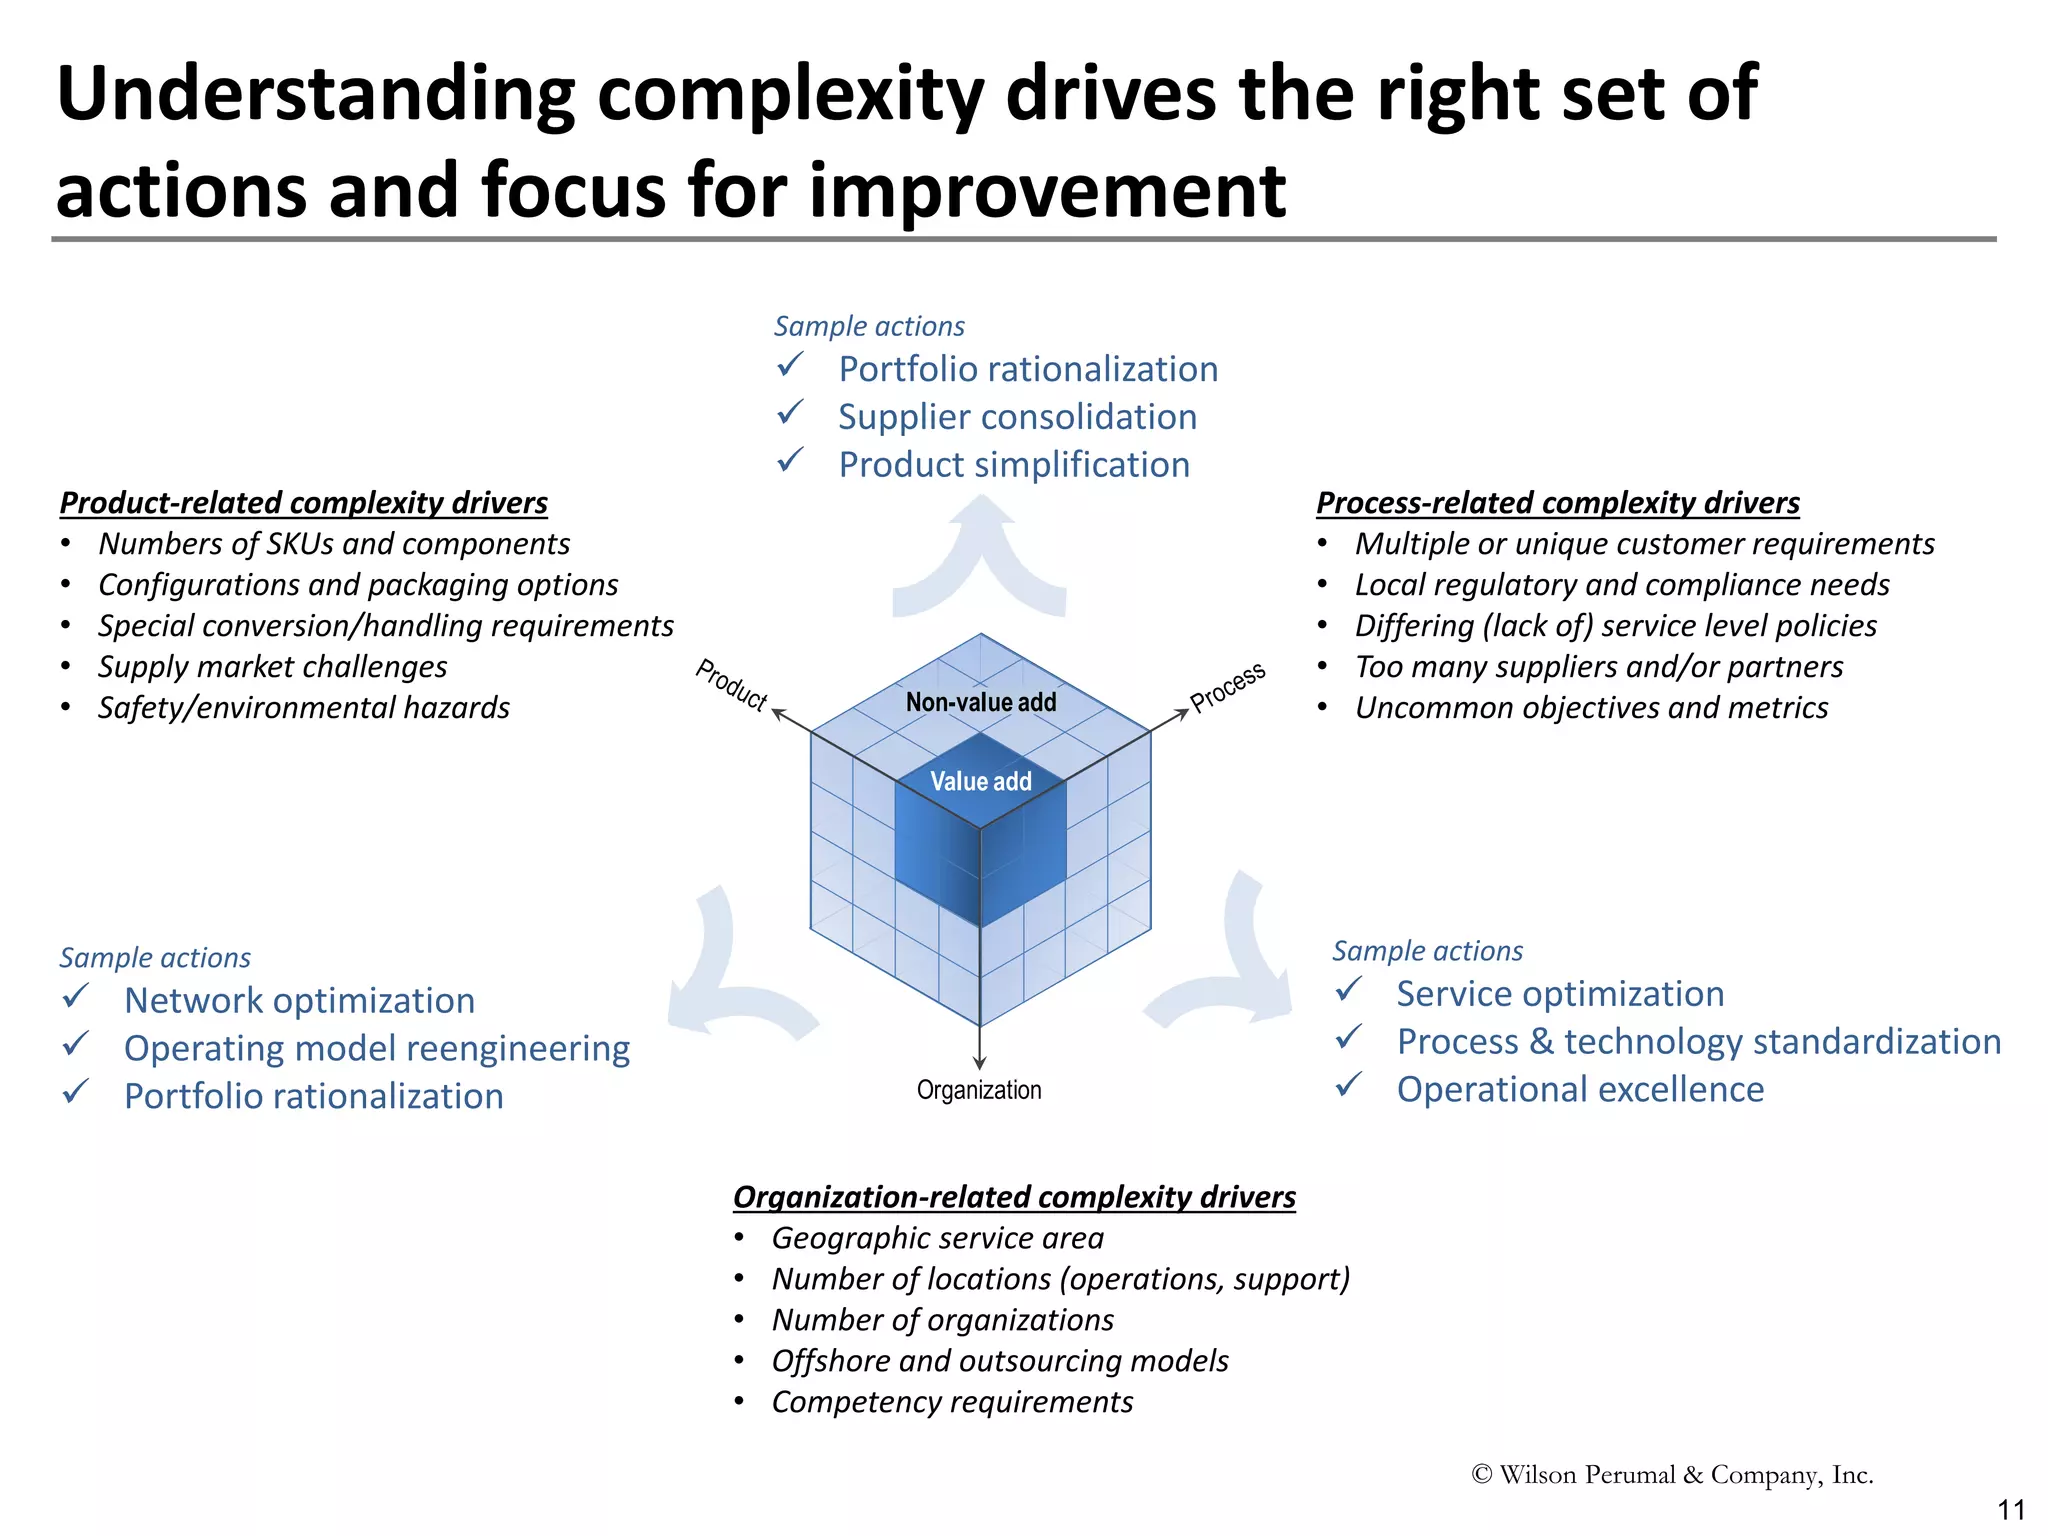
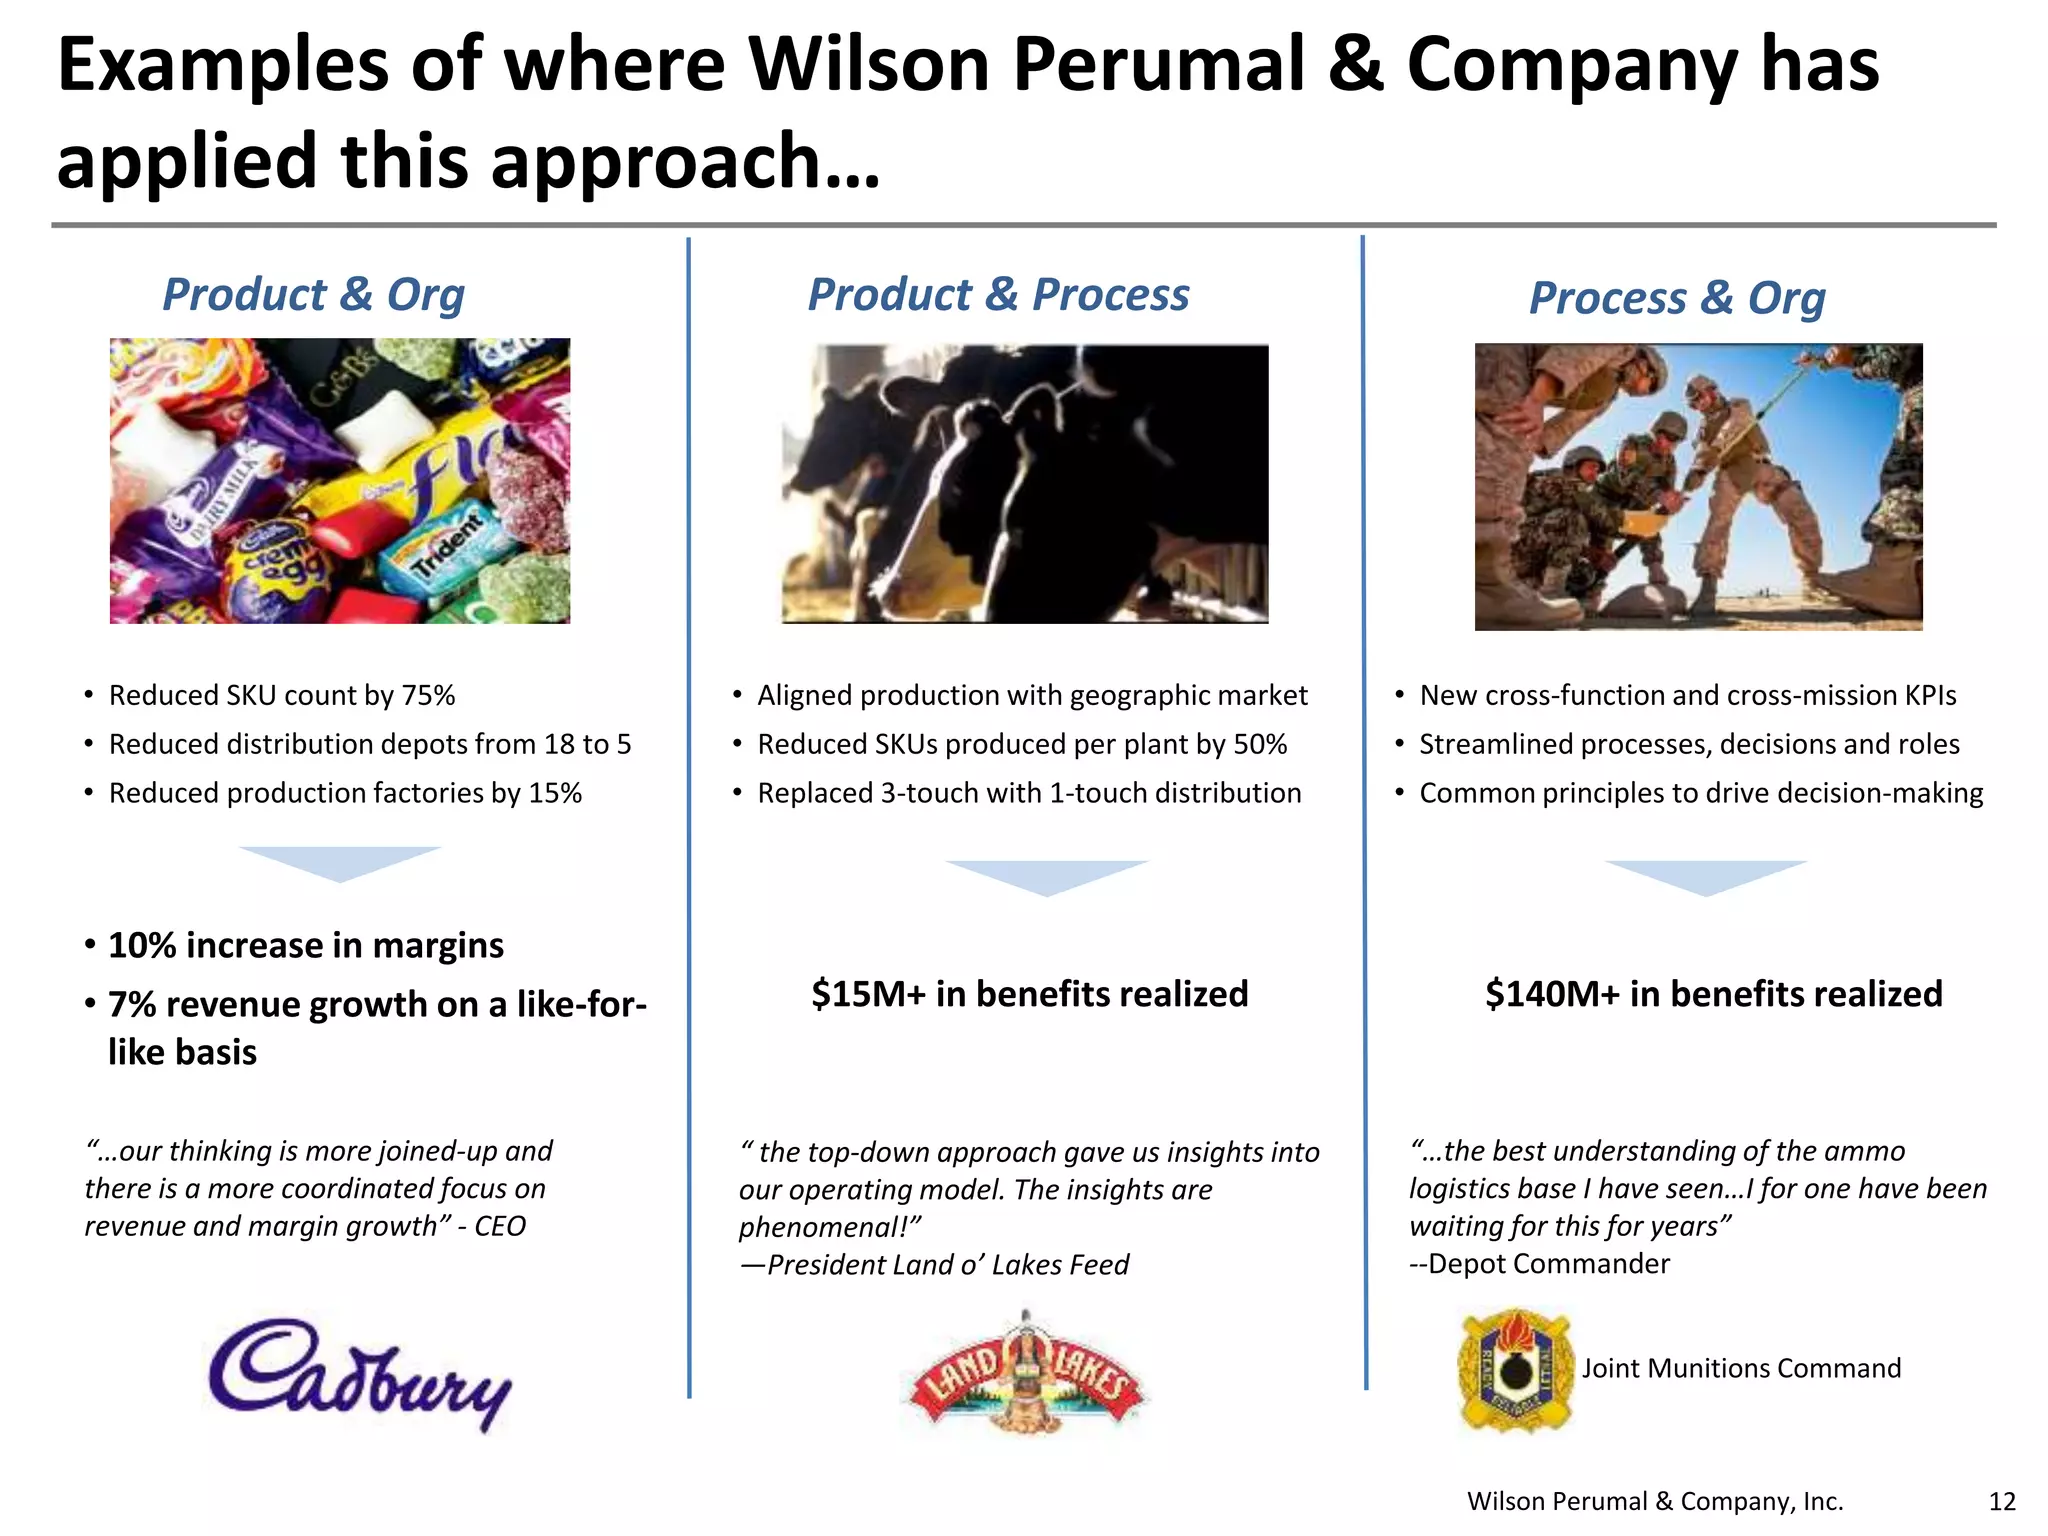

The document discusses the escalating complexity in supply chains and its detrimental effects on performance, highlighting various factors such as input cost volatility, evolving regulations, and higher customer expectations. It emphasizes that increased complexity leads to higher costs, lower performance, and challenges in sustaining growth, urging organizations to address and simplify complexity for operational efficiency. Strategies for tackling complexity include diagnosing its sources, attacking unnecessary drivers, and sustaining improved operations through streamlined processes and organizational changes.