Downloaded 54 times


![©W il so n Per uma l & C o mpa ny , Inc .©W il so n Per uma l & C o mpa ny , Inc .© Wilson Perumal & Company, Inc. 19
20%
15%
25%
33%
-17%
17%
11%
27%
20%
-37%
-50%
-40%
-30%
-20%
-10%
0%
10%
20%
30%
40%
Segment 1 Segment 2 Segment 3 Segment 4 Segment 5
Standard
Complx-adj
High-complexity [segment 4] was actually less profitable than
lower-complexity [segment 3]
OP by Product Segment
EXAMPLE:](https://image.slidesharecdn.com/140522-sfcsoconferencesimplifyforgrowthvf-140530114732-phpapp02/75/Simplify-to-Grow-Building-Scale-Speed-Profitability-in-a-Complex-World-19-2048.jpg)
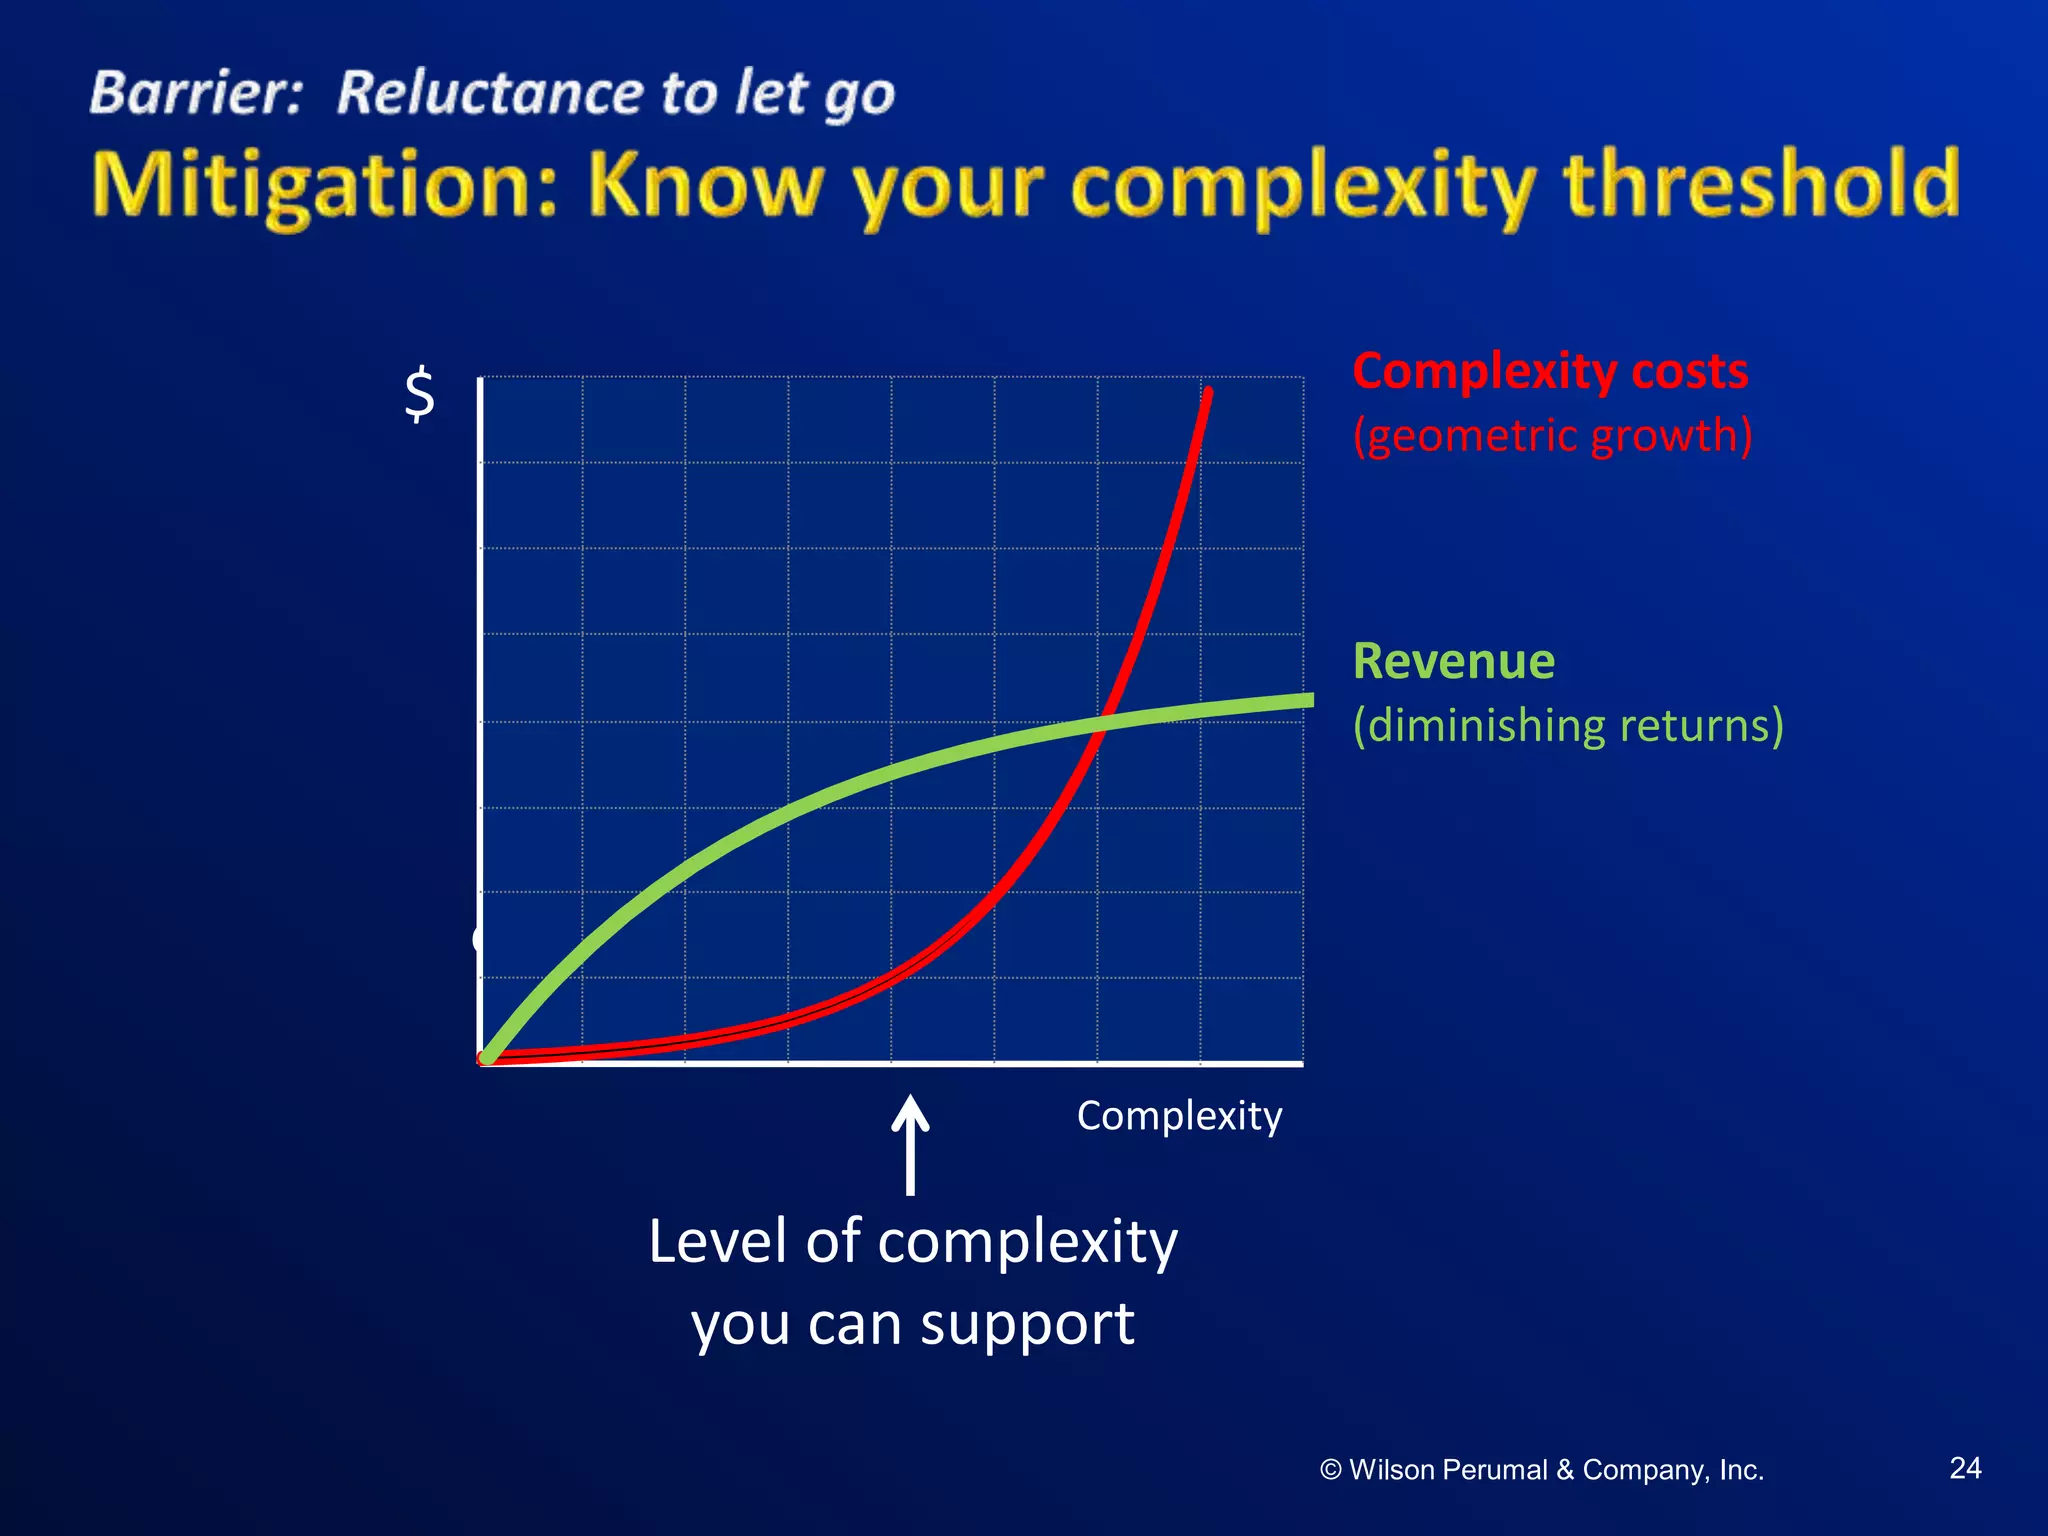
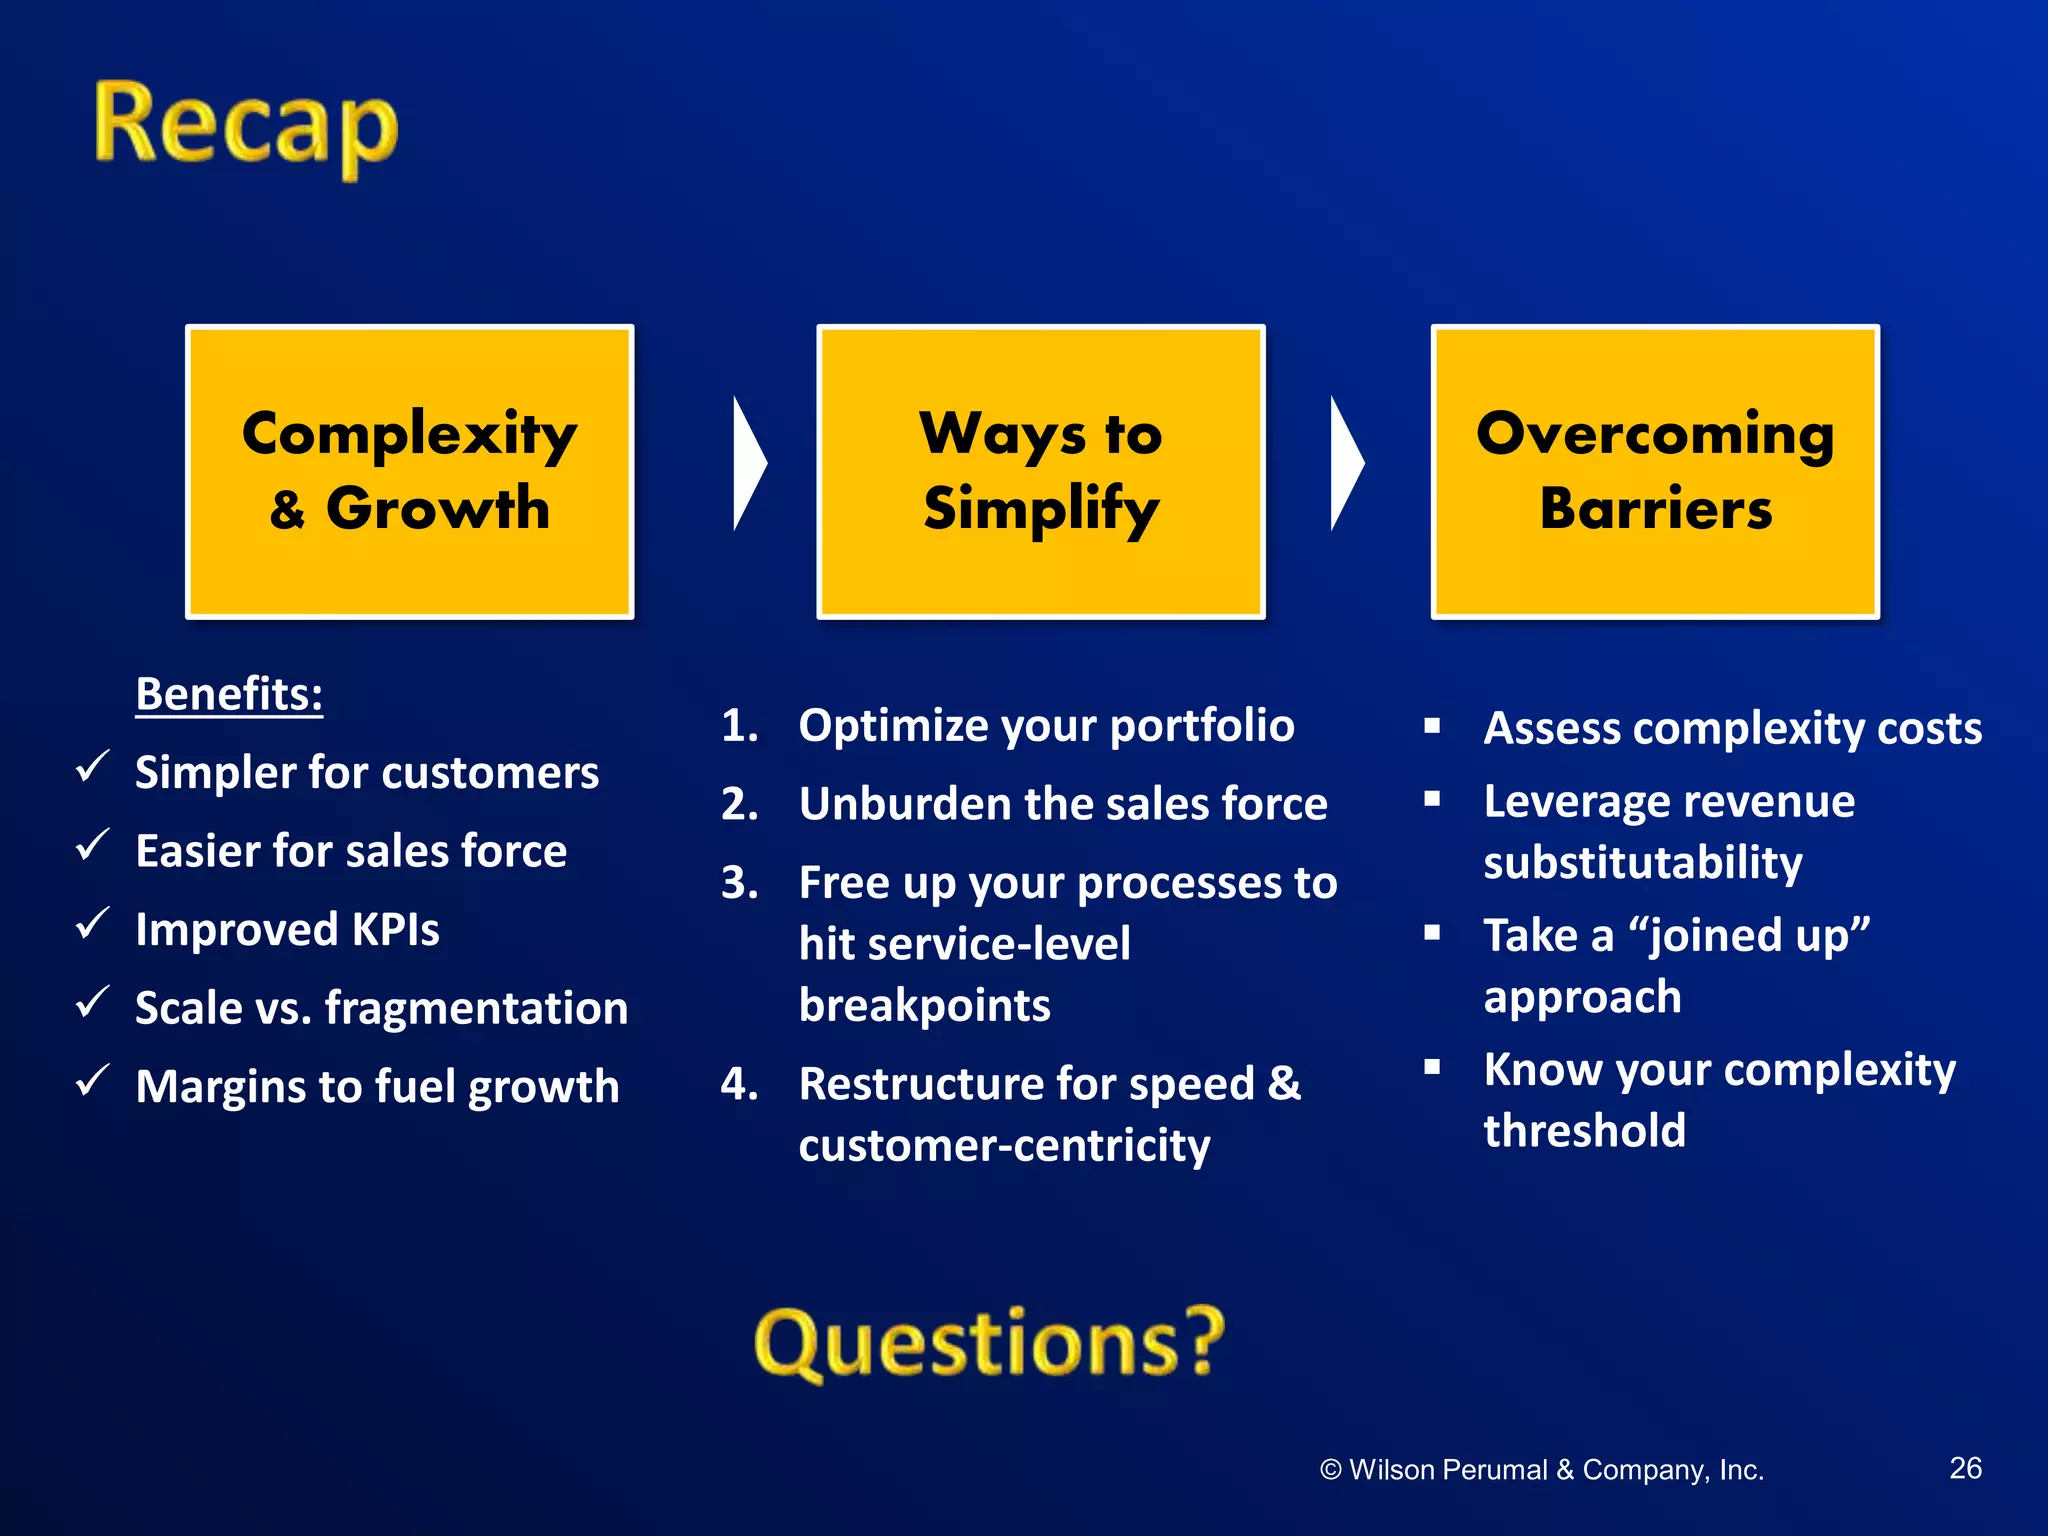


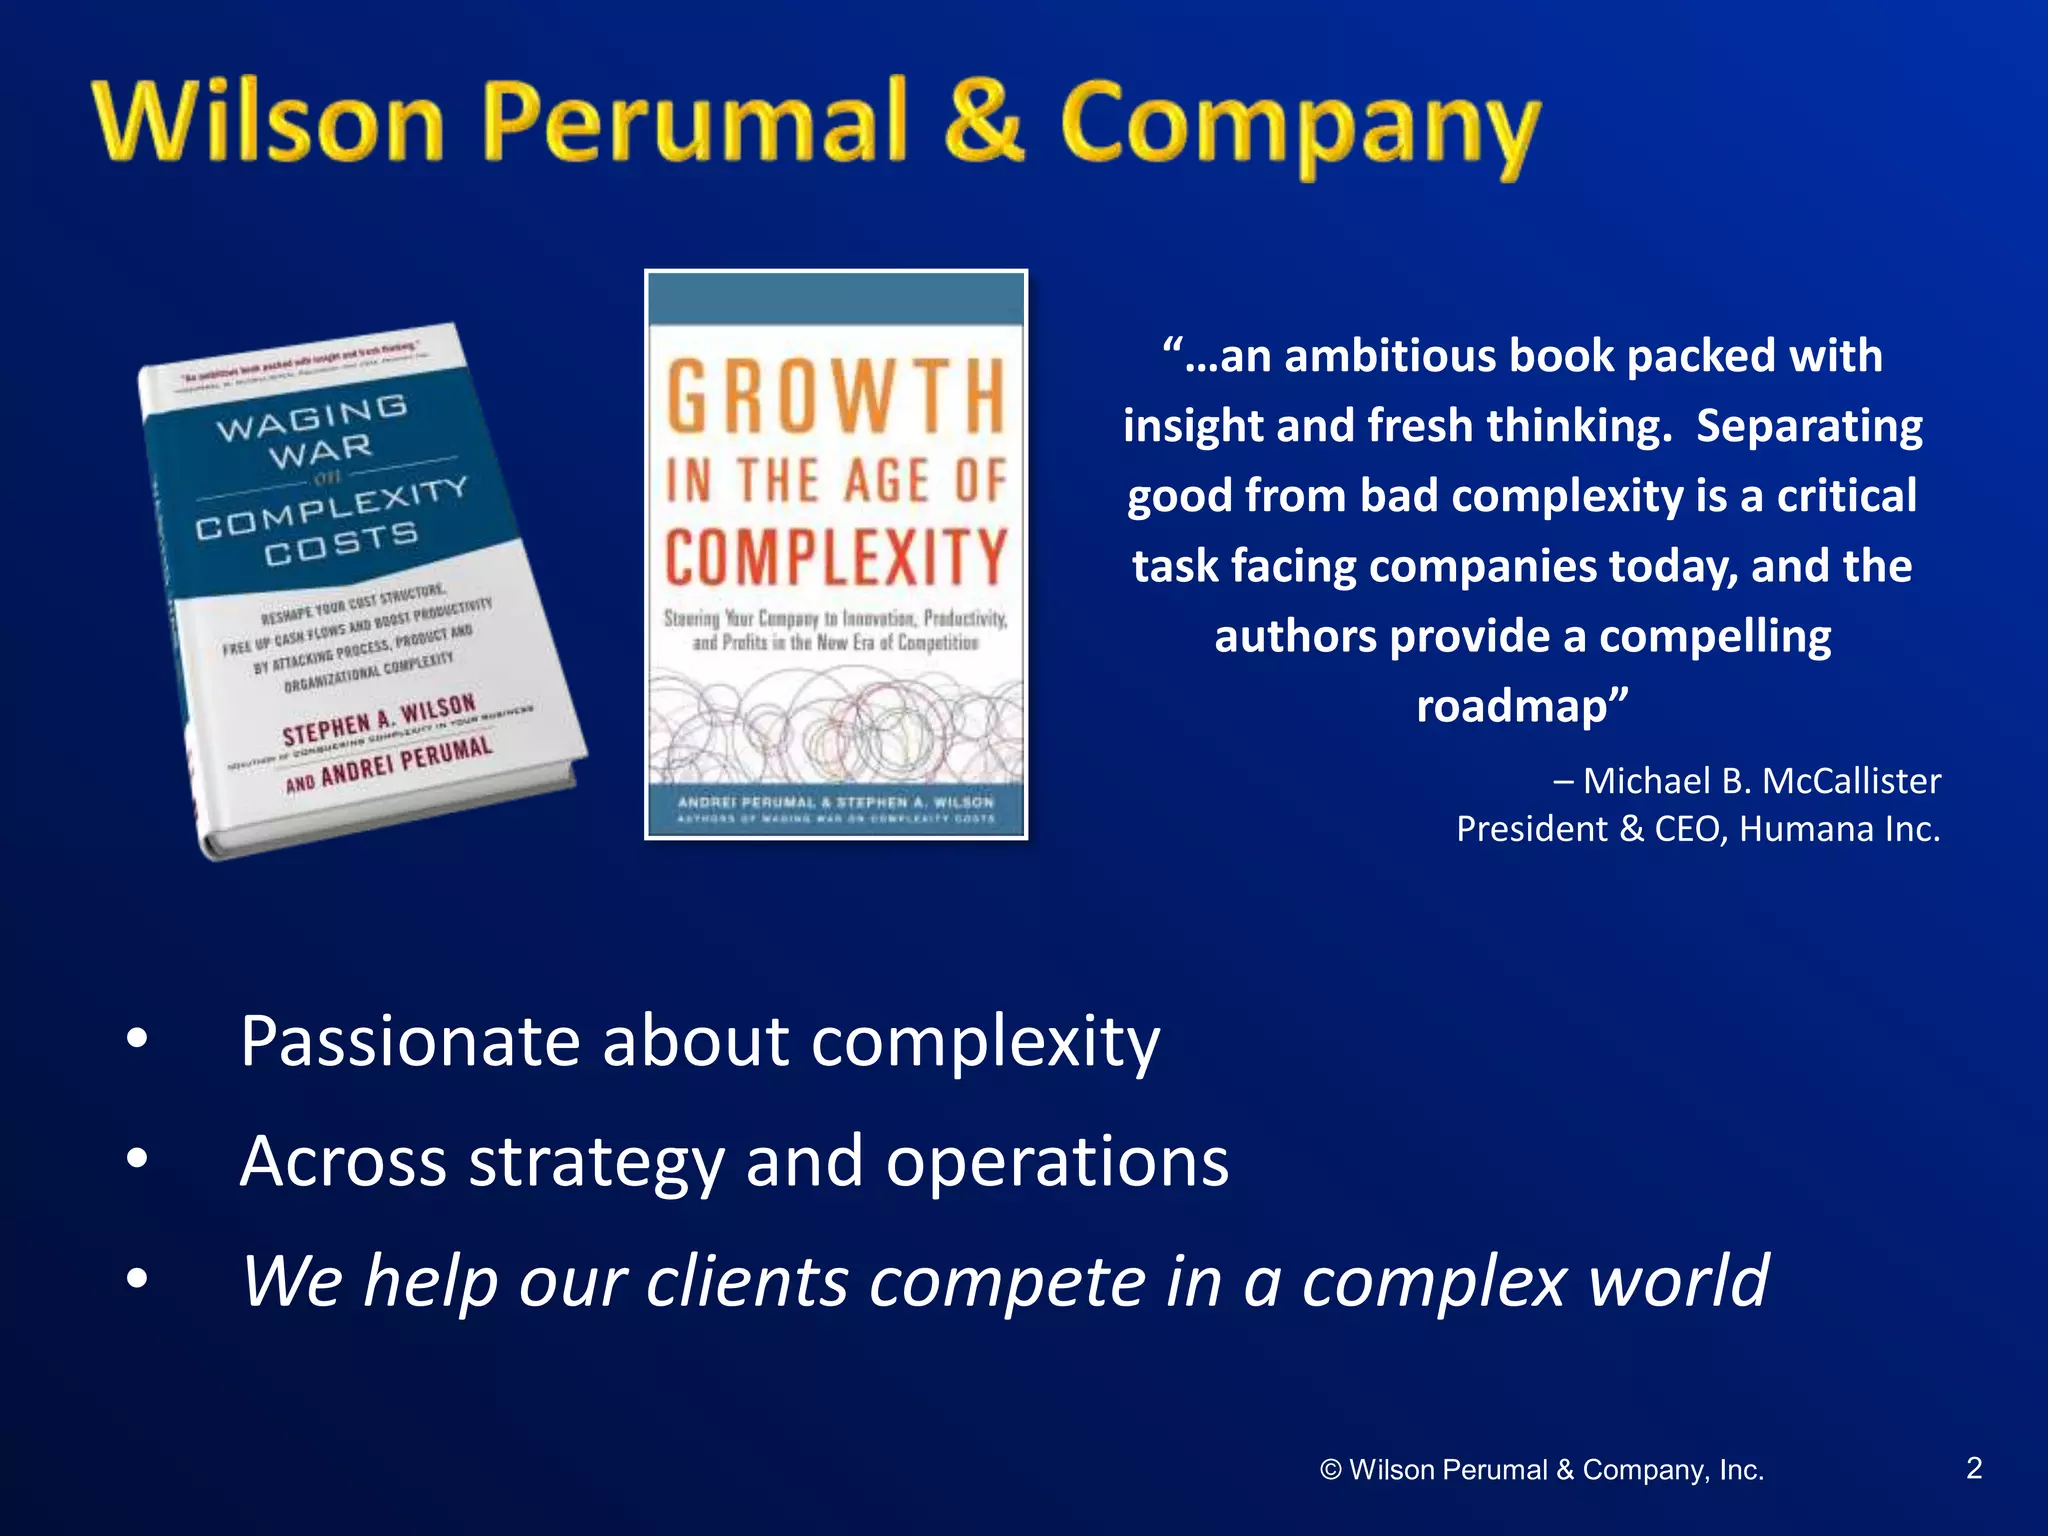
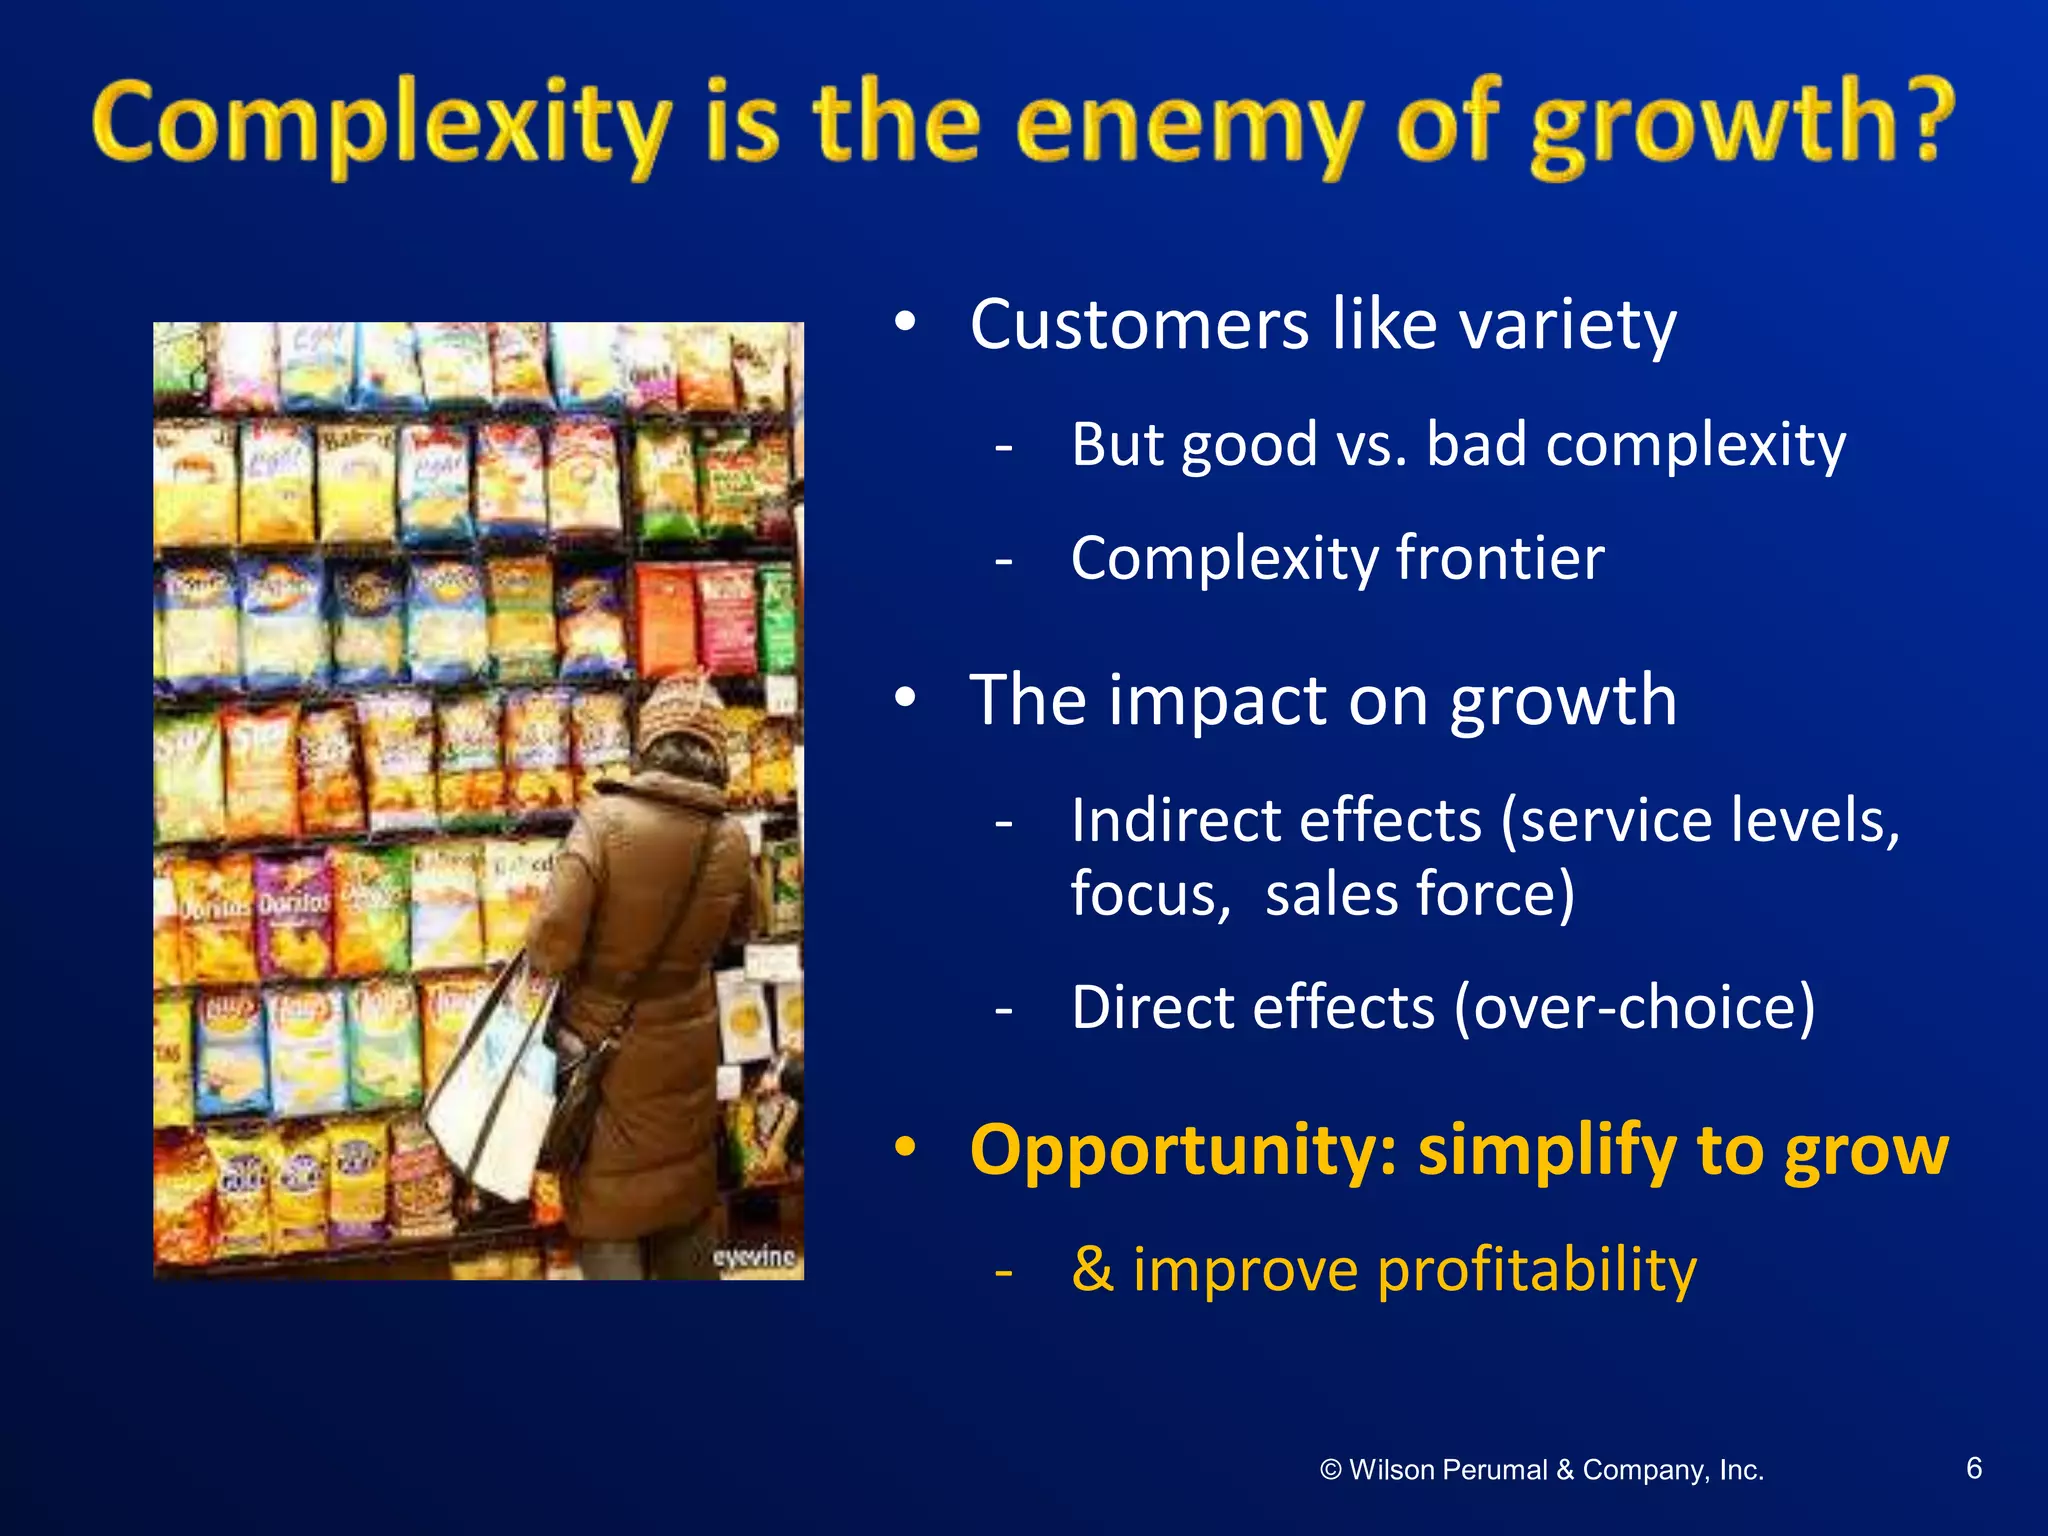
The document discusses strategies for companies to simplify their operations in order to grow and improve profitability amidst increasing complexity. It emphasizes the importance of separating good complexity from bad and optimizing various aspects of the business, such as product portfolios and sales processes. Overall, the aim is to streamline operations to enhance customer satisfaction and operational efficiency.


