
Download to read offline


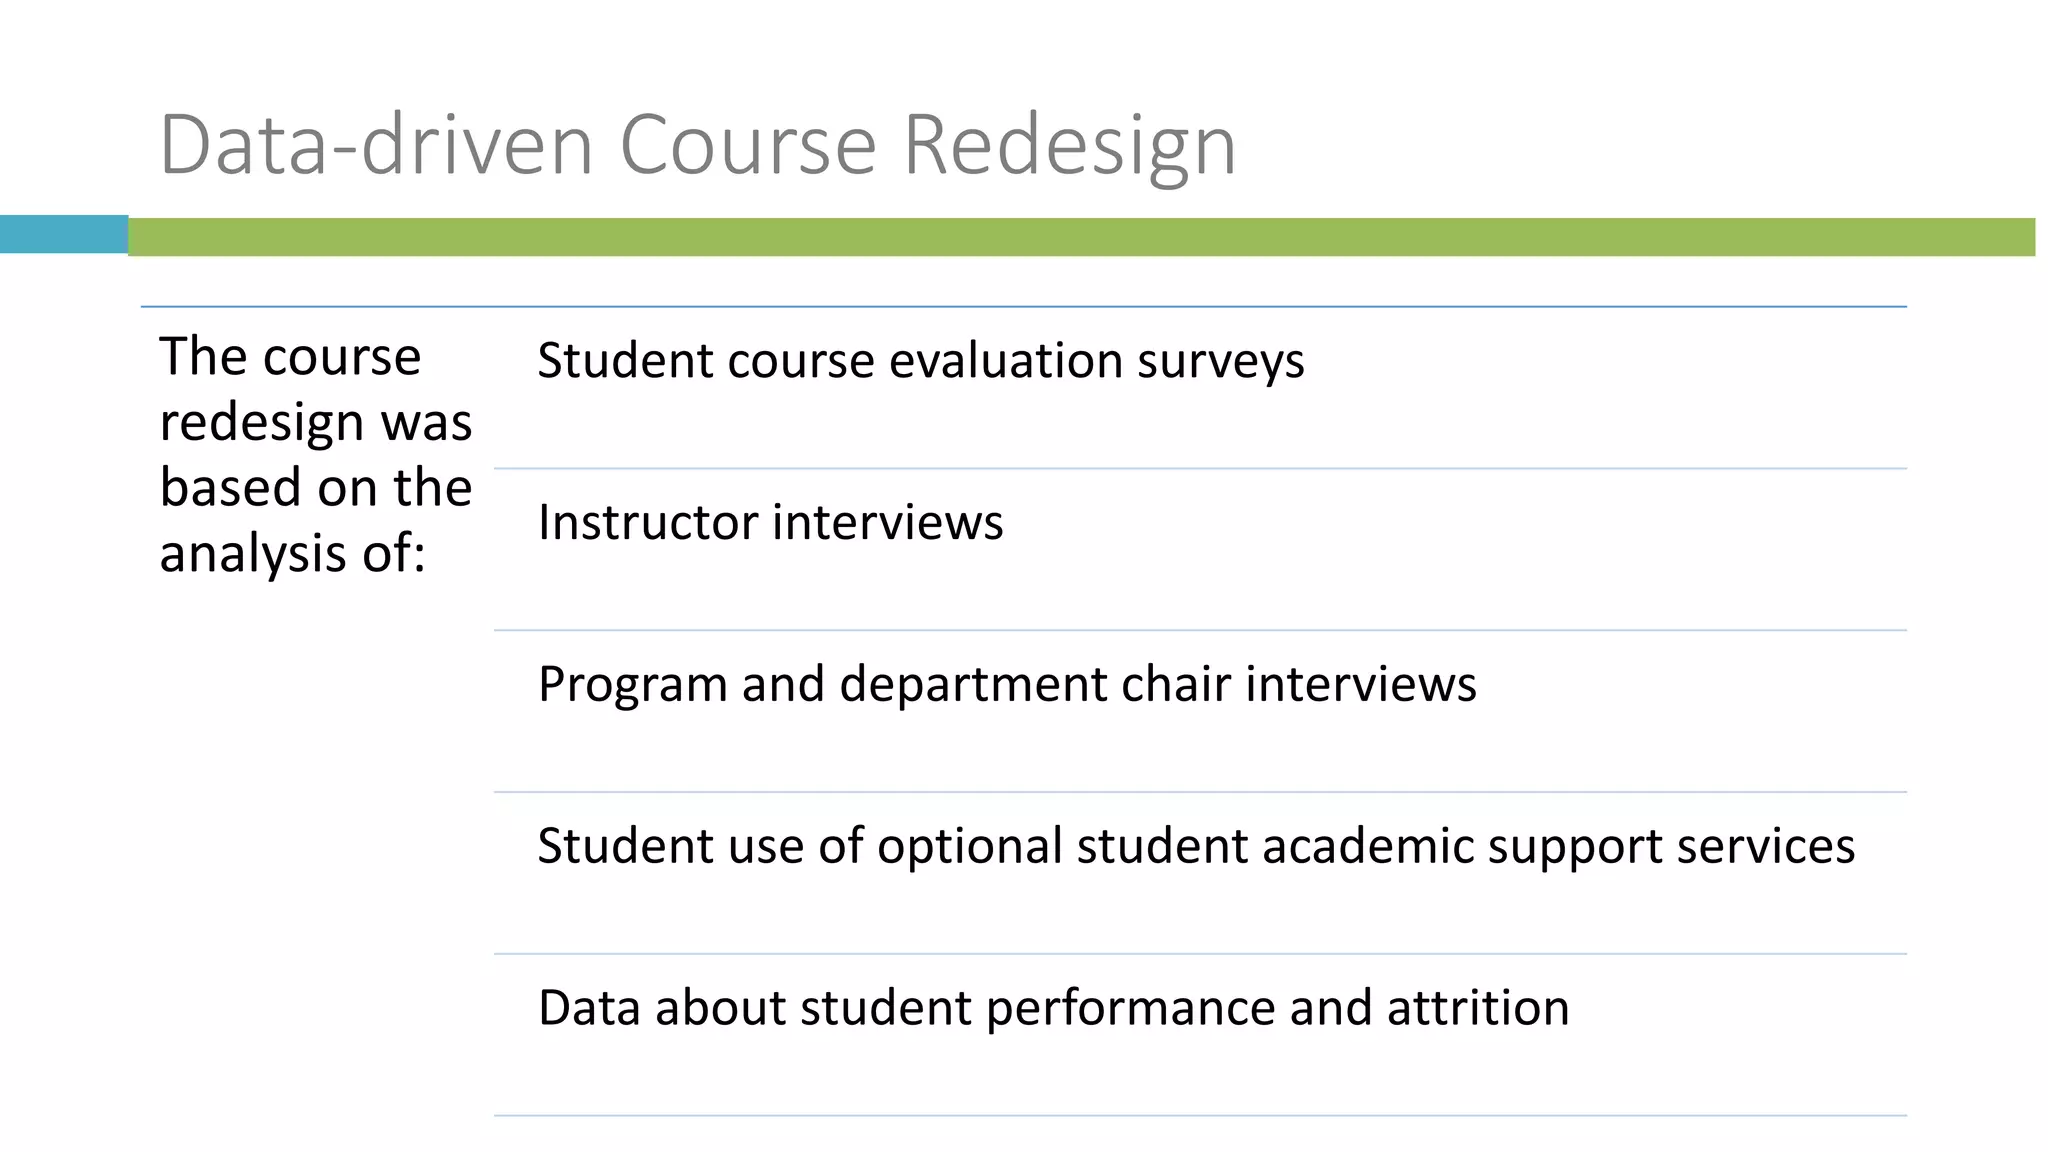


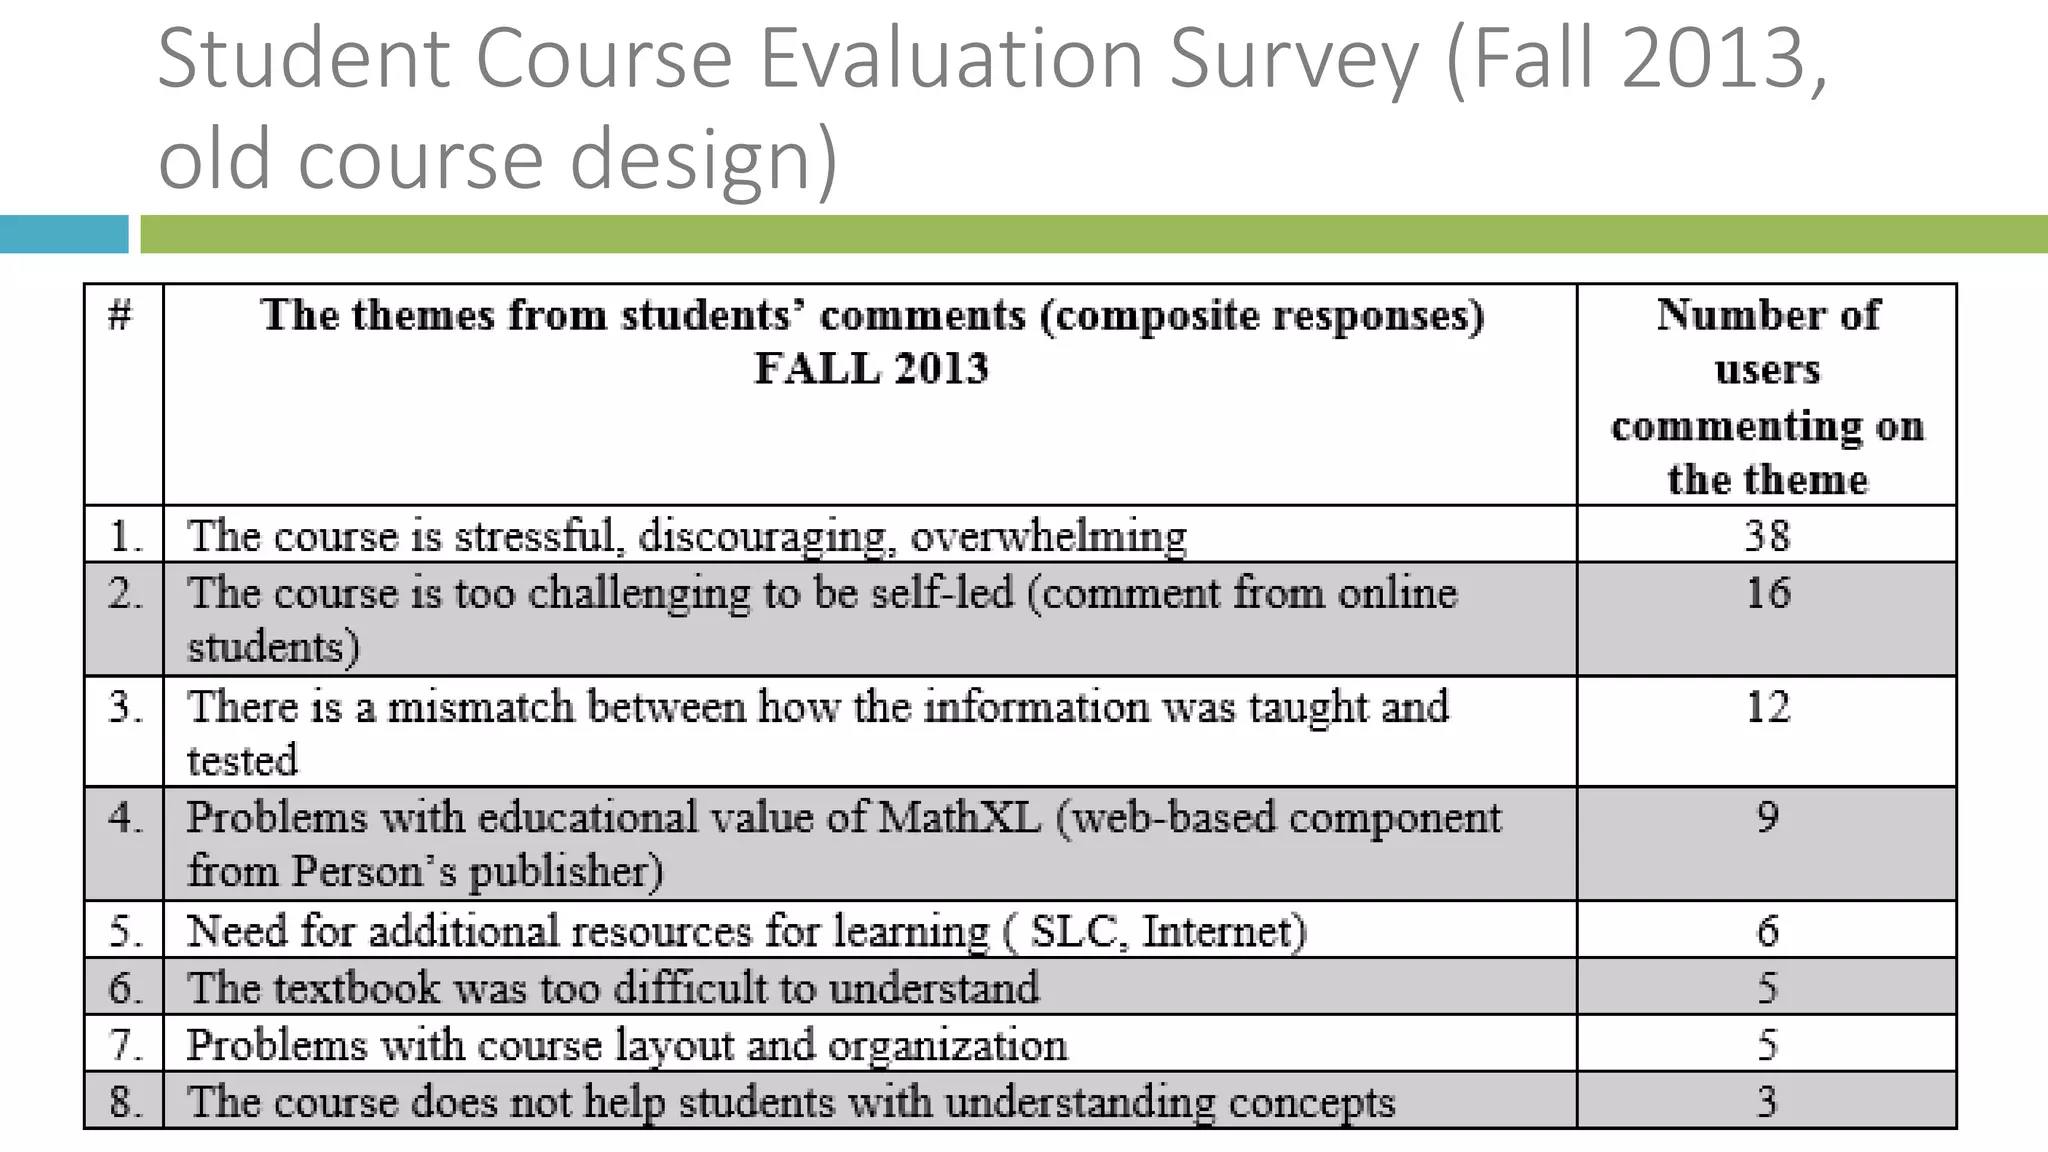


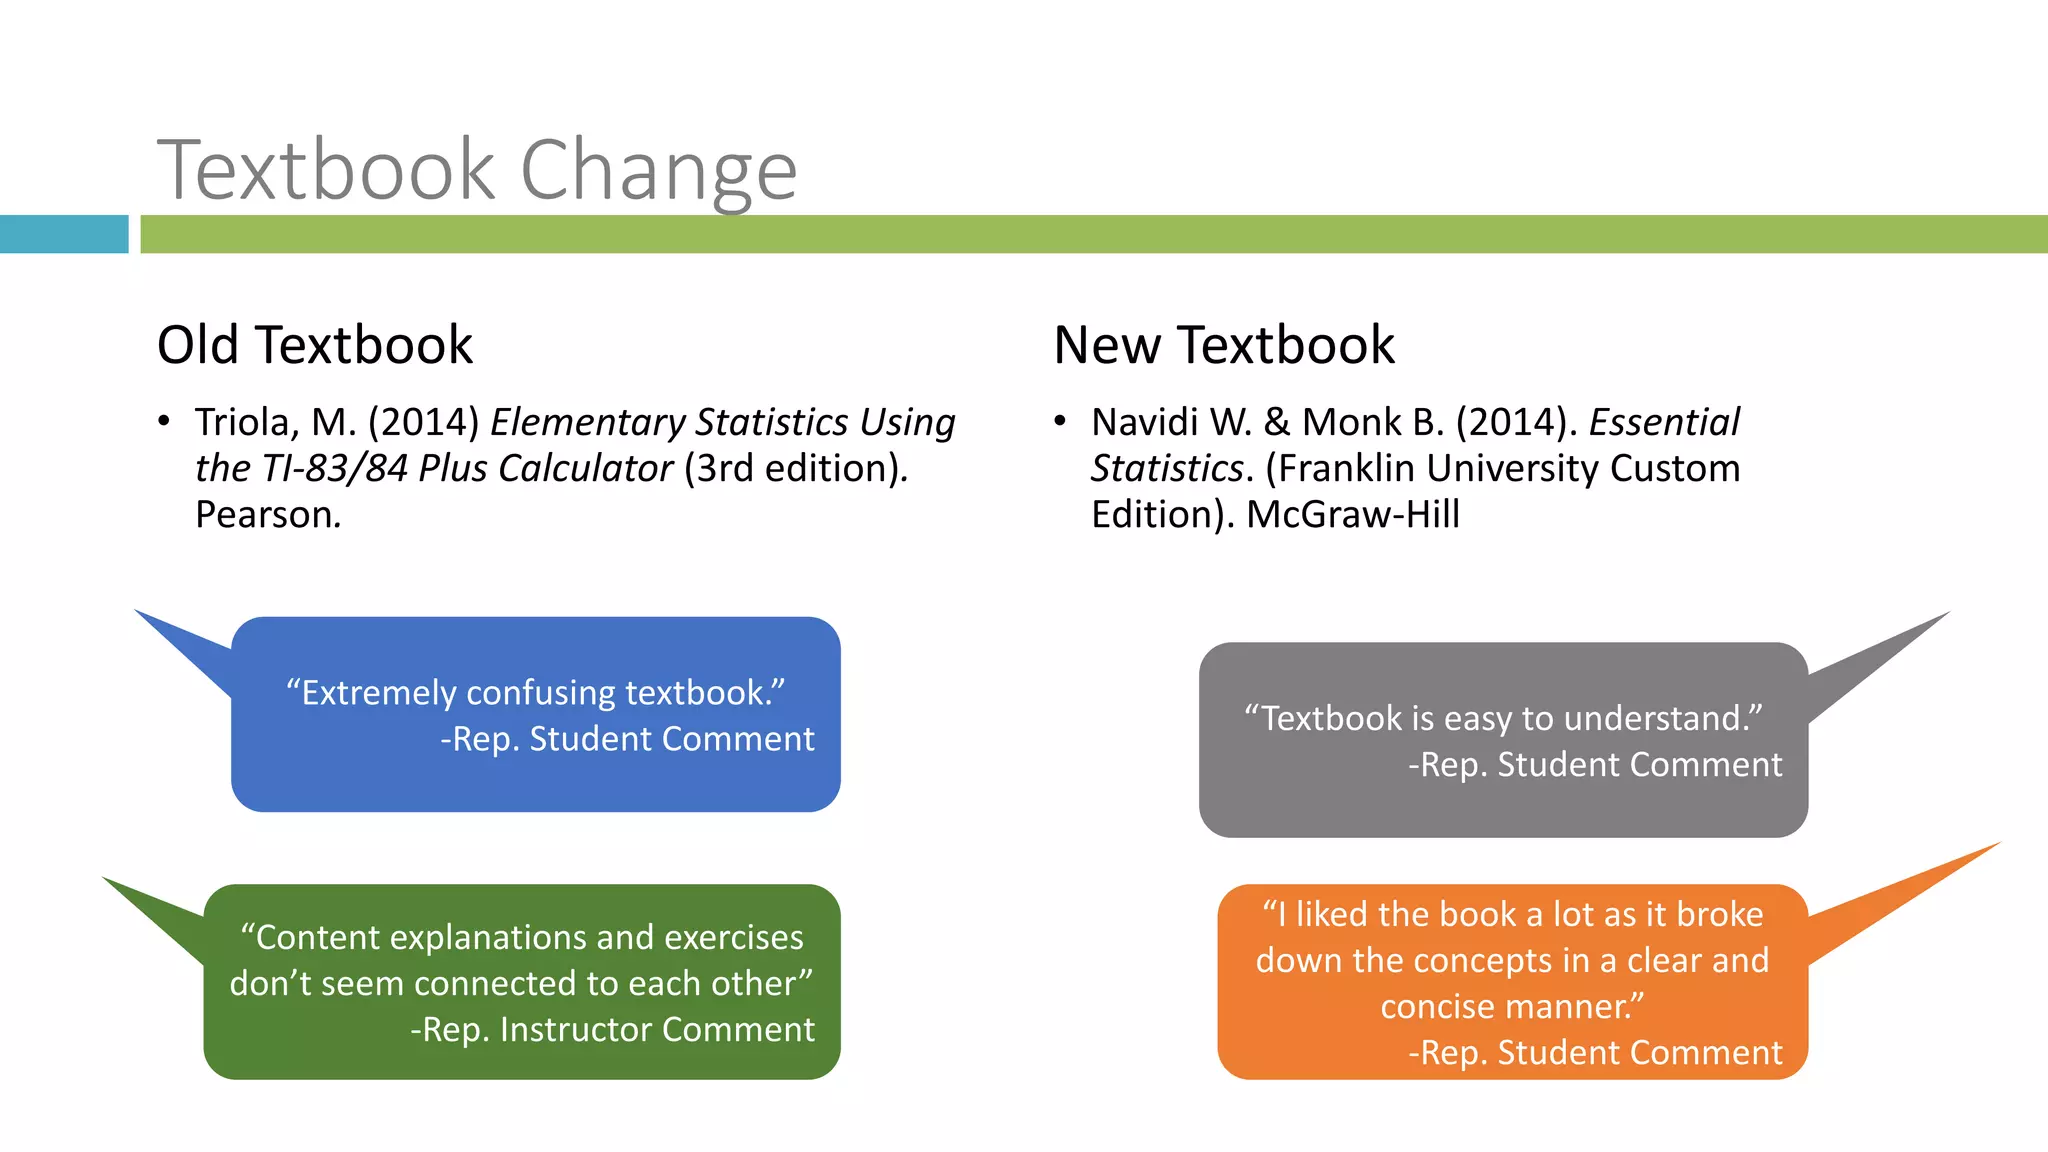


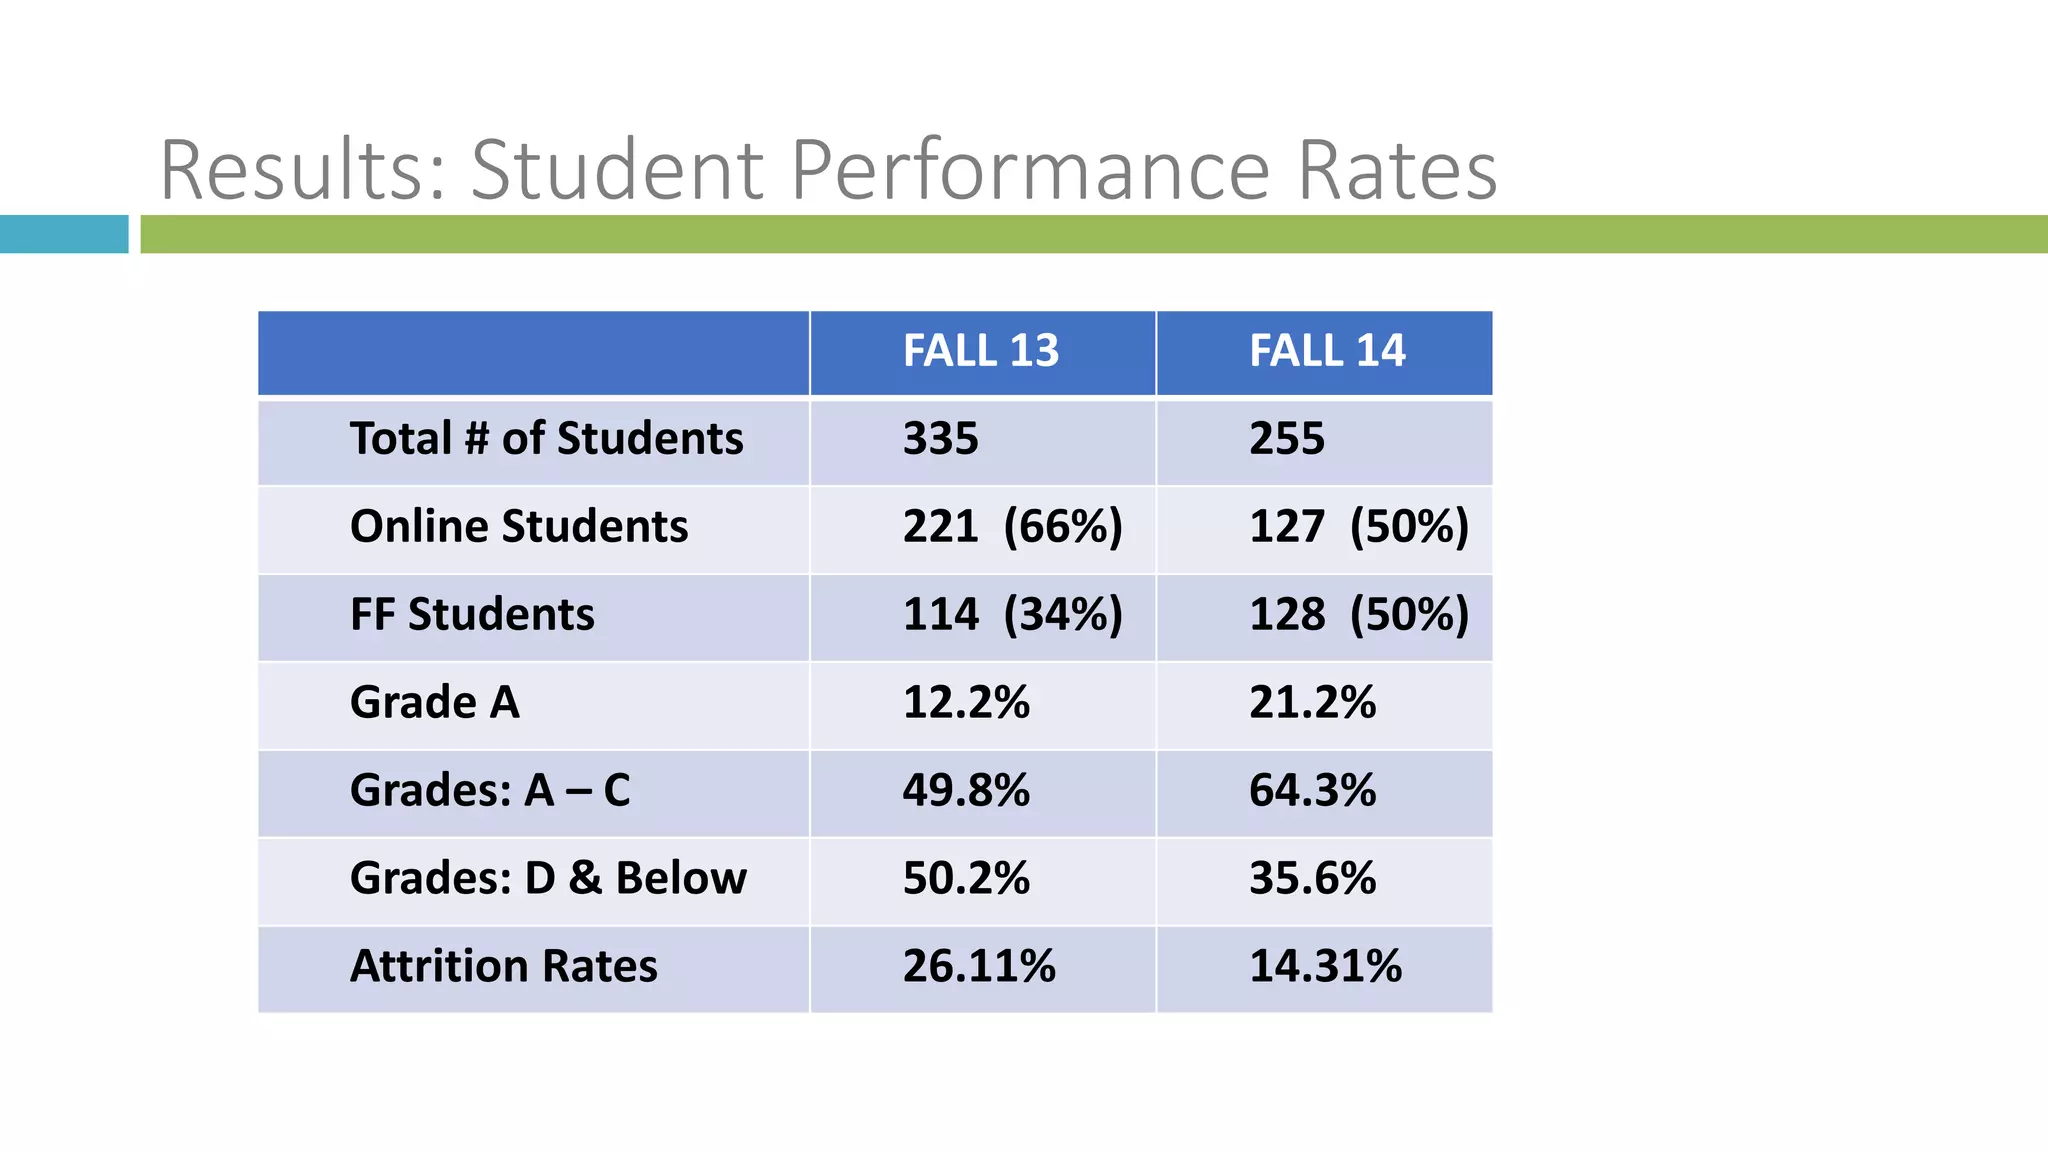


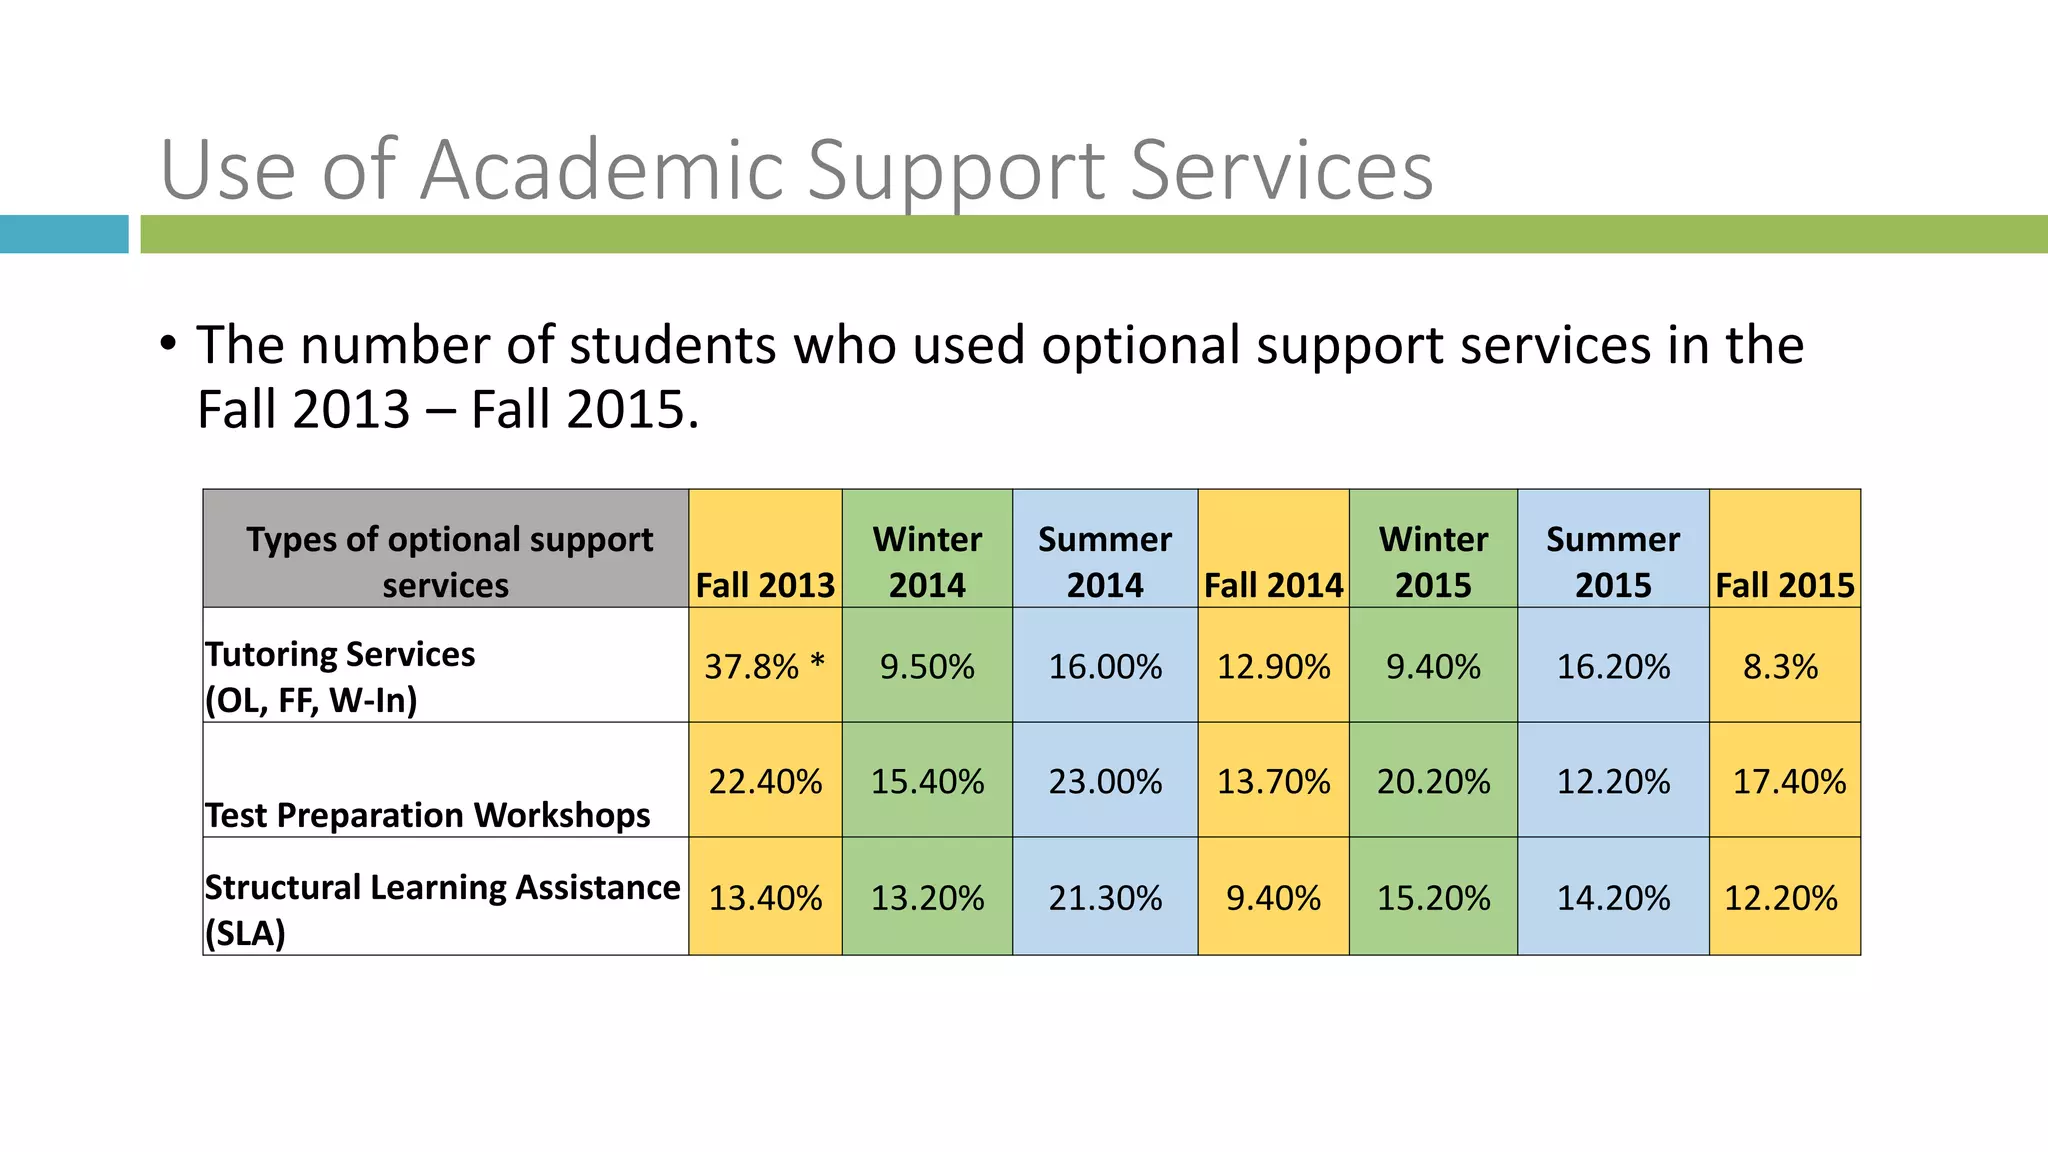


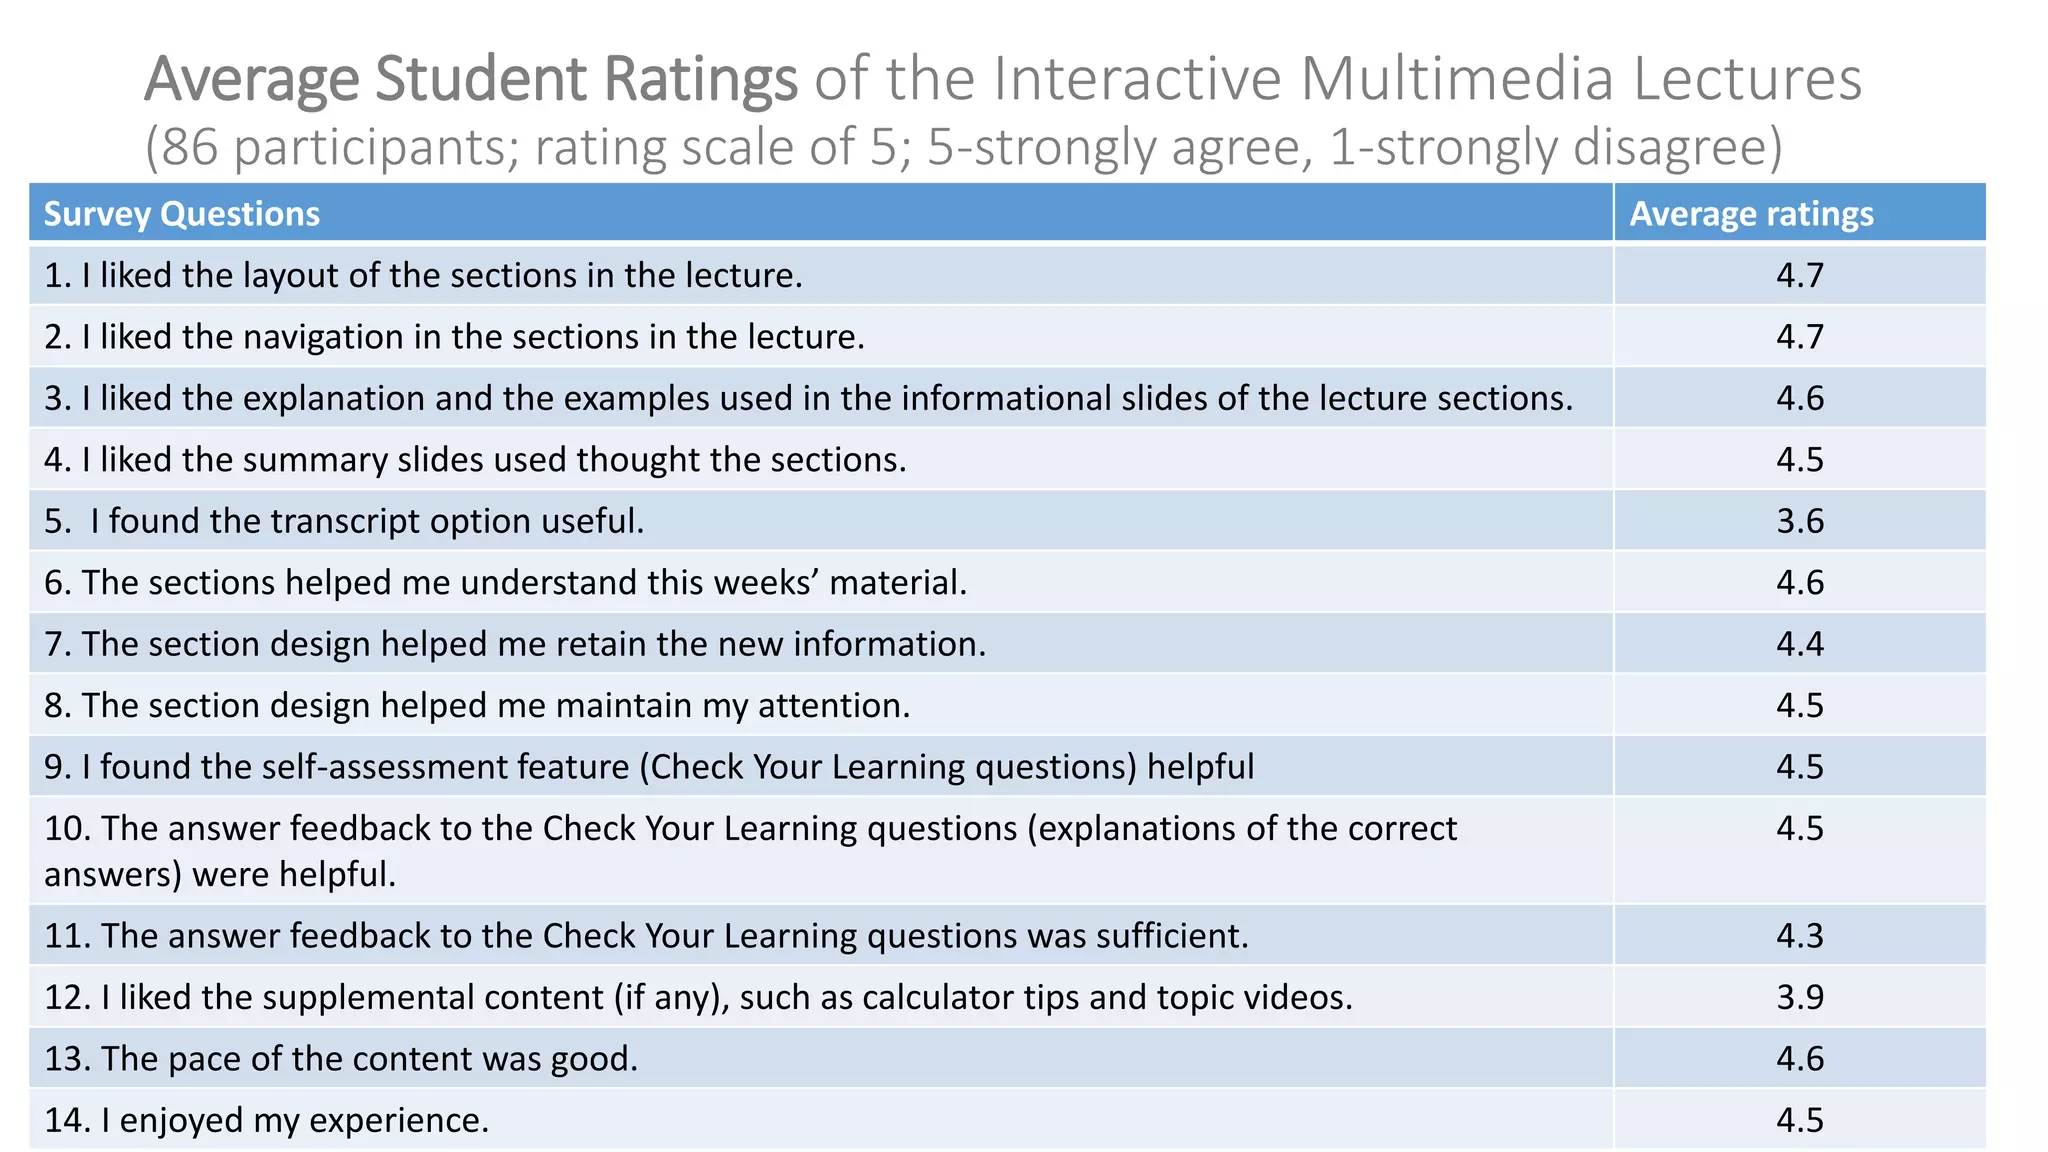
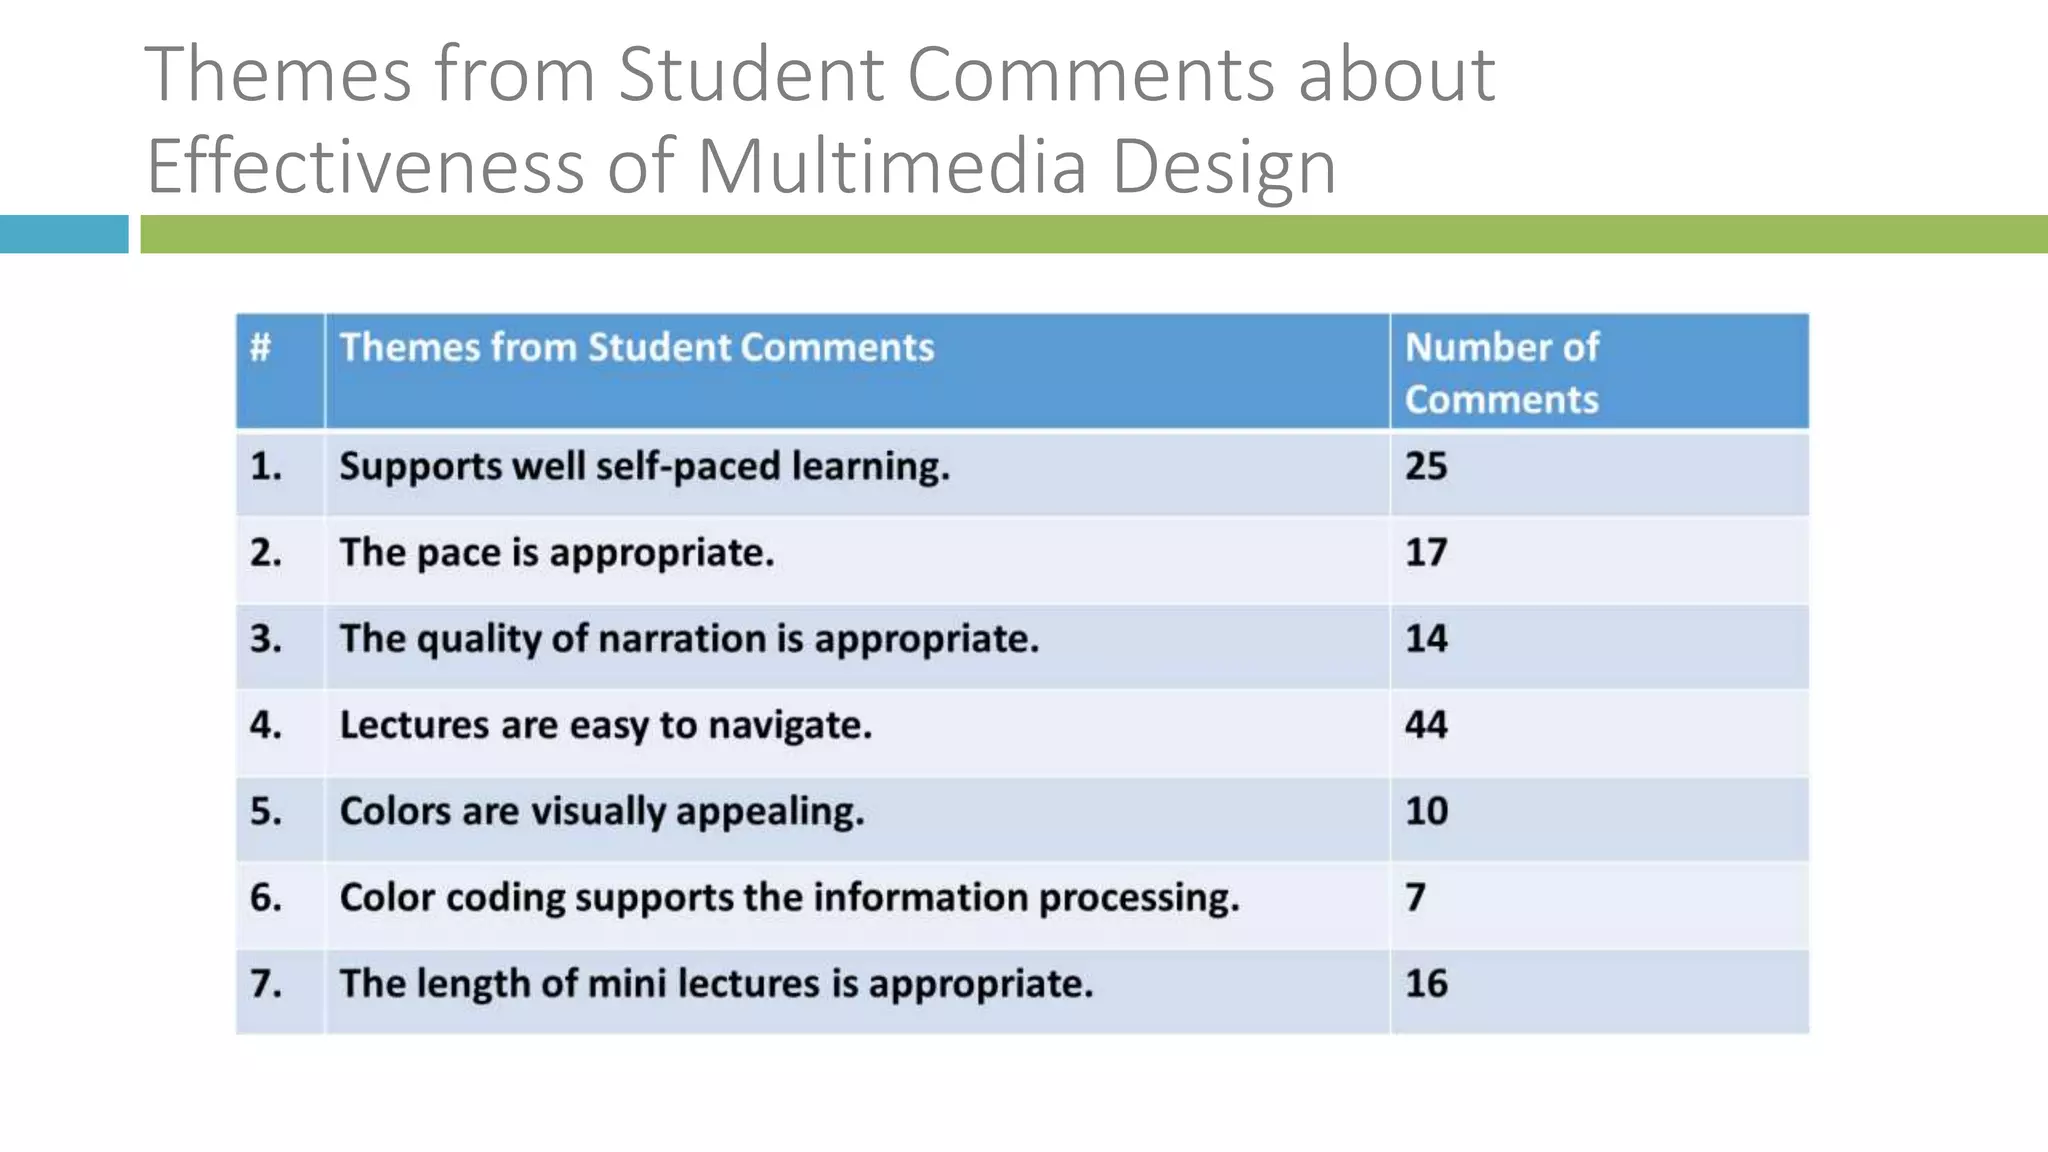
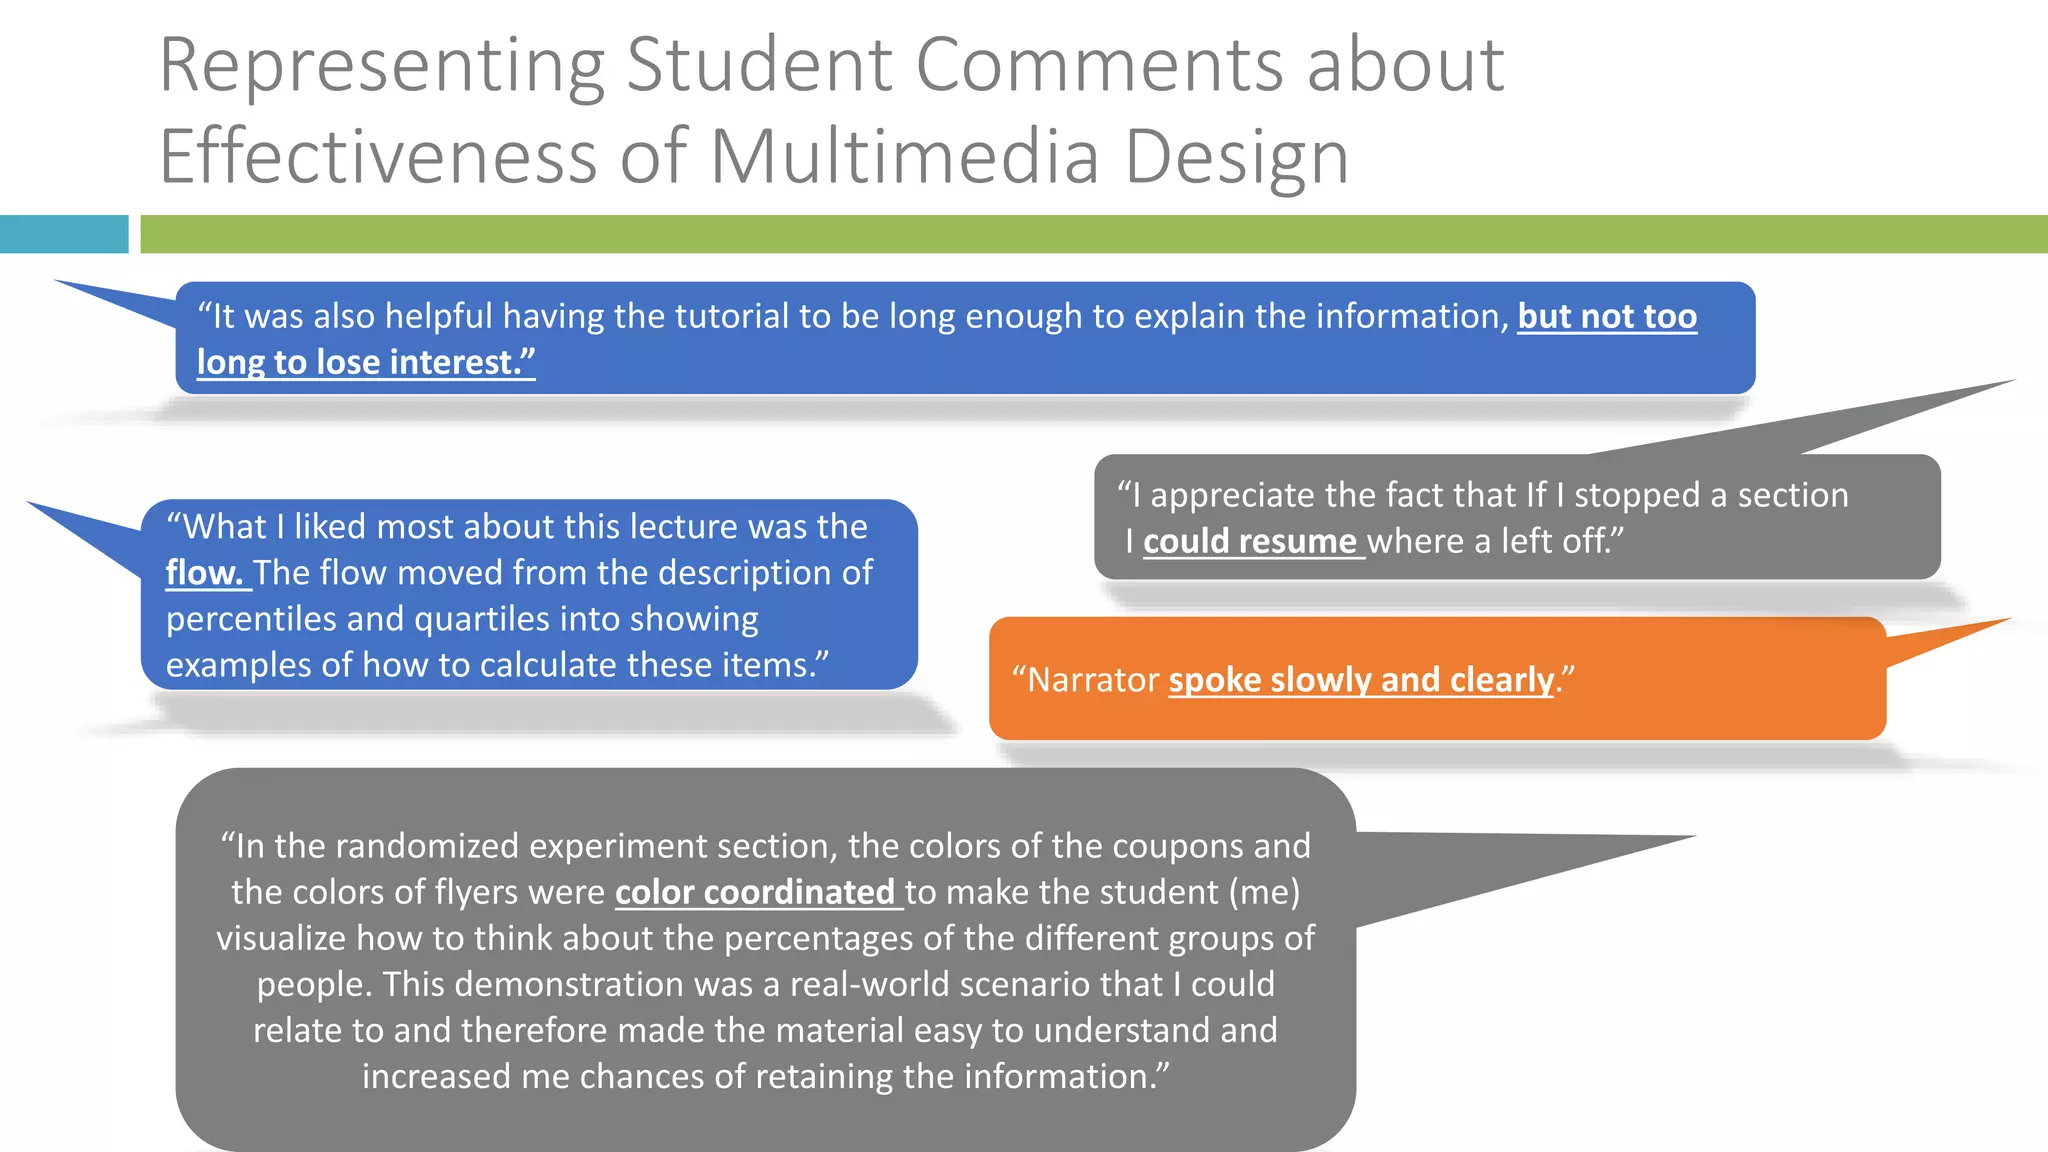


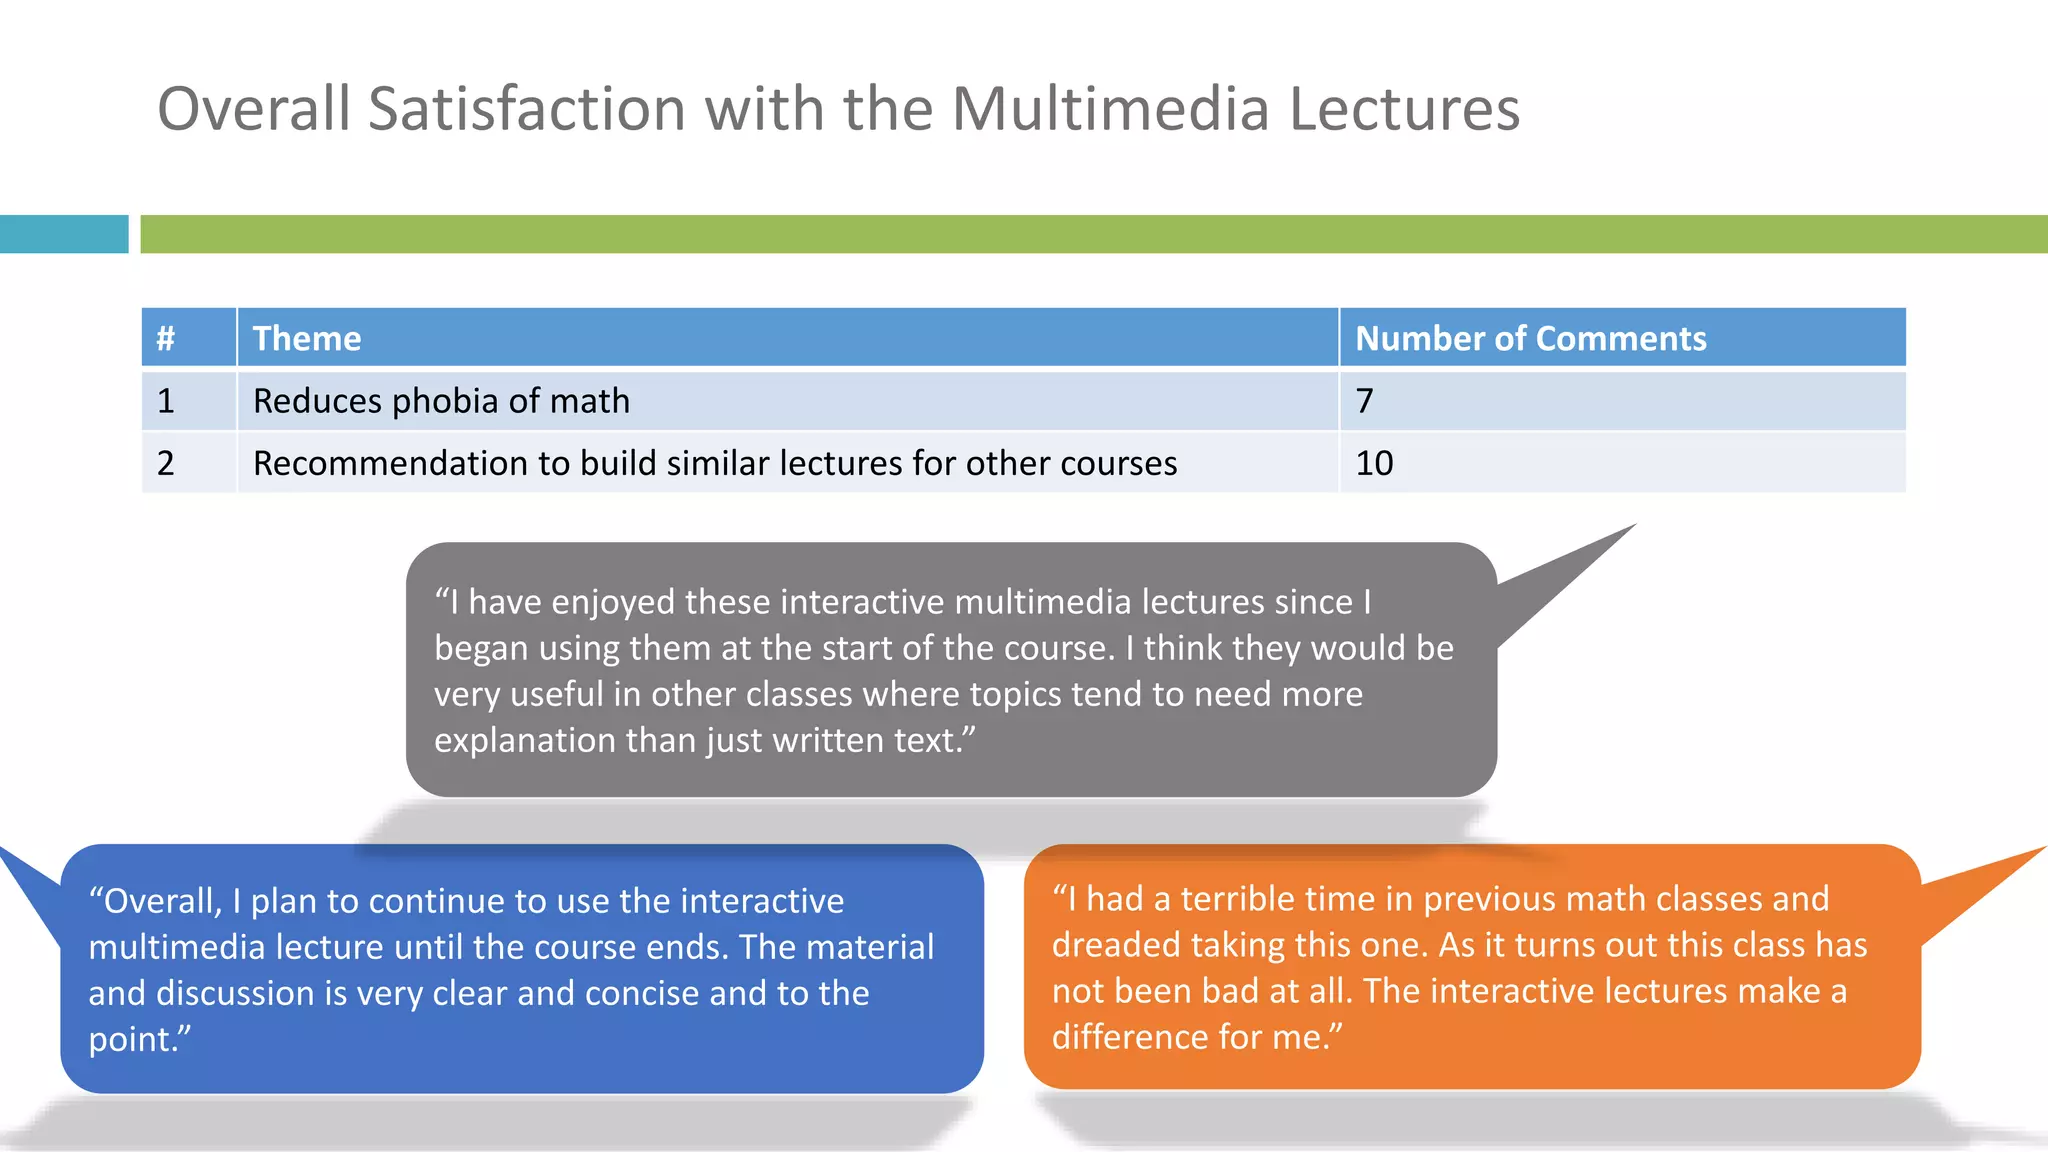


The document discusses a successful redesign of an online statistical concepts course aimed at improving student retention, performance, and satisfaction. The redesign involved data-driven changes including a new textbook and systematic instruction through interactive multimedia lectures, which resulted in a significant reduction in student attrition rates and improved course performance metrics. Student feedback highlighted the effectiveness of the new course format and multimedia components, indicating a positive shift in learning outcomes.


