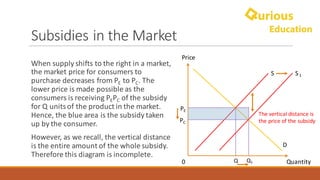
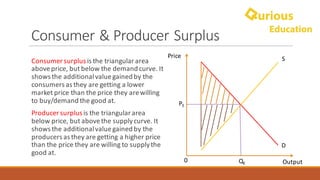
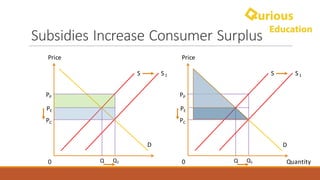
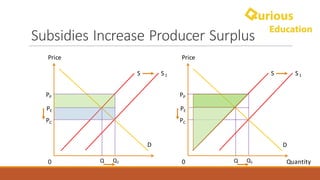
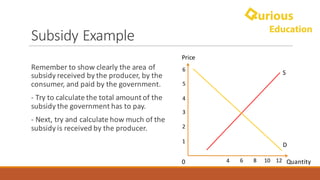
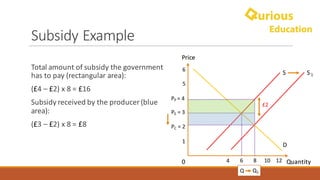
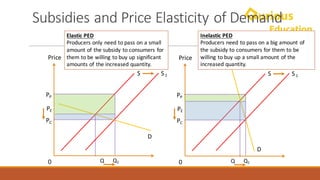
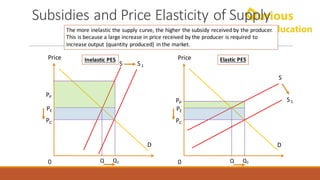
Subsidies
GCE	A-LEVEL	&	IB	ECONOMICS
Visit	us	at	WeAreQurious.com for	Economics	notes,	past	papers,	tutoring	and	more!
©	2020	Qurious Education	Ltd.	All	Rights	Reserved.
Lesson	Structure
◦Subsidies
◦ Definition
◦ Diagram
◦ Effects	on	Stakeholders
◦ Evaluation
What	are	Subsidies?
Subsidies	are	funds	provided	by	the	government	
to	produce	or	consume	a	good	or	service.
How	would	you	think	subsidies	will	affect	the	
price/quantity	of	a	good	in	the	market?
Examples	of	Subsidies
Would	anyone	like	to	give	me	an	example	of	a	good	or	service	subsidized	by	the	
government?
Examples	of	Subsidies
Would	anyone	like	to	give	me	an	example	of	a	good	or	service	subsidized	by	the	
government?
Post	Brexit Farming	Subsidies Renewable	Energy	Subsidies
Effects	of	Subsidies
Subsidies	reduce	the	cost	to	produce	for	suppliers.	This	will	cause	producers	to	
increase	their	output	as	they	can	earn	higher	profits	per	unit.	Hence,	the	supply	
curve	will	shift	to	the	right.
Note	that	subsidies	have	the	the	opposite	effect	of	taxes	on	goods	and	services.	
To	understand	how	a	subsidy	affects	the	market,	we	can	try	to	plot	the	supply	
curve	after	a	subsidy	is	incurred.
The	Supply	Curve
Price
Quantity
Supplied
£2 4
£3 6
£4 8
£5 10
£6 12
Quantity0
Price
S
2
4
4 8
1
3
5
12
6
6 10
Plot	the	Supply	Curve	with	Subsidy
Quantity0
Price
Price
Quantity
Supplied
Price	after	
£1	Subsidy
£2 4 £1
£3 6 £2
£4 8
£5 10
£6 12
2
4
4 8
1
3
5
12
6
6 10
Supply	Curve	with	Subsidy
Quantity0
Price
SPrice
Quantity
Supplied
Price	after	
£1	Subsidy
£2 4 £1
£3 6 £2
£4 8 £3
£5 10 £4
£6 12 £5
2
4
4 8
1
3
S1
5
12
6
6 10
£1
The	vertical	distance
Is	the	price	of	the	subsidy:
Subsidies	in	the	Market
Quantity0
Price
What	will	happen	to	the market	price	and	
quantity	given	an	increase	in	supply?
Illustrate	it	using	a	demand	and	supply	
diagram	in	the	graph	on	the	right.
Subsidies	in	the	Market
Quantity0
Price
S
PE
PC
S1
Q1
D
Q
When	supply	shifts	to	the	right	in	a	market,	
the	market	price	for	consumers	to	
purchase	decreases	from	PE to	PC.	The	
lower	price	is	made	possible	as	the	
consumers	is	receiving	PEPC of	the	subsidy	
for	Q	units	of	the	product	in	the	market.	
Hence,	the	blue	area	is	the	subsidy	taken	
up	by	the	consumer.
However,	as	we	recall,	the	vertical	distance	
is	the	entire	amount	of	the	whole	subsidy.	
Therefore	this	diagram	is	incomplete.
The	vertical	distance	is	
the	price	of	the	subsidy
Subsidies	in	the	Market
Quantity0
Price
S
PE
PC
S1
Q1
D
Q
Extending	the	vertical	from	the	new	
market	equilibrium,	this	will	give	us	the	
entire	subsidy	and	help	us	find	the	subsidy	
received	by	producers.
As	the	government	is	paying	a	subsidy	of	
PPPC for	each	unit,	PP is	the	price	the	
producer	receives	for	each	unit	sold,	rather	
than	the	original	price	PE.	Hence,	the	green	
area	is	the	subsidy	received	by	the	
producer	for	Q	units	sold.
PP
The	vertical	distance	is	
the	price	of	the	subsidy
Subsidies	in	the	Market
Quantity0
Price
S
PE
PC
S1
Q1
D
Q
To	conclude,	the	government	is	paying	a	
subsidy	of	the	rectangular	green	and	blue	
area.	The	green	area	is	the	subsidy	
received	by	the	producer,	and	the	blue	
area	is	the	subsidy	received	by	the	
consumer.
Hence,	we	can	see	the	subsidy	is	shared	
between	the	producers	and	consumers.	
The	overall	effect	on	the	market	is	a	fall	in	
price	and	increase	in	quantity.
PP
The	vertical	distance	is	
the	price	of	the	subsidy
Consumer	&	Producer	Surplus
Consumer	surplus	is	the	triangular	area	
above	price,	but	below	the	demand	curve.	It	
shows	the	additional	value	gained	by	the	
consumers	as	they	are	getting	a	lower	
market	price	than	the	price	they	are	willing	
to	buy/demand	the	good	at.
Producer	surplus	is	the	triangular	area	
below	price,	but	above	the	supply	curve.	It	
shows	the	additional	value	gained	by	the	
producers	as	they	are	getting	a	higher	price	
than	the	price	they	are	willing	to	supply	the	
good	at.
D
Price
Output0
S
PE
QE
Subsidies	Increase	Consumer	Surplus
Quantity0
Price
S
PE
PC
S1
Q1
D
Q
PP
0
Price
S
PE
PC
Q1
D
Q
PP
S1
Subsidies	Increase	Producer	Surplus
Quantity0
Price
S
PE
PC
S1
Q1
D
Q
PP
0
Price
S
PE
PC
Q1
D
Q
PP
S1
Subsidy	Example
One	day,	the	Pirates	of	the	Caribbean	
Government	found	out	the	miraculous	
healing	powers	of	coconut	water.	
They	decided	to	subsidize	it	for	£2	per	
liter	such	that	it	can	be	consumed	at	£2
instead	of	the	current	£3.	As	a	result,	
market	quantity	increased	from	6	to	8.
Work	with	your	neighbors	to	draw	a	D&S	
diagram	involving	the	subsidy.
Subsidy	Example
Quantity0
Price
2
4
4 8
1
3
5
12
6
6 10
Remember	to	show	clearly	the	area	of	
subsidy	received	by	the	producer,	by	the	
consumer,	and	paid	by	the	government.
- Try	to	calculate	the	total	amount	of	the	
subsidy	the	government	has	to	pay.	
- Next,	try	and	calculate	how	much	of	the	
subsidy	is	received	by	the	producer.
S
D
Subsidy	Example
Quantity0
Price
PC =	2
PP	=	4
4 8
1
PE =	3	
5
12
6
6 10
Total	amount	of	subsidy	the	government	
has	to	pay	(rectangular	area):
(£4	– £2)	x	8	=	£16
Subsidy	received	by	the	producer	(blue	
area):
(£3	– £2)	x	8	=	£8
Quantity0
Price
S S1
D
Q
£2
Q1
Subsidies	and	Price	Elasticity	of	Demand
Similar	to	taxes,	the	amount	of	subsidy	received	by	the	consumer	vs	the	producer	depends	on	
the	price	elasticity	of demand	and	supply.	
For	price	elasticity	of	demand,	the	amount	of	subsidy	passed	on	to	the	consumers	depends	on	
how	much	the	consumer	is	willing	to	buy	up	the	increase	in	quantity	produced,	given	a	fall	in	
price.	This	determines	the	amount	of	subsidy	the	firm	passes	on	to	the	consumer.
For	example,	renewable	energy	producers	need	to	pass	on	a	large	amount	of	their	subsidy	to	
increase	energy	consumption	of	consumers,	as	the	amount	of	energy	we	consume	tend	not	to	
change	despite	of	a	price	decrease	(PED	inelastic);	whereas	handbag	producers	will	only	need	to	
pass	on	a	small	amount	of	subsidy	for	us	to	buy	significantly	more	handbags	due	to	a	small	
discount.
Subsidies	and	Price	Elasticity	of	Demand
0
Price
S
PE
PC
Q1Q
PP
D
S1
0
Price
S
PE
PC
Q1Q
PP
D
S1
Inelastic	PED
Producers	need	to	pass	on	a	big	amount	of	
the	subsidy	to	consumers	for	them	to	be	
willing	to	buy	up	a	small	amount	of	the	
increased	quantity.
Elastic	PED
Producers	only	need	to	pass	on	a	small	
amount	of	the	subsidy	to	consumers	for	
them	to	be	willing	to	buy	up	significant
amounts	of	the	increased	quantity.
Subsidies	and	Price	Elasticity	of	Supply
What	about	elasticity	of	supply?	How	will	it	
change	the	subsidy	given	to	consumers	and	
producers?	Let’s	draw a	diagram	to	find	out!	
I	will	ask	two	pairs	to	draw	the	diagram	on	the	
whiteboard.	Once	your	name	has	been	called,	
you	can	nominate	a	friend	to	come	out	with	
you	to	help.
Subsidies	and	Price	Elasticity	of	Supply
0
Price
S
PE
PC
Q1Q
PP
D
S1
0
Price
PE
PC
Q1Q
PP
D
S
S1
The	more	inelastic	the	supply	curve,	the	higher	the	subsidy	received	by	the	producer.
This	is	because	a	large	increase	in	price	received	by	the	producer	is	required	to	
increase	output	(quantity	produced)	 in	the	market.
Elastic	PESInelastic	PES
Evaluating	Subsidies
- Subsidies	can	be	effective	in	promoting	consumption	of	a	good	by	reducing	market	price
- A	subsidy	has	limited	effect	on	increasing	market	quantity	when	PED	is	inelastic,	since	a	large	
amount	of	subsidy	can	only	cause	a	small	increase	in	purchasing	necessities
- How	much	the	subsidy	actually	benefits	the	consumer/producer	depends	on	how	much	more	
consumers	will	buy	given	a	discount	(PED),	and	how	difficult	it	is	to	produce	it	(PES)
- Subsidies	are	an	opportunity	cost	to	the	government,	as	they	need	to	pay	for	it,	which	means	
less	can	be	spent	on	other	goods	and	services	like	healthcare	and	education
- There	can	be	government	failure	i.e.	there	is	not	enough	information	to	ensure	the	right	
amount	of	subsidy	is	set	in	the	market
Visit	Us
To	view/download	more	Economics	resources,	visit	us	with	these	
clickable	buttons:
A-Level/IB	Economics	
Notes	&	Questions	
by	Topic
A-Level	Economics	
Past-Papers	(Edexcel)
A-Level	Economics	
Past-Papers	(AQA)

Subsidies Notes - A-level & IB Economics