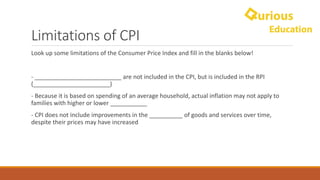
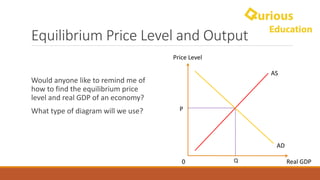
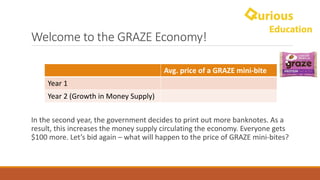
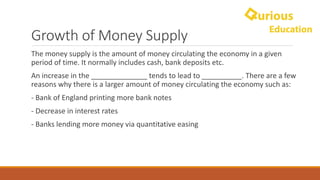
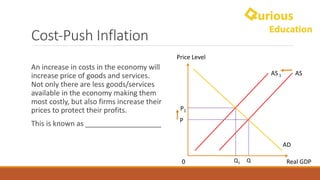
Inflation
GCE	A-LEVEL	&	IB ECONOMICS
Lesson	Structure
◦Measuring	Inflation
◦Limitations	of	CPI
◦Causes	of	Inflation
◦ Growth	in	money	supply
◦ Demand-pull	inflation
◦ Cost-push	inflation
Inflation
Think	about	a	favorite	restaurant	you	tend	to	go	to	over	the	years.	
How	have	the	prices	of	the	food	there	changed?
What	other	items	in	your	daily	lives	have	seen	price	rises	over	the	years?	Discuss	
with	your	neighbour and	come	up	with	3	things	on	your	mini	whiteboard.
Inflation
What	type	of	goods/services	
actually	contributed	to	
inflation	consistently	over	
the	years?
Inflation
Within	housing	and	household	services,	
the	largest	contributions	were	from	owner	
occupiers’	housing	costs	(a	0.19	
percentage	point	contribution	to	the	CPIH	
12-month	rate);	and	council	tax	and	rates	
(a	contribution	of	0.12	percentage	points).	
Electricity,	gas	and	other	fuels	and	actual	
rentals	for	housing	each	contributed	0.05	
percentage	points.
Other	large	upward	contributions	came	
from	transport,	recreation	and	culture,	
and	from	restaurants	and	hotels.	Further	
reductions	in	fuel	prices	continued	the	
downward	trend	in	contributions	from	
transport	that	began	in	September	2018.	
Within	these	categories,	the	most	notable	
contributions	were	from	package	holidays,	
catering	services	and	the	operation	of	
personal	transport	equipment.
Basket	of	Goods
One	way	to	measure	inflation	is	by	using	the	________________________	(CPI).	
It’s	the	graph	you	just	saw!
The	index	takes	in	a	basket	of	goods	an	_________	household	would	buy,	and	
calculate	the	price	difference	year	on	year	to	capture	inflation.
Note	that	the	measure	is	weighted according	to	the	proportions	of	each	
product.	This	means	it	accounts	for	the	quantity	and	value	of	goods	as	well.	E.g.	
if	an	average	household	buys	10	eggs	for	$0.5	each,	it	will	include	$0.5	x	10	=	$5	
cost	of	eggs	in	the	grocery	category.
Basket	of	Goods
But	how	do	they	determine	what	is	an	average	household’s	basket	of	
goods?
A	household	expenditure	__________	is	completed	to	decide	on	the	
basket	of	goods	and	attach	__________	based	on	the	proportion	of	
goods	they	spend	their	incomes	on.
Curious	on	what	goods	are	included/removed?
https://webarchive.nationalarchives.gov.uk/20160109130531/http://
www.ons.gov.uk/ons/infographics/basket-of-goods-2014/index.html
Limitations	of	CPI
Look	up	some	limitations	of	the	Consumer	Price	Index	and	fill	in	the	blanks	below!
- __________________________	are	not	included	in	the	CPI,	but	is	included	in	the	RPI	
(_______________________)
- Because	it	is	based	on	spending	of	an	average	household,	actual	inflation	may	not	apply	to	
families	with	higher	or	lower	___________
- CPI	does	not	include	improvements	in	the	__________	of	goods	and	services	over	time,	
despite	their	prices	may	have	increased
Equilibrium	Price	Level	and	Output
Real	GDP0
Price	Level
AS
P
AD
Q
Would	anyone	like	to	remind	me	of	
how	to	find	the	equilibrium	price	
level	and	real	GDP	of	an	economy?
What	type	of	diagram	will	we	use?
Welcome	to	the	GRAZE	Economy!
Let	us	assume	that	this	economy	only	produces	3	Graze	mini-bites	each	
year.	Each	student	is	a	household	hoping	to	buy	these	mini-bites.	The	
buyer	who	pays	the	highest	price	will	get	the	mini-bite.	Let’s	start	bidding!
Welcome	to	the	GRAZE	Economy!
Avg.	price	of	a	GRAZE	mini-bite
Year	1	
Year	2 (Growth	in	Money	Supply)
In	the	second	year,	the	government	decides	to	print	out	more	banknotes.	As	a	
result,	this	increases	the	money	supply	circulating	the	economy.	Everyone	gets	
$100	more.	Let’s	bid	again	– what	will	happen	to	the	price	of	GRAZE	mini-bites?
Growth	of	Money	Supply
The	money	supply	is	the	amount	of	money	circulating	the	economy	in	a	given	
period	of	time.	It	normally	includes	cash,	bank	deposits	etc.
An	increase	in	the	______________	tends	to	lead	to	__________.	There	are	a	few	
reasons	why	there	is	a	larger	amount	of	money	circulating	the	economy	such	as:
- Bank	of	England	printing	more	bank	notes	
- Decrease	in	interest	rates
- Banks	lending	more	money	via	quantitative	easing
Welcome	to	the	GRAZE	Economy!
Avg.	price	of	a	GRAZE	mini-bite
Year	1	
Year	2 (Growth	in	Money	Supply)
Year	3 (Increase	in	consumption)
In	the	third	year,	the	economy	is	doing	well.	Household	has	rising	incomes	and	
started	demanding	more	goods	and	services.	As	a	result,	most	households	are	
looking	to	buy	2	Graze	mini-bites.	Let’s	bid	again	– what	will	happen	to	the	price	
of	GRAZE	mini-bites?
Demand-Pull	Inflation
An	increase	in	incomes	in	the	economy	
will	increase	consumption	and	
aggregate	demand	as	people	become	
richer.	
When	AD	increases,	prices	of	goods	and	
services	will	become	more	expensive	as	
people	are	willing	to	pay	more	for	it,	
despite	there	is	not	an	increase	in	the	
number	of	goods.	This	is	what	we	call	
______________________.	
Real	GDP0
Price	Level
AS
P1
P
Q1
AD
Q
AD1
Demand-Pull	Inflation
Can	you	think	of	two	situations	when	there	will	be	demand-pull	
inflation	apart	from	an	increase	in	incomes?	Discuss	with	your	
neighbour.
Hint:	Think	about	when	will	factors	of	AD	increase.
Welcome	to	the	GRAZE	Economy!
Avg.	price	of	a	GRAZE	mini-bite
Year	1	
Year	2 (Growth	in	Money	Supply)
Year	3 (Increase	in	consumption)
Year	4	(Production	costs	increase)
In	the	forth	year,	world	price	of	oats	increased	significantly.	As	a	result,	cost	of	
production	increased	significantly	and	Graze	has	decided	to	charge	at	least	$300	for	
each	mini-bite	and	can	only	produce	2.	What	will	happen	to	the	final	price?	Let’s	bid.
Cost-Push	Inflation
An	increase	in	costs	in	the	economy	will	
increase	price	of	goods	and	services.	
Not	only	there	are	less	goods/services	
available	in	the	economy	making	them	
most	costly,	but	also	firms	increase	their	
prices	to	protect	their	profits.
This	is	known	as	___________________
Real	GDP0
Price	Level
AS 1
P1
P
AS
Q
AD
Q1
Cost-Push	Inflation
Can	you	think	of	two	situations	when	there	will	be	cost-push	
inflation	apart	from	an	increase	in	the	cost	of	raw	materials?	Discuss	
with	your	neighbour.
Hint:	Think	about	when	will	AS	decrease.

Inflation Notes - A-level & IB Economics