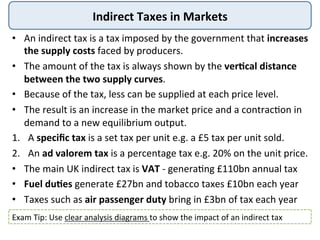
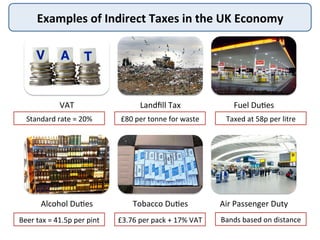
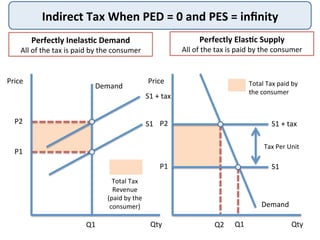
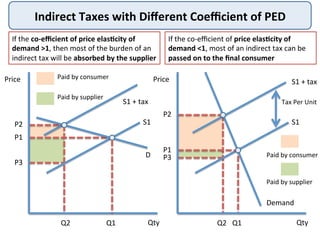
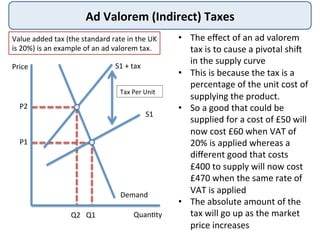
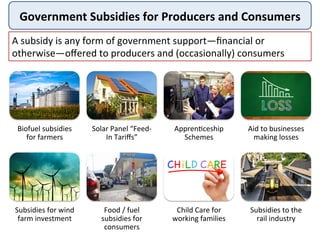
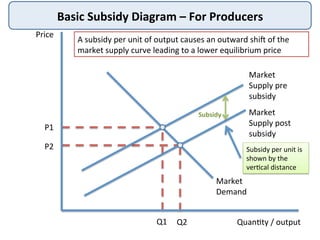
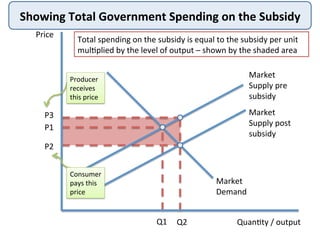
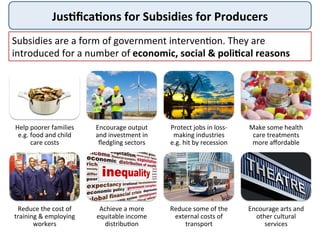
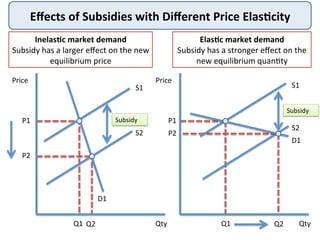
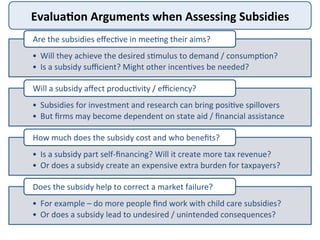
AS	
  Micro:	
  Indirect	
  Taxes	
  &	
  Subsidies	
  
Indirect	
  Taxes	
  
Indirect	
  Taxes	
  in	
  Markets	
  
•  An	
  indirect	
  tax	
  is	
  a	
  tax	
  imposed	
  by	
  the	
  government	
  that	
  increases	
  
the	
  supply	
  costs	
  faced	
  by	
  producers.	
  
•  The	
  amount	
  of	
  the	
  tax	
  is	
  always	
  shown	
  by	
  the	
  ver<cal	
  distance	
  
between	
  the	
  two	
  supply	
  curves.	
  	
  
•  Because	
  of	
  the	
  tax,	
  less	
  can	
  be	
  supplied	
  at	
  each	
  price	
  level.	
  
•  The	
  result	
  is	
  an	
  increase	
  in	
  the	
  market	
  price	
  and	
  a	
  contrac>on	
  in	
  
demand	
  to	
  a	
  new	
  equilibrium	
  output.	
  	
  
1.  A	
  specific	
  tax	
  is	
  a	
  set	
  tax	
  per	
  unit	
  e.g.	
  a	
  £5	
  tax	
  per	
  unit	
  sold.	
  
2.  An	
  ad	
  valorem	
  tax	
  is	
  a	
  percentage	
  tax	
  e.g.	
  20%	
  on	
  the	
  unit	
  price.	
  
•  The	
  main	
  UK	
  indirect	
  tax	
  is	
  VAT	
  -­‐	
  genera>ng	
  £110bn	
  annual	
  tax	
  
•  Fuel	
  du<es	
  generate	
  £27bn	
  and	
  tobacco	
  taxes	
  £10bn	
  each	
  year	
  
•  Taxes	
  such	
  as	
  air	
  passenger	
  duty	
  bring	
  in	
  £3bn	
  of	
  tax	
  each	
  year	
  
Exam	
  Tip:	
  Use	
  clear	
  analysis	
  diagrams	
  to	
  show	
  the	
  impact	
  of	
  an	
  indirect	
  tax	
  
Examples	
  of	
  Indirect	
  Taxes	
  in	
  the	
  UK	
  Economy	
  
VAT	
   Landfill	
  Tax	
   Fuel	
  Du>es	
  
Alcohol	
  Du>es	
   Tobacco	
  Du>es	
   Air	
  Passenger	
  Duty	
  
Standard	
  rate	
  =	
  20%	
   £80	
  per	
  tonne	
  for	
  waste	
   Taxed	
  at	
  58p	
  per	
  litre	
  
Bands	
  based	
  on	
  distance	
  £3.76	
  per	
  pack	
  +	
  17%	
  VAT	
  Beer	
  tax	
  =	
  41.5p	
  per	
  pint	
  
Indirect	
  Tax	
  When	
  PED	
  =	
  0	
  and	
  PES	
  =	
  infinity	
  
Price	
  
Qty	
  
P2	
  
Demand	
  
P1	
  
Q1	
  
S1	
  
S1	
  +	
  tax	
  
Total	
  Tax	
  
Revenue	
  
(paid	
  by	
  the	
  
consumer)	
  
Price	
  
Qty	
  
Demand	
  
S1	
  
S1	
  +	
  tax	
  
Q1	
  Q2	
  
P2	
  
P1	
  
Total	
  Tax	
  paid	
  by	
  
the	
  consumer	
  
Perfectly	
  Inelas<c	
  Demand	
  
All	
  of	
  the	
  tax	
  is	
  paid	
  by	
  the	
  consumer	
  
Perfectly	
  Elas<c	
  Supply	
  
All	
  of	
  the	
  tax	
  is	
  paid	
  by	
  the	
  consumer	
  
Tax	
  Per	
  Unit	
  
Indirect	
  Taxes	
  with	
  Different	
  Coefficient	
  of	
  PED	
  
If	
  the	
  co-­‐efficient	
  of	
  price	
  elas<city	
  of	
  
demand	
  >1,	
  then	
  most	
  of	
  the	
  burden	
  of	
  an	
  
indirect	
  tax	
  will	
  be	
  absorbed	
  by	
  the	
  supplier	
  
Price	
  
Qty	
  
P2	
  
D	
  
Q2	
  
S1	
  
S1	
  +	
  tax	
  
Q1	
  
P1	
  
P3	
  
Paid	
  by	
  consumer	
  
Paid	
  by	
  supplier	
  
If	
  the	
  co-­‐efficient	
  of	
  price	
  elas<city	
  of	
  
demand	
  <1,	
  most	
  of	
  an	
  indirect	
  tax	
  can	
  be	
  
passed	
  on	
  to	
  the	
  final	
  consumer	
  
Price	
  
Qty	
  
P2	
  
Demand	
  
P1	
  
Q2	
  
S1	
  
S1	
  +	
  tax	
  
Q1	
  
P3	
   Paid	
  by	
  consumer	
  
Paid	
  by	
  supplier	
  
Tax	
  Per	
  Unit	
  
Ad	
  Valorem	
  (Indirect)	
  Taxes	
  
Value	
  added	
  tax	
  (the	
  standard	
  rate	
  in	
  the	
  UK	
  
is	
  20%)	
  is	
  an	
  example	
  of	
  an	
  ad	
  valorem	
  tax.	
  
Quan>ty	
  
P2	
  
Demand	
  
P1	
  
Q2	
  
S1	
  
S1	
  +	
  tax	
  
Q1	
  
Price	
  
•  The	
  effect	
  of	
  an	
  ad	
  valorem	
  
tax	
  is	
  to	
  cause	
  a	
  pivotal	
  shi`	
  
in	
  the	
  supply	
  curve	
  
•  This	
  is	
  because	
  the	
  tax	
  is	
  a	
  
percentage	
  of	
  the	
  unit	
  cost	
  of	
  
supplying	
  the	
  product.	
  	
  
•  So	
  a	
  good	
  that	
  could	
  be	
  
supplied	
  for	
  a	
  cost	
  of	
  £50	
  will	
  
now	
  cost	
  £60	
  when	
  VAT	
  of	
  
20%	
  is	
  applied	
  whereas	
  a	
  
different	
  good	
  that	
  costs	
  
£400	
  to	
  supply	
  will	
  now	
  cost	
  
£470	
  when	
  the	
  same	
  rate	
  of	
  
VAT	
  is	
  applied	
  
•  The	
  absolute	
  amount	
  of	
  the	
  
tax	
  will	
  go	
  up	
  as	
  the	
  market	
  
price	
  increases	
  
Tax	
  Per	
  Unit	
  
Evalua<on	
  Arguments	
  when	
  Assessing	
  Indirect	
  Taxes	
  
•  Does	
  an	
  indirect	
  tax	
  achieve	
  the	
  specified	
  aims?	
  
•  Are	
  there	
  unintended	
  consequences	
  of	
  introducing	
  /	
  changing	
  a	
  tax?	
  
Effec>veness	
  of	
  	
  a	
  tax	
  and	
  unintended	
  consequences	
  
•  Does	
  an	
  indirect	
  tax	
  generate	
  substan>al	
  tax	
  revenues?	
  
•  How	
  is	
  the	
  tax	
  revenue	
  used	
  –	
  perhaps	
  for	
  par>cular	
  projects?	
  
How	
  much	
  tax	
  revenue	
  is	
  raised?	
  How	
  is	
  it	
  used?	
  
•  Might	
  there	
  be	
  a	
  possible	
  loss	
  of	
  jobs	
  and/or	
  capital	
  investment?	
  
•  Will	
  an	
  indirect	
  tax	
  nega>vely	
  affect	
  compe>>veness	
  and	
  trade?	
  
What	
  is	
  the	
  impact	
  on	
  businesses	
  /	
  compe>>veness?	
  
•  Is	
  the	
  tax	
  regarded	
  as	
  equitable	
  /	
  fair?	
  	
  
•  Who	
  are	
  the	
  main	
  winners	
  and	
  losers?	
  
•  Does	
  a	
  tax	
  have	
  a	
  regressive	
  effect	
  on	
  lower	
  income	
  groups?	
  
Consequences	
  for	
  equity	
  /	
  the	
  distribu>on	
  of	
  income	
  
Government	
  Subsidies	
  
Government	
  Subsidies	
  for	
  Producers	
  and	
  Consumers	
  
A	
  subsidy	
  is	
  any	
  form	
  of	
  government	
  support—financial	
  or	
  
otherwise—offered	
  to	
  producers	
  and	
  (occasionally)	
  consumers	
  
Biofuel	
  subsidies	
  
for	
  farmers	
  
Solar	
  Panel	
  “Feed-­‐
In	
  Tariffs”	
  
Appren>ceship	
  
Schemes	
  
Aid	
  to	
  businesses	
  
making	
  losses	
  
Subsidies	
  for	
  wind	
  
farm	
  investment	
  
Food	
  /	
  fuel	
  	
  
subsidies	
  for	
  
consumers	
  
Child	
  Care	
  for	
  
working	
  families	
  
Subsidies	
  to	
  the	
  
rail	
  industry	
  
Basic	
  Subsidy	
  Diagram	
  –	
  For	
  Producers	
  
Price	
  
Quan>ty	
  /	
  output	
  
Market	
  
Supply	
  pre	
  
subsidy	
  
P1	
  
Q1	
  
A	
  subsidy	
  per	
  unit	
  of	
  output	
  causes	
  an	
  outward	
  shi`	
  of	
  the	
  
market	
  supply	
  curve	
  leading	
  to	
  a	
  lower	
  equilibrium	
  price	
  
Market	
  
Demand	
  
Market	
  
Supply	
  post	
  
subsidy	
  
P2	
  
Q2	
  
Subsidy	
  
Subsidy	
  per	
  unit	
  is	
  
shown	
  by	
  the	
  
ver>cal	
  distance	
  
Showing	
  Total	
  Government	
  Spending	
  on	
  the	
  Subsidy	
  
Price	
  
Quan>ty	
  /	
  output	
  
Market	
  
Supply	
  pre	
  
subsidy	
  
P1	
  
Q1	
  
Total	
  spending	
  on	
  the	
  subsidy	
  is	
  equal	
  to	
  the	
  subsidy	
  per	
  unit	
  
mul>plied	
  by	
  the	
  level	
  of	
  output	
  –	
  shown	
  by	
  the	
  shaded	
  area	
  
Market	
  
Demand	
  
Market	
  
Supply	
  post	
  
subsidy	
  
P2	
  
Q2	
  
P3	
  
Producer	
  
receives	
  
this	
  price	
  
Consumer	
  
pays	
  this	
  
price	
  
Jus<fica<ons	
  for	
  Subsidies	
  for	
  Producers	
  
Subsidies	
  are	
  a	
  form	
  of	
  government	
  interven>on.	
  They	
  are	
  
introduced	
  for	
  a	
  number	
  of	
  economic,	
  social	
  &	
  poli<cal	
  reasons	
  
Help	
  poorer	
  families	
  
e.g.	
  food	
  and	
  child	
  
care	
  costs	
  
Encourage	
  output	
  
and	
  investment	
  in	
  
fledgling	
  sectors	
  
Protect	
  jobs	
  in	
  loss-­‐
making	
  industries	
  
e.g.	
  hit	
  by	
  recession	
  
Make	
  some	
  health	
  
care	
  treatments	
  
more	
  affordable	
  
Reduce	
  the	
  cost	
  of	
  
training	
  &	
  employing	
  
workers	
  
Achieve	
  a	
  more	
  
equitable	
  income	
  
distribu>on	
  
Reduce	
  some	
  of	
  the	
  
external	
  costs	
  of	
  
transport	
  
Encourage	
  arts	
  and	
  
other	
  cultural	
  
services	
  
Effects	
  of	
  Subsidies	
  with	
  Different	
  Price	
  Elas<city	
  
Inelas<c	
  market	
  demand	
  
Subsidy	
  has	
  a	
  larger	
  effect	
  on	
  the	
  new	
  
equilibrium	
  price	
  
Price	
  
Qty	
  
Price	
  
Qty	
  
P1	
  
Q1	
  
Elas<c	
  market	
  demand	
  
Subsidy	
  has	
  a	
  stronger	
  effect	
  on	
  the	
  
new	
  equilibrium	
  quan>ty	
  
D1	
  
P2	
  
Q2	
  
S1	
  
S2	
  
S1	
  
S2	
  
D1	
  
Q1	
   Q2	
  
P1	
  
P2	
  
Subsidy	
  
Subsidy	
  
Evalua<on	
  Arguments	
  when	
  Assessing	
  Subsidies	
  
•  Will	
  they	
  achieve	
  the	
  desired	
  s>mulus	
  to	
  demand	
  /	
  consump>on?	
  
•  Is	
  a	
  subsidy	
  sufficient?	
  Might	
  other	
  incen>ves	
  be	
  needed?	
  
Are	
  the	
  subsidies	
  effec>ve	
  in	
  mee>ng	
  their	
  aims?	
  
•  Subsidies	
  for	
  investment	
  and	
  research	
  can	
  bring	
  posi>ve	
  spillovers	
  
•  But	
  firms	
  may	
  become	
  dependent	
  on	
  state	
  aid	
  /	
  financial	
  assistance	
  
Will	
  a	
  subsidy	
  affect	
  produc>vity	
  /	
  efficiency?	
  
•  Is	
  a	
  subsidy	
  part	
  self-­‐financing?	
  Will	
  it	
  create	
  more	
  tax	
  revenue?	
  
•  Or	
  does	
  a	
  subsidy	
  create	
  an	
  expensive	
  extra	
  burden	
  for	
  taxpayers?	
  
How	
  much	
  does	
  the	
  subsidy	
  cost	
  and	
  who	
  benefits?	
  
•  For	
  example	
  –	
  do	
  more	
  people	
  find	
  work	
  with	
  child	
  care	
  subsidies?	
  
•  Or	
  does	
  a	
  subsidy	
  lead	
  to	
  undesired	
  /	
  unintended	
  consequences?	
  
Does	
  the	
  subsidy	
  help	
  to	
  correct	
  a	
  market	
  failure?	
  
AS	
  Micro:	
  Indirect	
  Taxes	
  &	
  Subsidies	
  

Indirect Taxes & Subsidies

  • 1.
    AS  Micro:  Indirect  Taxes  &  Subsidies  
  • 2.
  • 3.
    Indirect  Taxes  in  Markets   •  An  indirect  tax  is  a  tax  imposed  by  the  government  that  increases   the  supply  costs  faced  by  producers.   •  The  amount  of  the  tax  is  always  shown  by  the  ver<cal  distance   between  the  two  supply  curves.     •  Because  of  the  tax,  less  can  be  supplied  at  each  price  level.   •  The  result  is  an  increase  in  the  market  price  and  a  contrac>on  in   demand  to  a  new  equilibrium  output.     1.  A  specific  tax  is  a  set  tax  per  unit  e.g.  a  £5  tax  per  unit  sold.   2.  An  ad  valorem  tax  is  a  percentage  tax  e.g.  20%  on  the  unit  price.   •  The  main  UK  indirect  tax  is  VAT  -­‐  genera>ng  £110bn  annual  tax   •  Fuel  du<es  generate  £27bn  and  tobacco  taxes  £10bn  each  year   •  Taxes  such  as  air  passenger  duty  bring  in  £3bn  of  tax  each  year   Exam  Tip:  Use  clear  analysis  diagrams  to  show  the  impact  of  an  indirect  tax  
  • 4.
    Examples  of  Indirect  Taxes  in  the  UK  Economy   VAT   Landfill  Tax   Fuel  Du>es   Alcohol  Du>es   Tobacco  Du>es   Air  Passenger  Duty   Standard  rate  =  20%   £80  per  tonne  for  waste   Taxed  at  58p  per  litre   Bands  based  on  distance  £3.76  per  pack  +  17%  VAT  Beer  tax  =  41.5p  per  pint  
  • 5.
    Indirect  Tax  When  PED  =  0  and  PES  =  infinity   Price   Qty   P2   Demand   P1   Q1   S1   S1  +  tax   Total  Tax   Revenue   (paid  by  the   consumer)   Price   Qty   Demand   S1   S1  +  tax   Q1  Q2   P2   P1   Total  Tax  paid  by   the  consumer   Perfectly  Inelas<c  Demand   All  of  the  tax  is  paid  by  the  consumer   Perfectly  Elas<c  Supply   All  of  the  tax  is  paid  by  the  consumer   Tax  Per  Unit  
  • 6.
    Indirect  Taxes  with  Different  Coefficient  of  PED   If  the  co-­‐efficient  of  price  elas<city  of   demand  >1,  then  most  of  the  burden  of  an   indirect  tax  will  be  absorbed  by  the  supplier   Price   Qty   P2   D   Q2   S1   S1  +  tax   Q1   P1   P3   Paid  by  consumer   Paid  by  supplier   If  the  co-­‐efficient  of  price  elas<city  of   demand  <1,  most  of  an  indirect  tax  can  be   passed  on  to  the  final  consumer   Price   Qty   P2   Demand   P1   Q2   S1   S1  +  tax   Q1   P3   Paid  by  consumer   Paid  by  supplier   Tax  Per  Unit  
  • 7.
    Ad  Valorem  (Indirect)  Taxes   Value  added  tax  (the  standard  rate  in  the  UK   is  20%)  is  an  example  of  an  ad  valorem  tax.   Quan>ty   P2   Demand   P1   Q2   S1   S1  +  tax   Q1   Price   •  The  effect  of  an  ad  valorem   tax  is  to  cause  a  pivotal  shi`   in  the  supply  curve   •  This  is  because  the  tax  is  a   percentage  of  the  unit  cost  of   supplying  the  product.     •  So  a  good  that  could  be   supplied  for  a  cost  of  £50  will   now  cost  £60  when  VAT  of   20%  is  applied  whereas  a   different  good  that  costs   £400  to  supply  will  now  cost   £470  when  the  same  rate  of   VAT  is  applied   •  The  absolute  amount  of  the   tax  will  go  up  as  the  market   price  increases   Tax  Per  Unit  
  • 8.
    Evalua<on  Arguments  when  Assessing  Indirect  Taxes   •  Does  an  indirect  tax  achieve  the  specified  aims?   •  Are  there  unintended  consequences  of  introducing  /  changing  a  tax?   Effec>veness  of    a  tax  and  unintended  consequences   •  Does  an  indirect  tax  generate  substan>al  tax  revenues?   •  How  is  the  tax  revenue  used  –  perhaps  for  par>cular  projects?   How  much  tax  revenue  is  raised?  How  is  it  used?   •  Might  there  be  a  possible  loss  of  jobs  and/or  capital  investment?   •  Will  an  indirect  tax  nega>vely  affect  compe>>veness  and  trade?   What  is  the  impact  on  businesses  /  compe>>veness?   •  Is  the  tax  regarded  as  equitable  /  fair?     •  Who  are  the  main  winners  and  losers?   •  Does  a  tax  have  a  regressive  effect  on  lower  income  groups?   Consequences  for  equity  /  the  distribu>on  of  income  
  • 9.
  • 10.
    Government  Subsidies  for  Producers  and  Consumers   A  subsidy  is  any  form  of  government  support—financial  or   otherwise—offered  to  producers  and  (occasionally)  consumers   Biofuel  subsidies   for  farmers   Solar  Panel  “Feed-­‐ In  Tariffs”   Appren>ceship   Schemes   Aid  to  businesses   making  losses   Subsidies  for  wind   farm  investment   Food  /  fuel     subsidies  for   consumers   Child  Care  for   working  families   Subsidies  to  the   rail  industry  
  • 11.
    Basic  Subsidy  Diagram  –  For  Producers   Price   Quan>ty  /  output   Market   Supply  pre   subsidy   P1   Q1   A  subsidy  per  unit  of  output  causes  an  outward  shi`  of  the   market  supply  curve  leading  to  a  lower  equilibrium  price   Market   Demand   Market   Supply  post   subsidy   P2   Q2   Subsidy   Subsidy  per  unit  is   shown  by  the   ver>cal  distance  
  • 12.
    Showing  Total  Government  Spending  on  the  Subsidy   Price   Quan>ty  /  output   Market   Supply  pre   subsidy   P1   Q1   Total  spending  on  the  subsidy  is  equal  to  the  subsidy  per  unit   mul>plied  by  the  level  of  output  –  shown  by  the  shaded  area   Market   Demand   Market   Supply  post   subsidy   P2   Q2   P3   Producer   receives   this  price   Consumer   pays  this   price  
  • 13.
    Jus<fica<ons  for  Subsidies  for  Producers   Subsidies  are  a  form  of  government  interven>on.  They  are   introduced  for  a  number  of  economic,  social  &  poli<cal  reasons   Help  poorer  families   e.g.  food  and  child   care  costs   Encourage  output   and  investment  in   fledgling  sectors   Protect  jobs  in  loss-­‐ making  industries   e.g.  hit  by  recession   Make  some  health   care  treatments   more  affordable   Reduce  the  cost  of   training  &  employing   workers   Achieve  a  more   equitable  income   distribu>on   Reduce  some  of  the   external  costs  of   transport   Encourage  arts  and   other  cultural   services  
  • 14.
    Effects  of  Subsidies  with  Different  Price  Elas<city   Inelas<c  market  demand   Subsidy  has  a  larger  effect  on  the  new   equilibrium  price   Price   Qty   Price   Qty   P1   Q1   Elas<c  market  demand   Subsidy  has  a  stronger  effect  on  the   new  equilibrium  quan>ty   D1   P2   Q2   S1   S2   S1   S2   D1   Q1   Q2   P1   P2   Subsidy   Subsidy  
  • 15.
    Evalua<on  Arguments  when  Assessing  Subsidies   •  Will  they  achieve  the  desired  s>mulus  to  demand  /  consump>on?   •  Is  a  subsidy  sufficient?  Might  other  incen>ves  be  needed?   Are  the  subsidies  effec>ve  in  mee>ng  their  aims?   •  Subsidies  for  investment  and  research  can  bring  posi>ve  spillovers   •  But  firms  may  become  dependent  on  state  aid  /  financial  assistance   Will  a  subsidy  affect  produc>vity  /  efficiency?   •  Is  a  subsidy  part  self-­‐financing?  Will  it  create  more  tax  revenue?   •  Or  does  a  subsidy  create  an  expensive  extra  burden  for  taxpayers?   How  much  does  the  subsidy  cost  and  who  benefits?   •  For  example  –  do  more  people  find  work  with  child  care  subsidies?   •  Or  does  a  subsidy  lead  to  undesired  /  unintended  consequences?   Does  the  subsidy  help  to  correct  a  market  failure?  
  • 16.
    AS  Micro:  Indirect  Taxes  &  Subsidies