Download to read offline
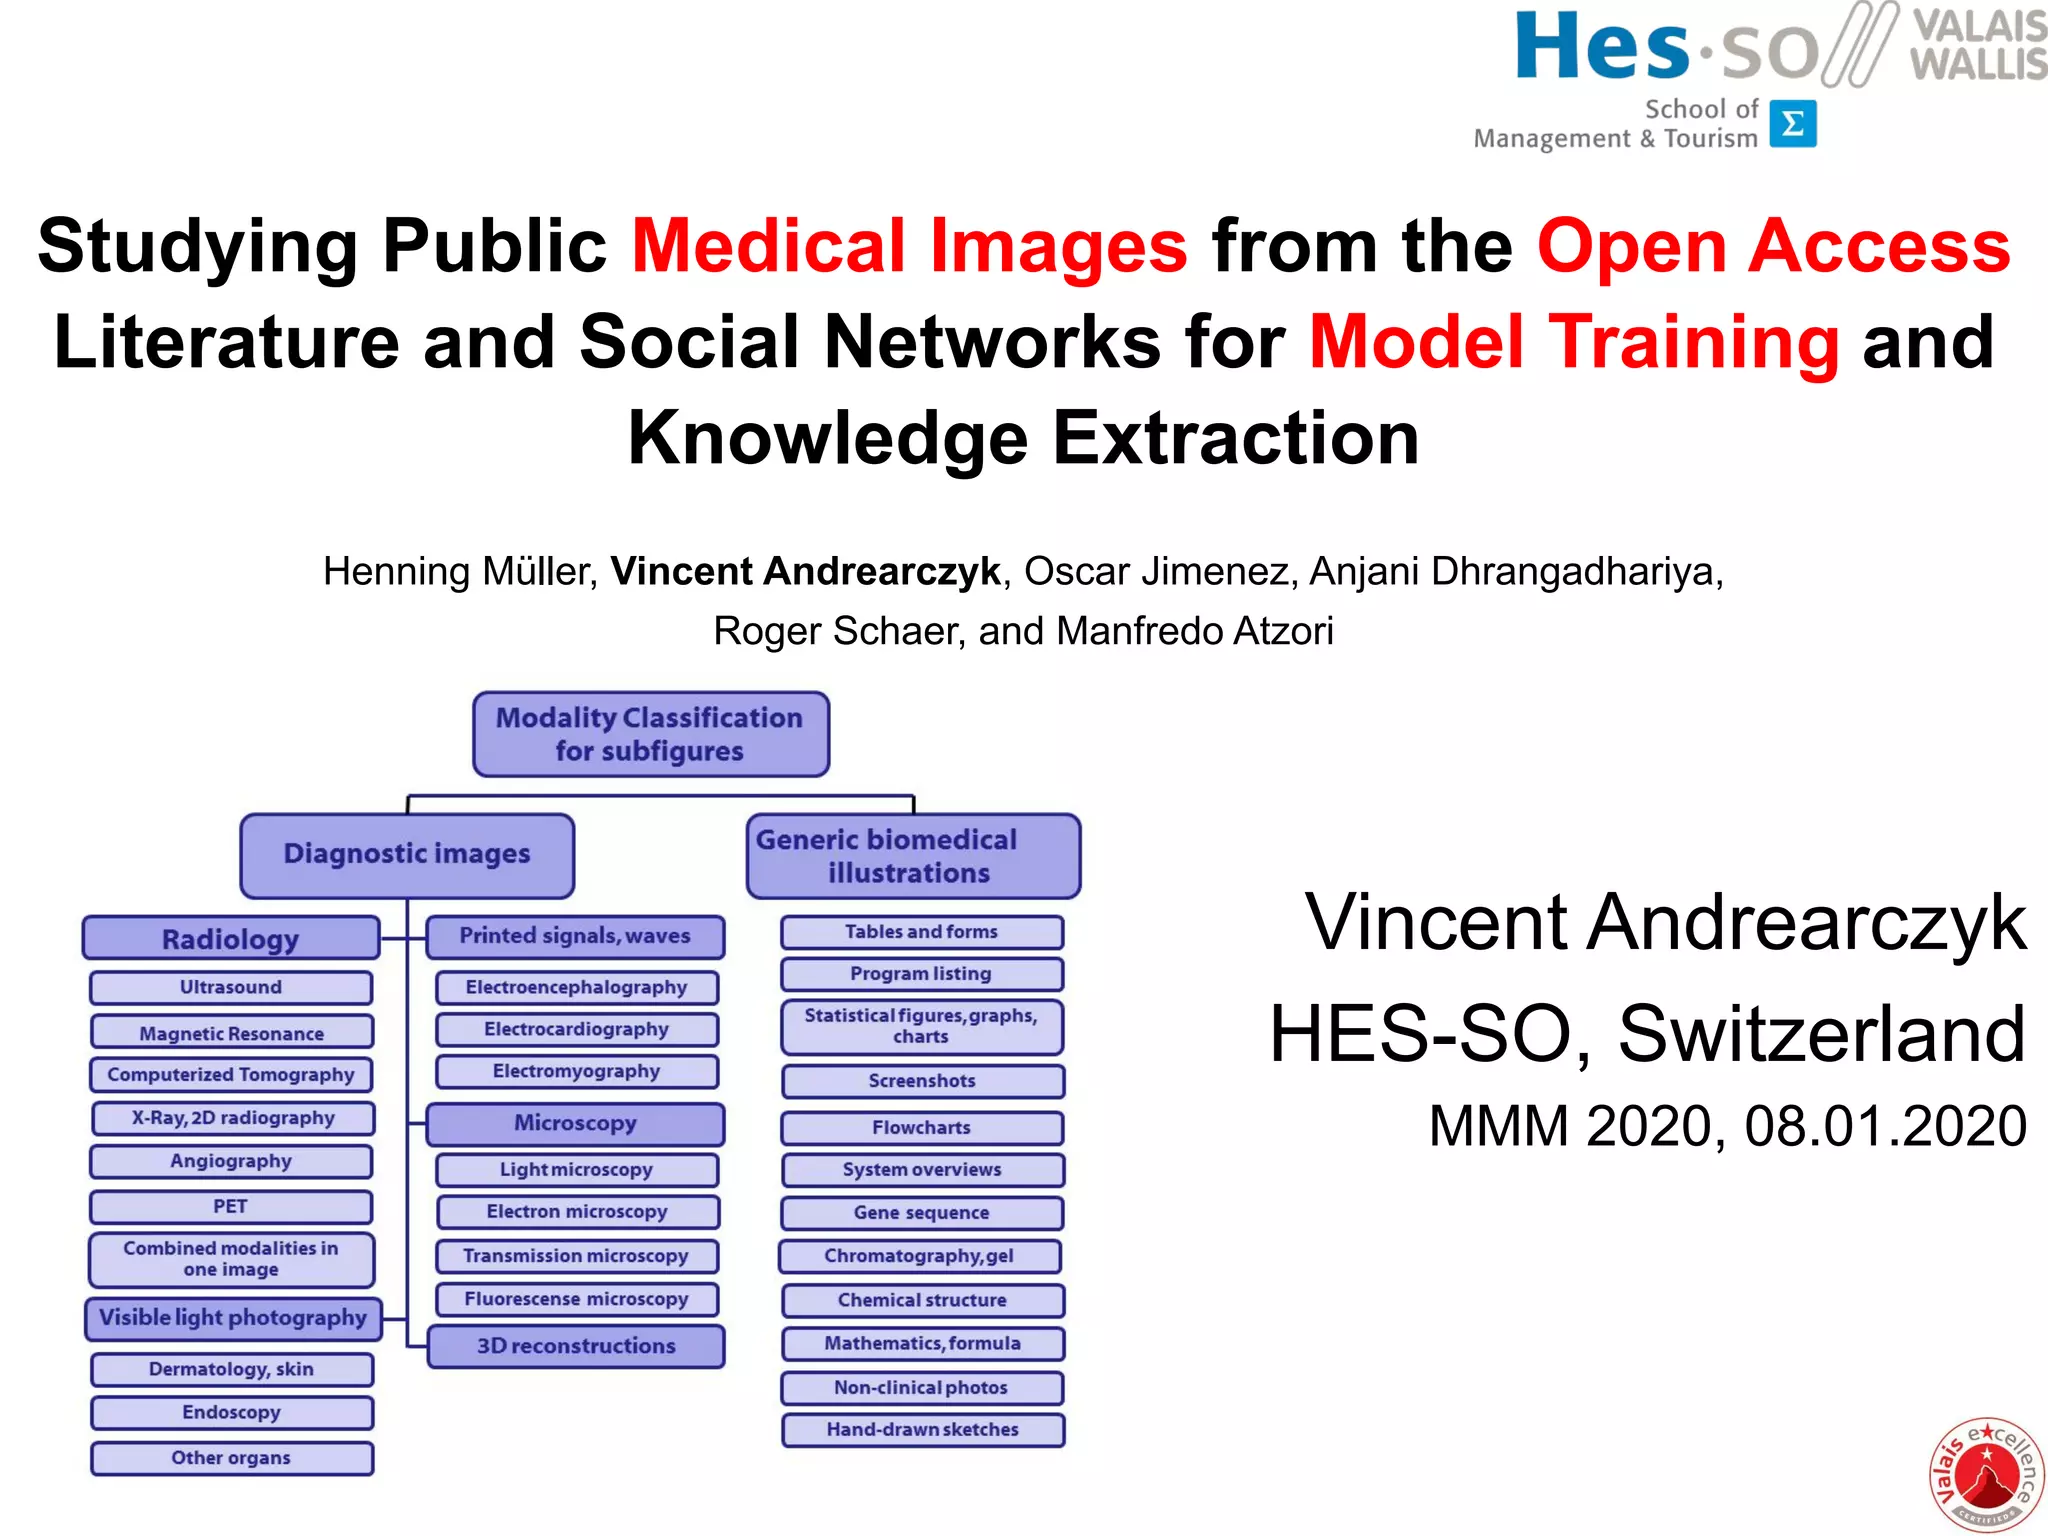
![Structuring the visual content
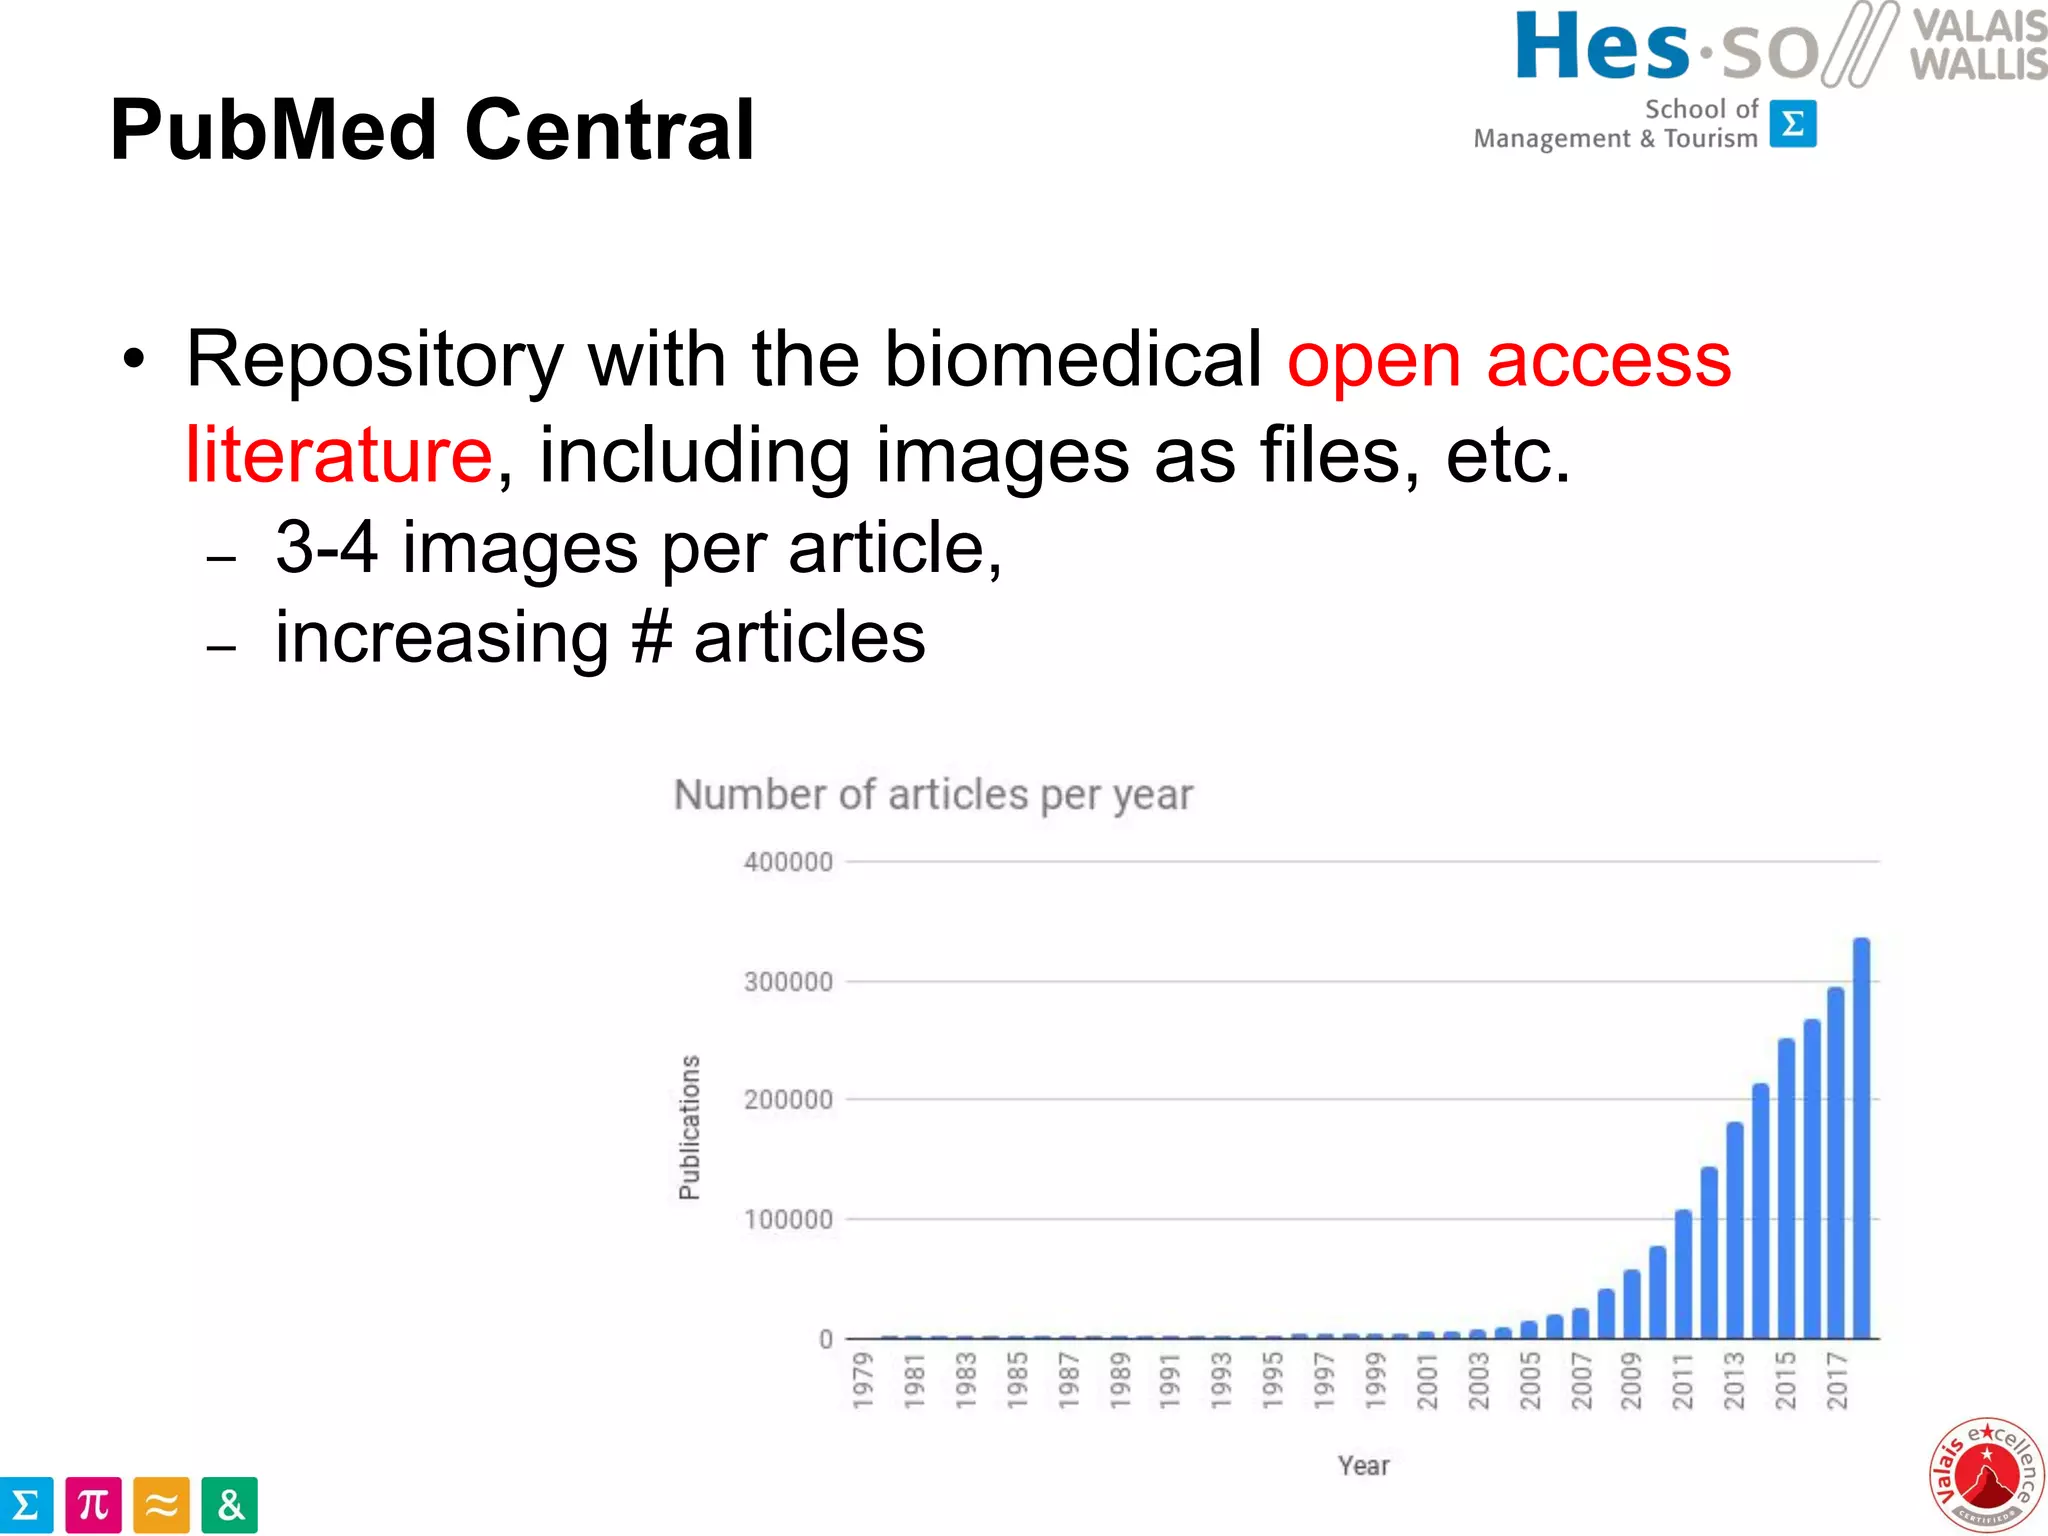
• Define types of images to make the literature
images classifiable
– Extremely large variety in most categories
– Many sub-categories are possible
– Categories with clinical relevance
are most important
– Allows removing noise
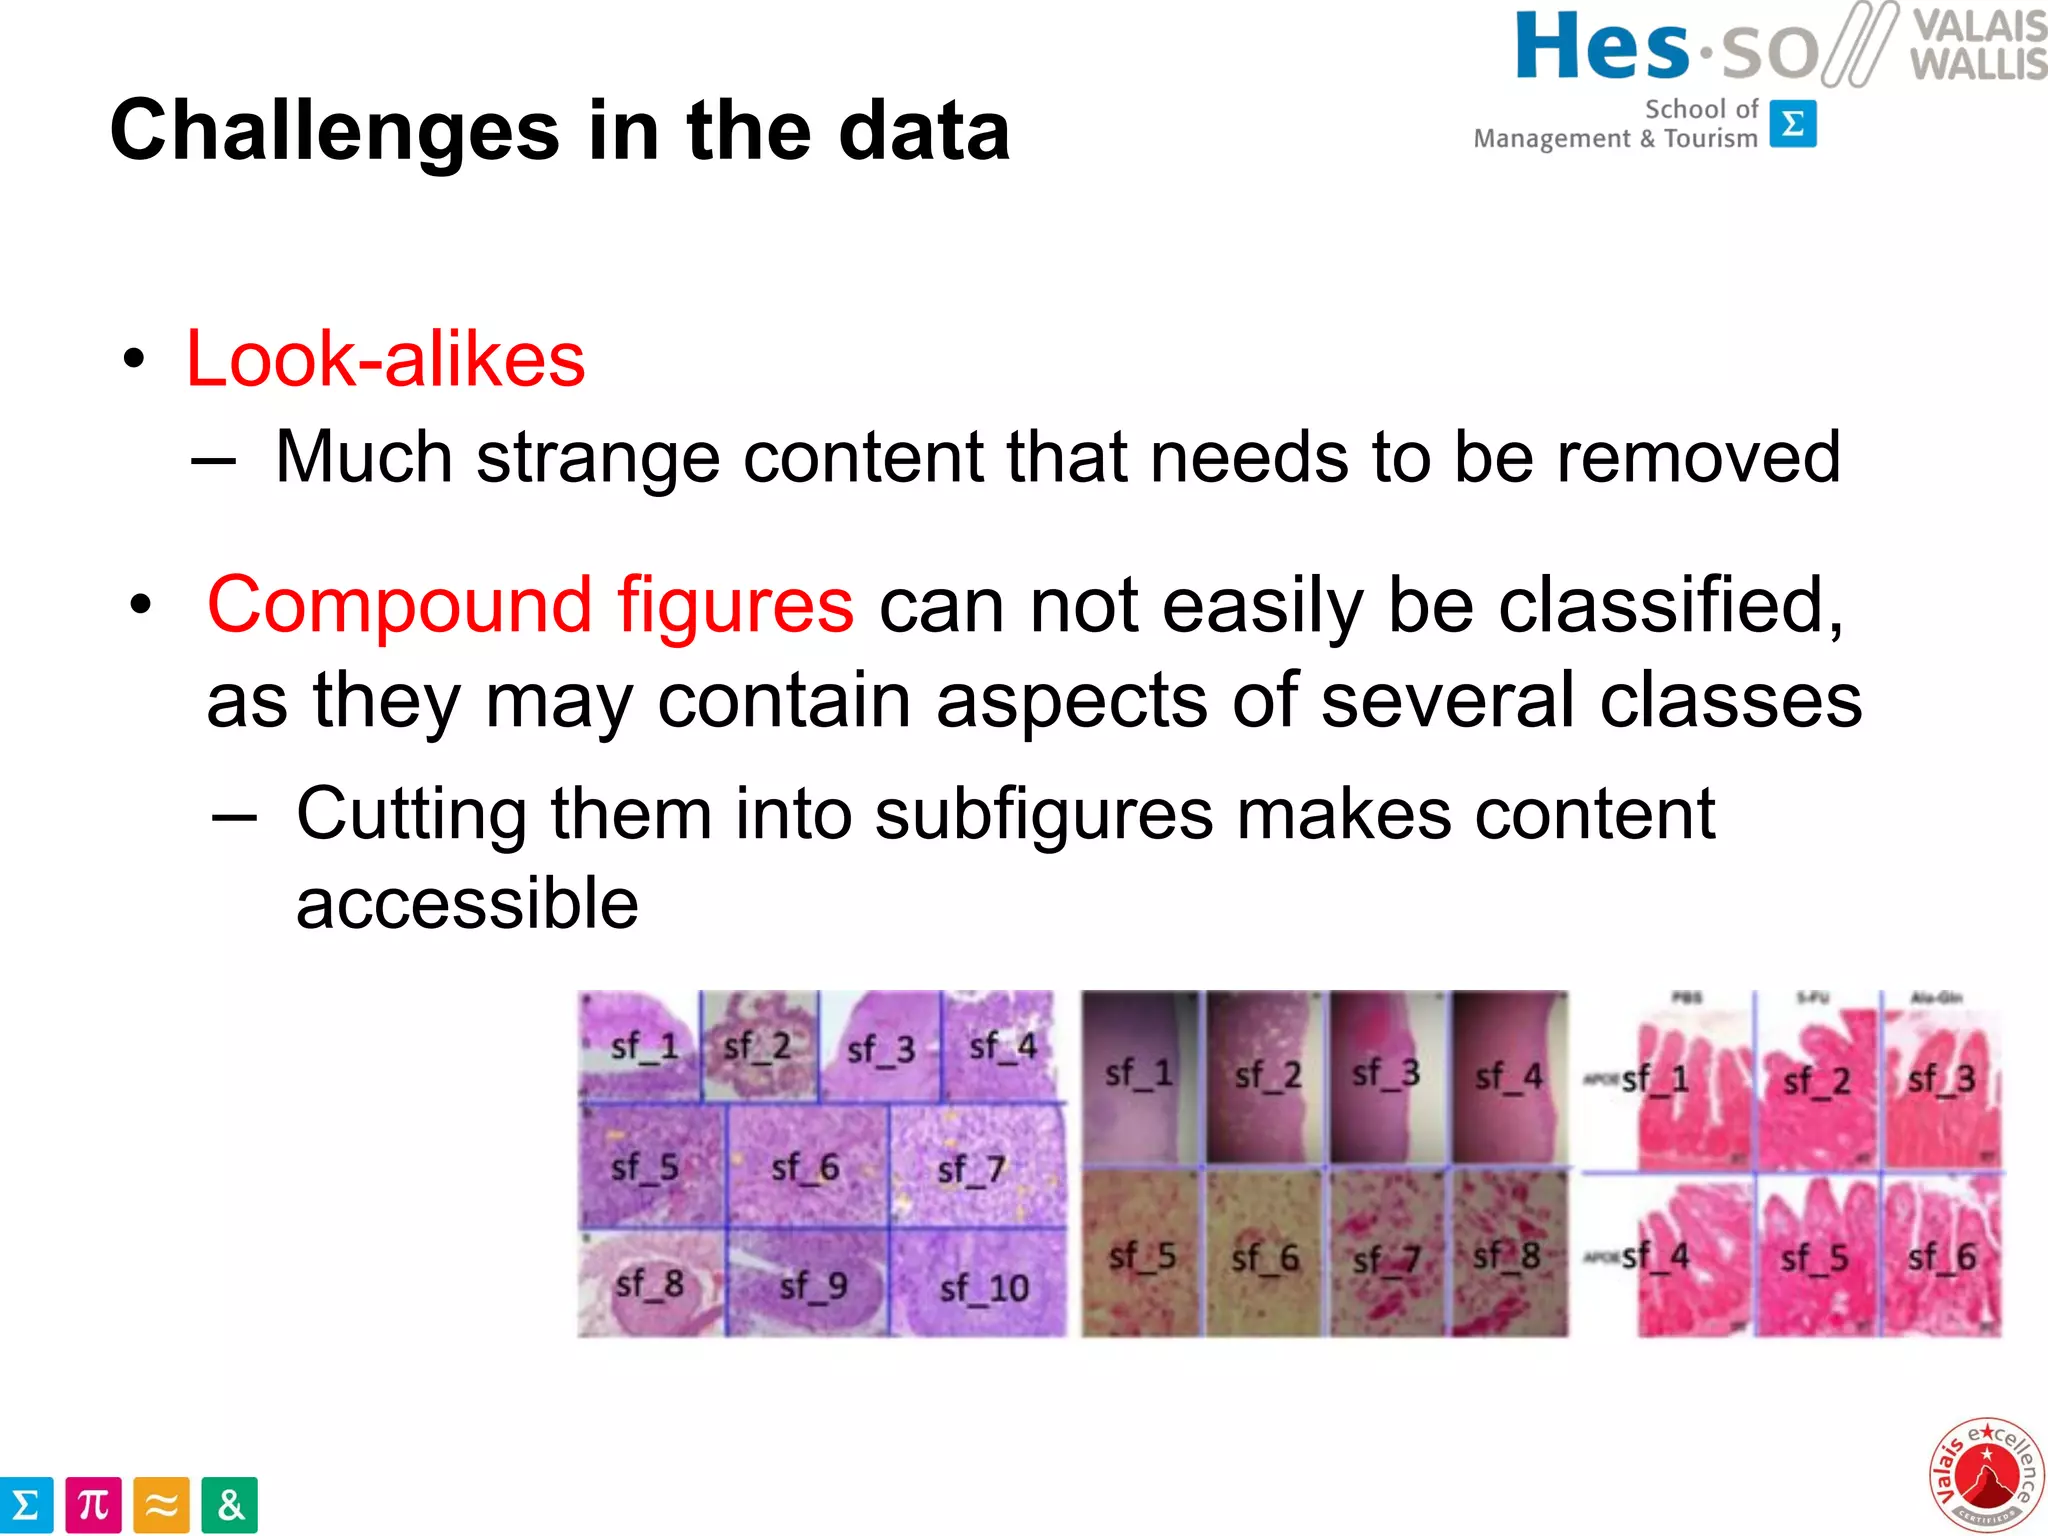
– Compound figures
are separately treated
[ImageCLEF 2013]](https://image.slidesharecdn.com/pdfpresentationmmm2020-200131151239/75/Studying-Public-Medical-Images-from-Open-Access-Literature-and-Social-Networks-for-Model-Training-and-Knowledge-Extraction-8-2048.jpg)

This document discusses the utilization of public medical images from open access literature and social networks for enhancing deep learning model training in image analysis. It highlights the challenges of data diversity, class imbalances in rare diseases, and the need for effective data aggregation and filtering techniques. The article also emphasizes the advantages of using diverse and rare images from various sources alongside next steps for improving data curation and machine learning tasks.


![[DSC Europe 25] Vid Stimac - Policy Parsimony: Between Oversimplifying and Ov...](https://cdn.slidesharecdn.com/ss_thumbnails/eqlepagzqp2rhg3gbluh-dsc-stimac-251120-251205090438-059e7f54-thumbnail.jpg?width=640&height=640&fit=bounds)

![[DSC Europe 25] Jim Sterne - Adopting Generative AI Capabilities Into the Ent...](https://cdn.slidesharecdn.com/ss_thumbnails/sxhpofuorcagxsaulkmt-3-251204082258-7e66bc48-thumbnail.jpg?width=640&height=640&fit=bounds)
![[DSC Europe 25] Dusan Jovicic - AI Story: From on-prem to cloud and back agai...](https://cdn.slidesharecdn.com/ss_thumbnails/8kp49m6uq22ifnbwhfnk-2-251205085715-964d11a6-thumbnail.jpg?width=640&height=640&fit=bounds)

![[DSC Europe 25] Petar Zivanov - AI meets documents From chatbots to AI-powere...](https://cdn.slidesharecdn.com/ss_thumbnails/xer2bb6nrdc8pdpev0pc-8-251204082258-7c2fa4a1-thumbnail.jpg?width=640&height=640&fit=bounds)


![[DSC Europe 25] Max Talanov - Non digital NNs.pptx](https://cdn.slidesharecdn.com/ss_thumbnails/wif8tr3gtua74qvtopke-non-digital-nns-251205090438-26b0eea6-thumbnail.jpg?width=640&height=640&fit=bounds)


![[DSC Europe 25] Goran Obradovic - The Rise of Sovereign AI: Building the Regi...](https://cdn.slidesharecdn.com/ss_thumbnails/7nw2xxixrxqdxvrb5wca-6-251205085714-ab09a2ac-thumbnail.jpg?width=640&height=640&fit=bounds)

