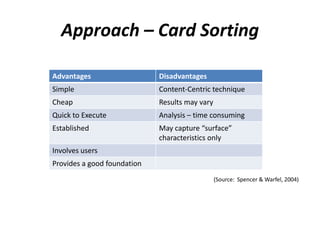
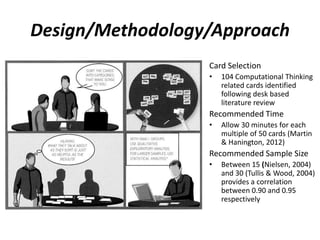
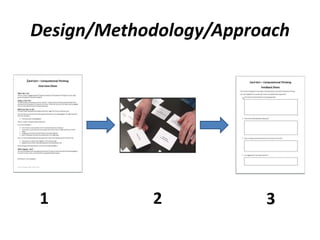
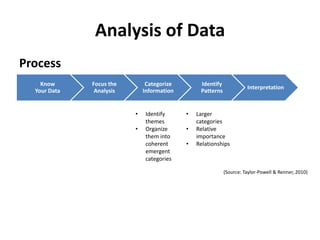
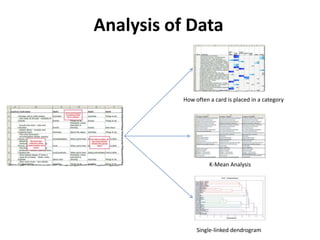
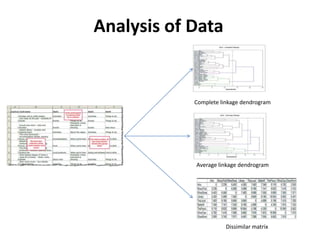
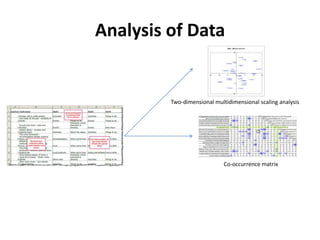
Data Education project briefing for Royal SocietyKate Farrell
Presentation by Kate Farrell from the University of Edinburgh to the Royal Society's Advisory Committee on Mathematics Education (RS ACME) on 20th January 2020
Advances in Learning Analytics and Educational Data Mining MehrnooshV
This presentation is about the state-of-the-art of Learning Analytics and Edicational Data Mining. It is presented by Mehrnoosh Vahdat as the introductory tutorial of Special Session 'Advances in Learning Analytics and Educational Data Mining' at ESANN 2015 conference.
USING MRQAP TO ANALYSE THE DEVELOPMENT OF MATHEMATICS PRE-SERVICE TRAINEES’ C...Christian Bokhove
This paper looks at a data analysis method for analyzing longitudinal network data called MRQAP. We describe a dataset from a study on the development of peer networks of one cohort of pre-service mathematics trainees in the south of England and apply the MRQAP method to its four timepoints. We include attributes for gender, study programme, trust and self-efficacy. The analysis shows that MRQAP is a viable data analysis method for looking at the longitudinal development of networks. We conclude with a short discussion of further methodological challenges and limitations.
Data Mining Application in Advertisement Management of Higher Educational Ins...ijcax
In recent years, Indian higher educational institute’s competition grows rapidly for attracting students to get enrollment in their institutes. To attract students educational institutes select a best advertisement method. There are different advertisements available in the market but a selection of them is very difficult
for institutes. This paper is helpful for institutes to select a best advertisement medium using some data mining methods.
In England, an important role for the judgement of educational quality, is provided by the national school inspectorate Ofsted. Periodically they inspect schools and judge them. The result of the inspection is captured in inspection reports and associated documents. Ofsted has had several chief inspectors (HMCI) since 2000 and every HMCI tends to put his/her own mark on the inspectorate. This paper extends the analysis of the corpus in Author (2020) using the corpus of more than 17,000 Ofsted documents which were scraped from their website with text-mining techniques. Using the computational research method of structural topic modelling I re-analyse a set of documents that typically could not be analysed with manual methods. I juxtapose the findings with previous findings from sentiment analyses. The paper does not just cover the substantive topic at hand, but also provide insight in how the methods work, and how they provide insight in policy shifts during the ‘reign’ of different HMCIs. All in all, we can see how such text-mining techniques allow us to analyse existing documents at scale.
Ijdms050304A SURVEY ON EDUCATIONAL DATA MINING AND RESEARCH TRENDSijdms
Educational Data Mining (EDM) is an emerging field exploring data in educational context by applying
different Data Mining (DM) techniques/tools. It provides intrinsic knowledge of teaching and learning
process for effective education planning. In this survey work focuses on components, research trends (1998
to 2012) of EDM highlighting its related Tools, Techniques and educational Outcomes. It also highlights
the Challenges EDM.
Slides from Keynote presentation at the University of Southern California's 2015 Teaching with Technology annual conference.
"9:15 am – ANN Auditorium
Key Note: What Do We Mean by Learning Analytics?
Leah Macfadyen, Director for Evaluation and Learning Analytics, University of British Columbia
Executive Board, SoLAR (Society for Learning Analytics Research)
Leah Macfadyen will define and explore the emerging and interdisciplinary field of learning analytics in the context of quantified and personalized learning. Leah will use actual examples and case studies to illustrate the range of stakeholders learning analytics may serve, the diverse array of questions they may be used to address, and the potential impact of learning analytics in higher education."
Computational Social Science – what is it and what can(‘t) it do?Christian Bokhove
Title: Computational Social Science – what is it and what can(‘t) it do?
What is your talk about?
In Computational Social Science (CSS) we use computer science algorithms to analyse qualitative data at scale. In this talk I define CSS, describe what the opportunities and barriers are in using such methods, and give examples from published research, for example on analysing thousands of Ofsted documents.
What are the key messages of your talk?
The use of CSS methods makes it is possible to analyse some data sources at scale that previously would be unrealistic to analyse ‘by hand’.
What are the implications for practice or research from your talk?
CSS allows both more qualitative and more quantitative researchers to analyse unstructured data sources at scale.
Short Biography
Dr Christian Bokhove is an Associate Professor in Mathematics. In his research, he combines conventional qualitative and quantitative methods with novel computational methods.
Educational Data Mining in Program Evaluation: Lessons LearnedKerry Rice
AET 2016 Researchers present findings from a series of data mining studies, primarily examining data mining as part of an innovative triangulated approach in program evaluation. Findings suggest that is it possible to apply EDM techniques in online and blended learning classrooms to identify key variables important to the success of learners. Lessons learned will be shared as well as areas for improving data collection in learning management systems for meaningful analysis and visualization.
Simplifying Database Normalization within a Visual Interactive Simulation Modelijdms
Although many researchers focused on investigating the challenges of database normalization, and suggested recommendations on easing these challenges, this process remained an area of concern to database designers, developers, and learners. This paper investigated these challenges and involved Higher Education in Computer Science students learning database normalization, as they could well
represent beginning database designers/developers, who would struggle in effectively normalize their database design due to the complexity of this theoretical process, which has no similar real-life representation. The paper focused on the advantages of interactive visualization techniques to simplify database normalization, and recommended virtual world technologies, such as ‘Second Life’, as an effective platform to achieve this visualization via a simulated model of a relational database system. The simulation technique presented in this paper is novel, and is supported by extensive evidence on its
advantages to achieve an illustration of the ‘Normal Forms’ and the need for them.
Publication Trends in Physics Education: A Bibliometric studyMahboobeh Jamali
A publication trend in Physics Education by employing bibliometric analysis leads the researchers to describe current scientific movement. This paper tries to answer “What do Physics education scientists concentrate in their publications?” by analyzing the productivity and development of publications on the subject category of Physics Education in the period 1980–2013. The Web of Science databases in the research areas of “EDUCATION - EDUCATIONAL RESEARCH” was used to extract the publication trends. The study involves 1360 publications, including 840 articles, 503 proceedings paper, 22 reviews, 7 editorial material, 6 Book review, and one Biographical item. Number of publications with “Physical Education” in topic increased from 0.14 % (n = 2) in 1980 to 16.54 % (n = 225) in 2011. Total number of receiving citations is 8071, with approximately citations per papers of 5.93. The results show the publication and citations in Physic Education has increased dramatically while the Malaysian share is well ranked.
<a><img src="https://zenodo.org/badge/DOI/10.5281/zenodo.801889.svg"></a>
This was part of the Doctoral Consortium presentation in the ICMI Conference 2019 at Suzhou, China on 14th October, 2019. Collaboration is an important skill of the 21st century. It can take place in an online (or remote) setting or in a colocated
(or face-to-face) setting. With the large scale adoption
of sensor use, studies on co-located collaboration (CC) has
gained momentum. CC takes place in physical spaces where
the group members share each other’s social and epistemic
space. This involves subtle multimodal interactions such
as gaze, gestures, speech, discourse which are complex in
nature. The aim of this PhD is to detect these interactions
and then use these insights to build an automated real-time
feedback system to facilitate co-located collaboration
Educational Data Mining is used to find interesting patterns from the data taken from
educational settings to improve teaching and learning. Assessing student’s ability and performance with
EDM methods in e-learning environment for math education in school level in India has not been
identified in our literature review. Our method is a novel approach in providing quality math education
with assessments indicating the knowledge level of a student in each lesson. This paper illustrates how
Learning Curve – an EDM visualization method is used to compare rural and urban students’ progress
in learning mathematics in an e-learning environment. The experiment is conducted in two different
schools in Tamil Nadu, India. After practicing the problems the students attended the test and their
interaction data are collected and analyzed their performance in different aspects: Knowledge
component level, time taken to solve a problem, error rate. This work studies the student actions for
identifying learning progress. The results show that the learning curve method is much helpful to the
teachers to visualize the students’ performance in granular level which is not possible manually. Also it
helps the students in knowing about their skill level when they complete each unit.
Mineral pour FoodLoire : le numérique au service de votre développement com...Quentin de Molliens
Clients cibles : Marché Viti-vinicole
Recommandations par mineral | 29 Juin 2016 | FoodLoire - Angers
“vous faites de bons produits, nous le faisons savoir” @mineralagency | www.mineral.agency
Cognitive Computing and Education and Learningijtsrd
Its enormous potential in learning spurs Cognitive Computing. The overreaching purpose here is to devise computational frameworks to help us learn better by exploiting the learning process and activities. The research challenge recognized the broad spectrum of human learning, the complex and not fully understood human learning process, and various learning factors, such as pedagogy, technology, and social elements. From the theoretical point of view, Cognitive Computing could replace existing calculators in many applications. This paper focuses on applying data mining and learning analytics, clustering student modeling, and predicting student performance when involved in the education field with possible approaches. Latifa Rahman "Cognitive Computing and Education and Learning" Published in International Journal of Trend in Scientific Research and Development (ijtsrd), ISSN: 2456-6470, Volume-6 | Issue-3 , April 2022, URL: https://www.ijtsrd.com/papers/ijtsrd49783.pdf Paper URL: https://www.ijtsrd.com/humanities-and-the-arts/education/49783/cognitive-computing-and-education-and-learning/latifa-rahman
Learning design and data analytics: from teacher communities to CSCL scriptsdavinia.hl
Open Seminar at the University of Oulu, 4th Dec. 2018
http://www.oulu.fi/koulutusteknologia/node/56057
Learning design and data analytics: from teacher communities to computer-supported collaborative learning scripts
Presenter: Davinia Hernández-Leo, Associate Professor, Information and Communication Technologies Department, University Pompeu Fabra, Barcelona
Brief description: I will present an overview of the educational technologies research conducted by the TIDE research group of the Information and Communication Technologies Department at Universitat Pompeu Fabra in Barcelona (http://www.upf.edu/web/tide @TIDE_UPF). The overview will be articulated around the perspective, central to TIDE work, of supporting teachers and teacher communities (e.g a school) in the design of the best possible (technology-enhanced) learning activities considering their students and their contexts. Main research contributions that will be presented include a community platform for integrated learning design (ILDE, including multiple authoring tools e.g. edCrumble), scalable and flexible orchestration of computer-supported collaborative learning scripts (PyramidApp), and the use of data analytics at different levels (learning, design, community) to support teachers in learning (re)design. The presentation will include results of European, Spanish and Catalan projects (METIS, RESET, CoT) and our initial work in recently started projects (SmartLET, Illuminated).
Hernández-Leo, D., et al. (available online) Analytics for learning design: A layered framework and tools, British Journal of Educational Technology. https://doi.org/10.1111/bjet.12645
Hernández-Leo, D., et al. (2018). An Integrated Environment for Learning Design. Frontiers in ICT, 5, 9. doi: 10.3389/fict.2018.00009
Michos, K., Hernández-Leo, D., (2018) Supporting awareness in communities of learning design practice, Computers in Human Behavior, 85, 255-270. https://doi.org/10.1016/j.chb.2018.04.008
Michos, K., & Hernández-Leo, D., Albó, L. (2018). Teacher-led inquiry in technology-supported school communities. British Journal of Educational Technology 49(6), 1077-1095. https://doi.org/10.1111/bjet.12696.
Manathunga, K., Hernández-Leo, D., (2018), Authoring and enactment ofmobile pyramid-based collaborative learning activities, British Journal ofEducational Technology, 49(2),262–275,doi:10.1111/bjet.12588
Albo L, Hernández-Leo D. edCrumble: designing for learning with data analytics. Proceedings of the 13th European Conference on Technology-Enhanced Learning (EC-TEL 2018); 2018 Sep 3-6; Leeds, UK, 605-609.
Computers in Human Behavior xxx (2012) xxx–xxxContents lists.docxpatricke8
Computers in Human Behavior xxx (2012) xxx–xxx
Contents lists available at SciVerse ScienceDirect
Computers in Human Behavior
j o u r n a l h o m e p a g e : w w w . e l s e v i e r . c o m / l o c a t e / c o m p h u m b e h
Critical thinking in E-learning environments
Raafat George Saadé a,⇑, Danielle Morin a,1, Jennifer D.E. Thomas b,2
a Concordia University, John Molson School of Business, Montreal, Quebec, Canada
b Pace University, Ivan Seidenberg School of CSIS, New York, NY, USA
a r t i c l e i n f o
Article history:
Available online xxxx
Keywords:
E-learning
Critical thinking
Assessment
Information technology
0747-5632/$ - see front matter � 2012 Elsevier Ltd. A
http://dx.doi.org/10.1016/j.chb.2012.03.025
⇑ Corresponding author. Tel.: +1 514 848 2424; fax
E-mail address: [email protected] (R.G. Sa
1 Tel.: +1 514 848 2424; fax: +1 514 848 2824.
2 Tel.: +1 212 346 1569; fax: +1 212 346 1863.
Please cite this article in press as: Saadé, R. G., e
10.1016/j.chb.2012.03.025
a b s t r a c t
One of the primary aims of higher education in today’s information technology enabled classroom is to
make students more active in the learning process. The intended outcome of this increased IT-facilitated
student engagement is to foster important skills such as critical thinking used in both academia and
workplace environments. Critical thinking (CT) skills entails the ability(ies) of mental processes of discern-
ment, analysis and evaluation to achieve a logical understanding. Critical thinking in the classroom as well
as in the workplace is a central theme; however, with the dramatic increase of IT usage the mechanisms by
which critical thinking is fostered and used has changed. This article presents the work and results of
critical thinking in a virtual learning environment. We therefore present a web-based course and we
assess in which parts of the course, and to what extent, critical thinking was perceived to occur. The course
contained two categories of learning modules namely resources and interactive components. Critical
thinking was measured subjectively using the ART scale. Results indicate the significance of ‘‘interactivity’’
in what students perceived to be critical-thinking-oriented versus online material as a resource. Results
and opportunities that virtual environments present to foster critical thinking are discussed.
� 2012 Elsevier Ltd. All rights reserved.
1. Introduction
One of the primary aims of higher education in today’s informa-
tion technology (IT) enabled classroom, is to make students more
active in the learning process (Ibrahim & Samsa, 2009). The in-
tended outcome of this increased IT-facilitated student engage-
ment is to foster important skills such as critical thinking. Given
the importance of information technology for critical thinking in
learning, it is vital that we understand better the associated key
factors related to: background of students, beliefs, perceptions
and attitudes and associated anteceden.
Educational research and innovation:
the case of technology integration
I am currently working as a researcher at Ghent University (Belgium) where I have been member of the Department of Educational Studies since 2003. My research interests are in the field of instructional design and educational innovation. Most of my work focuses on ICT integration in teaching and learning processes and how this can be associated with teacher and school characteristics. This encompasses the idea that innovations should be situated within the wider
field of school improvement. In more recent work, I am especially interested in exploring the interplay between (ICT) innovations and professional development. Also in this area I investigate themes at the individual level, e.g. educational beliefs, and at school level, e.g. leadership. You can find more information on my Academia profile: http://ugent.academia.edu/JoTondeur
During the presentation I will focus on the multidimensional interaction of both teacher and school characteristics in developing a richer understanding of the complex process of technology use in education. Differential types of technology use will be considered and how they are related to variables such as teacher attitudes, educational beliefs, and school policies. Moreover I would also like to discuss the interplay between pre/in-service training and ICT-integration in education.
Organised by the Institute of Education and Society (InES)
For further information please contact Post-doc Research associate: frederik.herman @uni.lu
Edutech_Europe Keynote Presentation: Implementing learning analytics and lear...Bart Rienties
This keynote will help you:
-Understand where to start with learning analytics
-Understand how to effectively support your staff to use data
-Critically review whether learning analytics is something for your organisation
https://www.terrapinn.com/exhibition/edutech-europe/speaker-bart-RIENTIES.stm
A content analysis of the emerging research on academic cyberloafingZizo Aku
Despite the diverse opportunities digital technologies offer that enhance learning and improve instructional practice, the main challenge faced by many institutions is the distracting effects of hyper-connectivity caused by mobile devices during learning activities. Some students find it difficult to balance online leisure activity with school work because of the guilty pleasures associated with using certain types of media. The failure of college students to reduce distractions from academic cyberloafing could negatively impact their achievement of academic success. This scholarly paper is designed to explore how contemporary research has investigated this emerging phenomenon to better understand important strategies for control.
Data Mining Application in Advertisement Management of Higher Educational Ins...ijcax
In recent years, Indian higher educational institute’s competition grows rapidly for attracting students to
get enrollment in their institutes. To attract students educational institutes select a best advertisement
method. There are different advertisements available in the market but a selection of them is very difficult
for institutes. This paper is helpful for institutes to select a best advertisement medium using some data
mining methods.
Similar to Presentation pick a card - newman 17-04-13 - final (20)
3. Relevance
“We need to bring
computational thinking
into our schools.”
(DfE, 2013a)
“Computational thinking is a fundamental
skill for everyone, not just for computer
scientists. To reading, writing and
arithmetic, we should add computational
thinking to every child’s analytical ability.“
(Jeannette Wing, 2006)
“…change the world through
computational thinking.”
(DfE, 2013b)
5. What is Card Sorting?
• Qualitative participatory
design technique, used to
explore how participants
group items together into
categories and relate concepts
to one another (Martin &
Hanington, 2012)
• Tool to determine
participant’s mental model of
grouping items (Ross, 2011)
• Generative method (Nielsen,
2004) using open card sort
• Evaluative method (Ross,
2011) using closed card sort
• Generate a category tree or
folksonomy
6. Approach – Card Sorting
Advantages Disadvantages
Simple Content-Centric technique
Cheap Results may vary
Quick to Execute Analysis – time consuming
Established May capture “surface”
characteristics only
Involves users
Provides a good foundation
(Source: Spencer & Warfel, 2004)
7. Design/Methodology/Approach
Card Selection
• 104 Computational Thinking
related cards identified
following desk based
literature review
Recommended Time
• Allow 30 minutes for each
multiple of 50 cards (Martin
& Hanington, 2012)
Recommended Sample Size
• Between 15 (Nielsen, 2004)
and 30 (Tullis & Wood, 2004)
provides a correlation
between 0.90 and 0.95
respectively
8. Design/Methodology/Approach
Card Selection
• 104 Computational Thinking
related cards identified
following desk based
literature review
Recommended Time
• Allow 30 minutes for each
multiple of 50 cards (Martin
& Hanington, 2012)
Recommended Sample Size
• Between 15 (Nielsen, 2004)
and 30 (Tullis & Wood, 2004)
provides a correlation
between 0.90 and 0.95
respectively
10. Analysis of Data
Process
Know
Your Data
Focus the
Analysis
Categorize
Information
Identify
Patterns
Interpretation
(Source: Taylor-Powell & Renner, 2010)
• Identify
themes
• Organize
them into
coherent
emergent
categories
• Larger
categories
• Relative
importance
• Relationships
11. Analysis of Data
K-Mean Analysis
How often a card is placed in a category
Single-linked dendrogram
16. References
Berg, E., A. (1948) A Simple Objective Technique for Measuring Flexibility in Thinking. The Journal of General
Psychology. 39(52) pp.15-22.
Coxon, A. and MacMillan, P. (1999) Sorting Data: Collection and Analysis. Thousand Oaks, CA: Sage Publications.
Department for Education (2013a) Computer Science to be included in the EBacc [Online]. Available at:
http://www.education.gov.uk/inthenews/inthenews/a00221085/ebacccompsci (Accessed: 15 April 2013).
Department for Education (2013b) Computing Programmes of study for key stages 1-4 [Online]. Available at:
http://media.education.gov.uk/assets/files/pdf/c/computing%2004-02-13_001.pdf (Accessed: 15 April 2013).
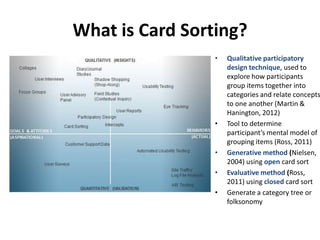
Martin, B. and Hanington, B. (2012) 100 ways to Research Complex Problems, Develop Innovative Ideas and
Design Effective Solutions. Beverley, MA: Rockport Publications, pp.26-27.
Nawaz, A. (2012). A Comparison of Card-sorting Analysis Methods. The 10th Asia Pacific Conference on Computer
Human Interaction (APCHI2012).
Nielsen, J. (2004) Card Sorting How Many Users to Test? [Online]. Available at:
http://www.nngroup.com/articles/card-sorting-how-many-users-to-test/ (Accessed: 15 April 2013).
Nielsen, J. (1995) Usability Testing for the 1995 Sun Microsystems' Website. [Online]. Available at:
http://www.nngroup.com/articles/card-sorting-how-many-users-to-test/ (Accessed: 15 April 2013).
Ross, J. (2011) Comparing User Research Methods for Information Architecture. [Online]. Available at:
http://home.comcast.net/~tomtullis/publications/UPA2004CardSorting.pdf (Accessed: 15 April 2013).
Spencer, D. (2009) Card Sorting: Designing Usable Categories. New York: Rosenfeld Media.
Spencer, D. and Warfel, T. (2004) Card sorting: A Definitive Guide. [Online]. Available at:
http://boxesandarrows.com/card-sorting-a-definitive-guide/ (Accessed: 15 April 2013).
Taylor-Powell, E. and Renner, M. (2010) Analyzing Qualitative Data. Madison: University of Winconsin. [Online].
Available at: http://learningstore.uwex.edu/assets/pdfs/g3658-12.pdf (Accessed: 15 April 2013).
Tullis, T. and Wood, L. (2004) How many users are enough for a card-sorting study? In Proceedings UPA'2004,
Minneapolis, MN. Available at: http://home.comcast.net/~tomtullis/publications/UPA2004CardSorting.pdf
(Accessed: 15 April 2013).
Wing, J.,M. (2006) Computation Thinking. Communication of the ACM. 49(3) pp. 33-35 [Online]. Available at:
http://www.cs.cmu.edu/afs/cs/usr/wing/www/publications/Wing06.pdf (Accessed: 15 April 2013).
17. References
Fincher, S. and Teneberg, J. (2005) Making sense of card sorting data. Expert Systems, 22(32), pp.89-93.
Hannah, S. (2005) Sorting Out Card Sorting: Comparing Methods for Information Architects, Usability Specialists
and Other Practitioners. Available at:
https://scholarsbank.uoregon.edu/xmlui/bitstream/handle/1794/7818/2005-hannah.pdf?sequence=1 (Accessed:
15 April 2013).
Packer, T., L., Boshoff, K. and DeJonge, D. (2008) Development of the Activity Card Sort — Australia. Australian
Occupational Therapy Journal, 55(3), pp.199-206.
Rugg, G. and McGeorge, P. (1997) The sorting techniques: a tutorial paper on card sorts, picture sorts and item
sorts. Expert Systems, 14(2).
Santos, G., J. (2006) Card sort technique as a qualitative substitute for quantitative exploratory factor analysis.
Corporate Communications: An International Journal, 11(3), pp.288 – 302.
Tetting, D. (1988) Q-Sort Update. Western Journal of Nursing Research, 10(6), pp.757-765.
Tullis, T. and Albert, B. (2008) Measuring the User Experience: Collecting, Analyzing and Presenting Usability
Metrics. New York: Elsevier: Morgan Kaufmann.
Editor's Notes
folksonomy is a system of classification derived from the practice and method of collaboratively creating and managing tags to annotate and categorizecontent this practice is also known as collaborative tagging,[3]social classification, social indexing, and social tagging. Folksonomy, a term coined by Thomas Vander Wal,
AdvantagesSimple – Card sorts are easy for the organizer and the participants. Cheap – Typically the cost is a stack of 3×5 index cards, sticky notes, a pen or printing labels, and your time. Quick to execute – You can perform several sorts in a short period of time, which provides you with a significant amount of data.Established – The technique has been used for over 10 years, by many designers. Involves users – Because the information structure suggested by a card sort is based on real user input, not the gut feeling or strong opinions of a designer, information architect, or key stakeholder, it should be easier to use. Provides a good foundation – It’s not a silver bullet, but it does provide a good foundation for the structure of a site or product.DisadvantagesDoes not consider users’ tasks – Card sorting is an inherently content-centric technique. If used without considering users’ tasks, it may lead to an information structure that is not usable when users are attempting real tasks. An information needs analysis or task analysis is necessary to ensure that the content being sorted meets user needs and that the resulting information structure allows users to achieve tasks.Results may vary –The card sort may provide fairly consistent results between participants, or may vary widely. Analysis can be time consuming – The sorting is quick, but the analysis of the data can be difficult and time consuming, particularly if there is little consistency between participants.May capture “surface” characteristics only – Participants may not consider what the content is about or how they would use it to complete a task and may just sort it by surface characteristics such as document types.