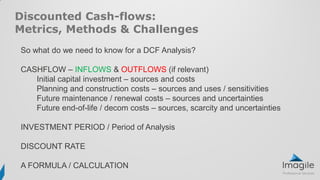
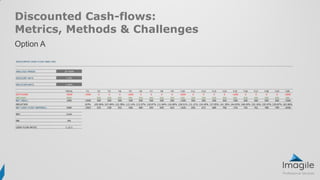
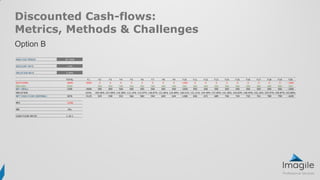
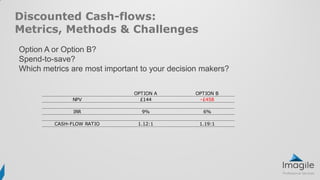
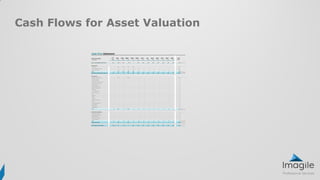
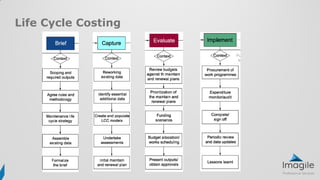
This document discusses the importance of financial modeling and lifecycle planning for asset management decision making. It emphasizes talking to senior management about value in terms of outcomes rather than specific assets or initiatives. The document outlines how to understand and express value, asset valuation using cash flows, financial modeling, lifecycle costing, and discounted cash flow analysis. It provides an example comparing two options using metrics like net present value, internal rate of return, and cash flow ratio to determine which option provides the best value.


![“The word value… has two different meanings, [it] sometimes
expresses the utility of [something], and sometimes [the purchasing
power of it]. The one may be called "value in use;" the other, "value in
exchange." Adam Smith “Of the Origin and Use of Money”
We’re first going to need to understand what we mean by “Value”
“The regard that something is held to deserve, the importance, worth
or usefulness of something.” Oxford English Dictionary
“The total amount of money for which something can be exchanged in
a market” CIMA Dictionary of Finance and Accounting
Value](https://image.slidesharecdn.com/lukebody-170731141925/85/Stream-C_Luke-Body-5-320.jpg)
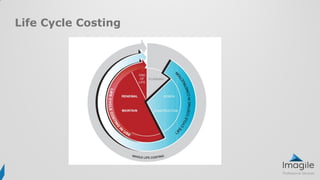
![Life Cycle Costing is “[the] methodology for the systematic economic
evaluation of life cycle costs over a period of analysis, as defined in the
agreed scope. Life Cycle Costing can address a period of analysis that
covers the entire life cycle or (a) selected stage(s) or periods of interest
thereof.”
ISO 15686-5:2008, 3.1.8
Life Cycle Costing](https://image.slidesharecdn.com/lukebody-170731141925/85/Stream-C_Luke-Body-15-320.jpg)
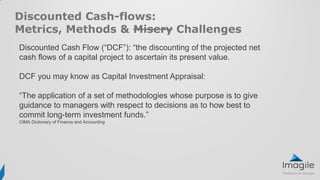
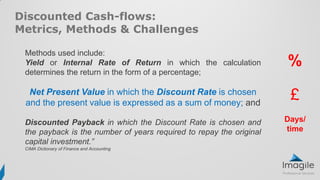
![Discounted Cash-flows:
Metrics, Methods & Challenges
TIME VALUE OF MONEY
“Measurement of the difference between future monies and the present
day value of monies [reflecting uncertainty]” BS 8544-2013
DISCOUNT RATES
Inflation
Weighted Average Cost of Capital
Expected / target returns (IRR*)
Risk appetite / premium](https://image.slidesharecdn.com/lukebody-170731141925/85/Stream-C_Luke-Body-20-320.jpg)