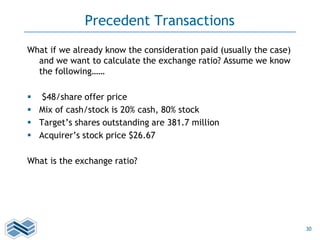
Okay, let's break this down step-by-step:
* Offer price per share is $48
* Mix is 20% cash, 80% stock
* To calculate the exchange ratio, we take the stock portion as a percentage of the total consideration
* Stock portion is 80% of $48, which is 0.8 * $48 = $38.40
* Cash portion is 20% of $48, which is 0.2 * $48 = $9.60
* Total consideration is $38.40 stock + $9.60 cash = $48
* To get the exchange ratio, we take the stock portion ($38.40) and divide it by the acquirer's stock price.
Company Valuation PowerPoint Presentation Slides SlideTeam
Get ready-made Company Valuation PowerPoint Presentation Slides to analyse all the profit and net value your business has made. Conduct a thorough evaluation of a company’s management, capital structure, future earning prospects, and more with the help of professionally designed company valuation PPT presentation templates. Determine the current worth of a business and assess all aspects of a business. This deck comprises of several company valuation PowerPoint templates like valuation methodology, valuation steps, company valuation methodologies, determining free cash flow, valuation results, business due-diligence process, strategic due-diligence methodology, and more. Incorporate business valuation PowerPoint slideshow to estimate the selling price of the business. Use business valuation methods PowerPoint techniques for valuing a business asset such as cost approach, cost to build, replacement cost, market approach, discounted cash flow, forecast future cash flow, etc. Grab access to the company valuation complete PowerPoint deck for a business analysis. Employ a few jocular expressions with our Company Valuation Powerpoint Presentation Slides. It helps insert a bit of humor.
Introduction to Business Valuation, Fair Market Value, reasons and elements of business valuation, methodologies of business valuation, case study on net asset value.
Business Valuation PowerPoint Presentation SlidesSlideTeam
Presenting this set of slides with name - Business Valuation PowerPoint Presentation Slides. The stages in this process are Business Valuation, Financial Analysis, Economic Valuation.
Mr. Chander Sawhney, Partner & Head – Valuation & Deals, Corporate Professionals shared his thoughts as a guest Speaker on Relative Valuation - Techniques & Application at a Business Valuation Masterclass organised by VC Circle on 31st August, 2016.
Relative Valuation in which value of an asset or liability is done by comparing it to its Peers is pervasive and preferred for ascertaining Fair Value at a point of time as it reflects the market positioning of the Industry and Peers at that time. While Discounted Cash Flow (DCF) method is applied for arriving at Fundamental Valuation, most M&A transaction are based on Relative Valuation multiples (mostly Earnings based). The valuation ratio typically expresses the valuation as a function of a measure of Key Financial Metrics like PE, EV/EBITDA, EV/Sales or Book Value Multiple.
But before using a multiple, one should know the fundamentals determining the multiple and how changes impact it. Sanity check through use of fundamental valuation method like DCF is strongly recommended.
About Corporate Professionals Valuation Practice
Corporate Professionals Capital Pvt. Ltd. is a SEBI Registered (Cat-1) Merchant Banker and has a successful track record of providing a broad range of M&A and Transaction Advisory Services. Our Dedicated Team has more than 10 years of rich Valuation experience and we have executed more than 500 Corporate Valuations for clients of International Repute across different Context, Industries and Boundaries.
To know more about Our Valuation offerings and how we can help you, please visit us at www.corporatevaluations.in or download our Valuation profile @ http://www.corporatevaluations.in/VALUATION_PROFILE.pdf
Corporate Valuations “Techniques & Application”: A compilation of research oriented valuation articles.
Contents: Business valuation, Relative valuation, Sum of the parts valuation and value creation, ESOP valuation, Discounted Cash Flow Valuation, Enterprise Valuation etc.
This PPT covers all the important ratios which are necessary in financial analysis of a business enterprise.
Whether you are starting your career i commerce and business or you a working profession these ratios will always help you to properly analsyse a company and draw relevant conclusions The main ratios covered are:
Liquidity Ratios
Leverage Ratios
Efficiency Ratios
Profitability Ratios
Market Value Ratios
Using the premier business computational tool to maximize wealth. Excel is used to make the two decisions related to wealth maximization: 1. the investment decision 2. the financing decision
Icai national seminar m&a-deal valuationAnjana Vivek
Some pointers on Deal Valuation which is beyond numbers, including some questions 'to trigger thinking' related to valuation from a buyer/seller perspective
DegreeLinked
Challenge & Opportunity: Applying to undergraduate and graduate school is a time-consuming and tedious task. It requires first selecting the right school and then filling out numerous applications including different essays. 75% of prospective students say that they would have applied to more schools if the admissions process were less tedious and time-consuming. DegreeLinked simplifies the university admissions process by standardizing and consolidating it into one singular platform. Connect directly with university admissions representatives, share academic performance and write one application used for all target universities at www.DegreeLinked.com
Key Question: How to Connect Students with University Admissions & Employment Opportunities?
DegreeLinked Methodology:
Provide a networking platform that connects former, current and prospective students with university admissions and employment opportunities. The student marketplace allows universities to run the admissions process through the platform and students get to make one application for all target universities.
ACG Cup 2nd round case competition final presentationliujingyi
I stood for Univeristy of Texas at Dallas to compete in the ACG Cup case competition in Feb, 2011. The case is about offering LBO advisory to a PE firm as a investment banker. Here is the slides our group used in the final round. Finally, we were placed the second.
#Financial Modeling: Growing needs of financial modeling skills in financial ...13 Llama Interactive
About EduPristine
Trusted by Fortune 500 Companies and 10,000 Students from 40+ countries across the globe, EduPristine is one of the leading Training providers for Finance Certifications like CFA, PRM, FRM, Financial Modeling, Business Analytics etc. EduPristine holds a profound history in training Risk Professionals across the globe. It has been an International Authorized Training provider for FRM & PRM trainings since past 4 years and has helped 250+ FRM aspirants clear the Exam. It is Registered with GARP & CFA Institute as an Approved Provider of Continuing Professional Education (CPE) credits.
http://www.edupristine.com/ca
The Master in Corporate Finance is a 100 % finance-focused program in English, designed to provide the most sophisticated techniques and tools of Financial Management
Explain the various categories of ratio analysis and provide example.pdfarchanenterprises
Explain the various categories of ratio analysis and provide examples of at least two ratios in
each category. If you were an investor, which category would you be most interested in? Why?
Solution
Part-1
Ratios are used by lenders and business analysts to determine a company\'s financial stability and
standing.It\'s important to understand that financial ratios are time sensitive; they can only show
a picture of a business at a given time. There are five catagories of Financial ratios and those are
as follows :
Part-2 :
There are a large variety of ratios out there, but for an investor using financial ratios which are
broken up into four major categories: profitability ratios, liquidity ratios, solvency ratios and
valuation ratios. As an investor he should consider Profitability ratio because Profitability ratio is
a key piece of information that should be analyzed when you\'re considering investing in a
company. This is because high revenues alone don\'t necessarily translate into dividends for
investors unless a company is able to clear all of its expenses and costs. In general, the higher a
company\'s profit margin, the better, but as with most ratios, it is not enough to look at it in
isolation. It is important to compare it to the company\'s past levels, to the market average and to
its competitors.
Profitability Ratios : The profitability ratios are just what the name implies. They focus on the
firm\'s ability to generate a profit and an adequate return on assets and equity. They measure how
efficiently the firm uses its assets and how effectively it manages its operations and answers
questions like how efficiency his business and it helps to compare with other competitor.
Examples of Proftitablity ratios are Gross profit ratio, Net profit ratio, Operating profit ratio and
Return on investment ratio.
Market Value Ratios : The market value ratios can be calculated for publicly traded companies
only as they relate to stock price. There are many market value ratios, but a few of the most
commonly used are price/earnings (P/E), book value to share value and dividend yield .
LEVERAGE RATIO /Capital Structure ration : The term capital structure refers to the
relationship between various long term forms of financing such as debentures (long term),
preference share capital and equity share capital including reserves and surpluses. Leverage or
capital structure ratios are calculated to test the long term financial position of a firm. Generally
capital gearing ratio is mainly calculated to analyse the leverage or capital structure of the firm.
Example of ratios are total debt ratios, the debt/equity ratio, the long-term debt ratio, the times
interest earned ratio, the fixed charge coverage ratio, and the cash coverage ratio.
Asset Efficiency or Turnover Ratios : The asset efficiency or turnover ratios measure the
efficiency with which the firm uses its assets to produce sales. As a result, it focuses on both the
income statement (sales) and the .
IB Business and Management (Standard Level)
All material taken from the IB Business and Management Textbook:
"Business and Management", Paul Hoang, IBID Press, Victoria, 2007
Fundamental Analysis by Vivek SrivastavaAxis Direct
Fundamental Analysis is a study of factors (company specific and external environment) that affect the value of stock. This program will help you to understand the impact of factors on the valuation of the stock, analysis of the environment and interpretation of financial statement.
For more information visit : https://simplehai.axisdirect.in/learn/eclasses
1. Read the information on the STREAMING VIDEO INDUSTRY and apply .docxjeremylockett77
1. Read the information on the STREAMING VIDEO INDUSTRY and apply the elements of PESTEL analysis, PORTER analysis, and STRATEGIC GROUPS analysis.
a. What are the strategically relevant components of the streaming video industry macro-environment? What is the impact of these macro factors on the growth and competitiveness of the industry.
b. Work through each of the vertical and horizontal forces in the Porter model and draw conclusions about rivalry and industry competition. Which of the five competitive forces is strongest? Which is weakest? What competitive forces seem to have the greatest effect on industry attractiveness and the potential profitability of new entrants?
2. Read the information on the impact of the coronavirus and apply the elements of macro environmental and industry level analysis to understand how it impacts the industry forces (PORTER model) for two industries. Go through the forces model, then draw conclusion about whether this will increase or decrease competitiveness and attractiveness in this industry
3. Read the information on Tesla (attached documents). In one reading, Tesla is called either a disrupter or a sustaining innovator. This article also suggests that Tesla maybe a Blue Ocean or a Red Ocean (more traditional strategy) company. How do you interpret Tesla’s strategy? Use information from the articles, the most recent earnings presentation, and your evaluation of company financial performance in supporting your answer.
Red Ocean StrategyBlue Ocean Strategy
Compete in existing market space
Create uncontested market space.
Beat the competition
Make the competition irrelevant
Exploit existing demand
Create and capture new demand
Make the value-cost trade-off
Break the value-cost trade-off
Align the whole system of a firms activities with its strategic choice of differentiation or low cost
Align the whole system of a firms activities in pursuit of differentiation and low cost
Working Capital Management
Chapter 15
Working Capital Terminology
Working capital: current assets.
Net working capital:
current assets - current liabilities.
Net operating working capital:
current assets - (current liabilities - notes payable).
Working capital management:
controlling cash, inventories, and A/R, plus short-term liability management.
2
Working Capital Financing Policies
Aggressive: Use short-term financing to finance permanent assets.
Moderate: Match the maturity of the assets with the maturity of the financing.
Maturity Matching, or “Self-Liquidating”, approach
Conservative: Use permanent capital for permanent assets and temporary assets.
3
Cash Conversion Cycle
The cash conversion cycle focuses on the length of time between when a company makes payments to its creditors and when a company receives payments from its customers.
4
Cash Conversion Cycle
15-5
5
Cash Budget
Forecasts cash inflows, outflows, and ending cash balances.
Used to plan loans needed or fun ...
EBITDA and Other Scary Words (Series: MBA Boot Camp 2020) Financial Poise
This webinar explores the ins and outs of financial language and how you can navigate the seeming labyrinth of a language that can sound foreign and in some ways counterintuitive. This webinar teaches the correct use of EBIT, EBITDA and EBITDAR while also dealing with concepts like Cap Rate vs. Capital Cost. This webinar also sheds light on issues with ROI and Payback among other valuation tools and explains what a Cash Conversion Cycle looks like for your business.
To listen to this webinar on demand, go to: https://www.financialpoise.com/financial-poise-webinars/ebitda-and-other-scary-words-2020/
EBITDA and Other Scary Words (Series: MBA Boot Camp)Financial Poise
This webinar explores the ins and outs of financial language and how you can navigate the seeming labyrinth of a language that can sound foreign and in some ways counterintuitive. This webinar teaches the correct use of EBIT, EBITDA and EBITDAR while also dealing with concepts like Cap Rate vs. Capital Cost. This webinar also sheds light on issues with ROI and Payback among other valuation tools and explains what a Cash Conversion Cycle looks like for your business.
To view the accompanying webinar, go to:https://www.financialpoise.com/financial-poise-webinars/ebitda-and-other-scary-words-2021/
Business Valuation Principles for EntrepreneursBen Wann
This insightful presentation is designed to equip entrepreneurs with the essential knowledge and tools needed to accurately value their businesses. Understanding business valuation is crucial for making informed decisions, whether you're seeking investment, planning to sell, or simply want to gauge your company's worth.
Remote sensing and monitoring are changing the mining industry for the better. These are providing innovative solutions to long-standing challenges. Those related to exploration, extraction, and overall environmental management by mining technology companies Odisha. These technologies make use of satellite imaging, aerial photography and sensors to collect data that might be inaccessible or from hazardous locations. With the use of this technology, mining operations are becoming increasingly efficient. Let us gain more insight into the key aspects associated with remote sensing and monitoring when it comes to mining.
[Note: This is a partial preview. To download this presentation, visit:
https://www.oeconsulting.com.sg/training-presentations]
Sustainability has become an increasingly critical topic as the world recognizes the need to protect our planet and its resources for future generations. Sustainability means meeting our current needs without compromising the ability of future generations to meet theirs. It involves long-term planning and consideration of the consequences of our actions. The goal is to create strategies that ensure the long-term viability of People, Planet, and Profit.
Leading companies such as Nike, Toyota, and Siemens are prioritizing sustainable innovation in their business models, setting an example for others to follow. In this Sustainability training presentation, you will learn key concepts, principles, and practices of sustainability applicable across industries. This training aims to create awareness and educate employees, senior executives, consultants, and other key stakeholders, including investors, policymakers, and supply chain partners, on the importance and implementation of sustainability.
LEARNING OBJECTIVES
1. Develop a comprehensive understanding of the fundamental principles and concepts that form the foundation of sustainability within corporate environments.
2. Explore the sustainability implementation model, focusing on effective measures and reporting strategies to track and communicate sustainability efforts.
3. Identify and define best practices and critical success factors essential for achieving sustainability goals within organizations.
CONTENTS
1. Introduction and Key Concepts of Sustainability
2. Principles and Practices of Sustainability
3. Measures and Reporting in Sustainability
4. Sustainability Implementation & Best Practices
To download the complete presentation, visit: https://www.oeconsulting.com.sg/training-presentations
Attending a job Interview for B1 and B2 Englsih learnersErika906060
It is a sample of an interview for a business english class for pre-intermediate and intermediate english students with emphasis on the speking ability.
Accpac to QuickBooks Conversion Navigating the Transition with Online Account...PaulBryant58
This article provides a comprehensive guide on how to
effectively manage the convert Accpac to QuickBooks , with a particular focus on utilizing online accounting services to streamline the process.
Memorandum Of Association Constitution of Company.pptseri bangash
www.seribangash.com
A Memorandum of Association (MOA) is a legal document that outlines the fundamental principles and objectives upon which a company operates. It serves as the company's charter or constitution and defines the scope of its activities. Here's a detailed note on the MOA:
Contents of Memorandum of Association:
Name Clause: This clause states the name of the company, which should end with words like "Limited" or "Ltd." for a public limited company and "Private Limited" or "Pvt. Ltd." for a private limited company.
https://seribangash.com/article-of-association-is-legal-doc-of-company/
Registered Office Clause: It specifies the location where the company's registered office is situated. This office is where all official communications and notices are sent.
Objective Clause: This clause delineates the main objectives for which the company is formed. It's important to define these objectives clearly, as the company cannot undertake activities beyond those mentioned in this clause.
www.seribangash.com
Liability Clause: It outlines the extent of liability of the company's members. In the case of companies limited by shares, the liability of members is limited to the amount unpaid on their shares. For companies limited by guarantee, members' liability is limited to the amount they undertake to contribute if the company is wound up.
https://seribangash.com/promotors-is-person-conceived-formation-company/
Capital Clause: This clause specifies the authorized capital of the company, i.e., the maximum amount of share capital the company is authorized to issue. It also mentions the division of this capital into shares and their respective nominal value.
Association Clause: It simply states that the subscribers wish to form a company and agree to become members of it, in accordance with the terms of the MOA.
Importance of Memorandum of Association:
Legal Requirement: The MOA is a legal requirement for the formation of a company. It must be filed with the Registrar of Companies during the incorporation process.
Constitutional Document: It serves as the company's constitutional document, defining its scope, powers, and limitations.
Protection of Members: It protects the interests of the company's members by clearly defining the objectives and limiting their liability.
External Communication: It provides clarity to external parties, such as investors, creditors, and regulatory authorities, regarding the company's objectives and powers.
https://seribangash.com/difference-public-and-private-company-law/
Binding Authority: The company and its members are bound by the provisions of the MOA. Any action taken beyond its scope may be considered ultra vires (beyond the powers) of the company and therefore void.
Amendment of MOA:
While the MOA lays down the company's fundamental principles, it is not entirely immutable. It can be amended, but only under specific circumstances and in compliance with legal procedures. Amendments typically require shareholder
India Orthopedic Devices Market: Unlocking Growth Secrets, Trends and Develop...Kumar Satyam
According to TechSci Research report, “India Orthopedic Devices Market -Industry Size, Share, Trends, Competition Forecast & Opportunities, 2030”, the India Orthopedic Devices Market stood at USD 1,280.54 Million in 2024 and is anticipated to grow with a CAGR of 7.84% in the forecast period, 2026-2030F. The India Orthopedic Devices Market is being driven by several factors. The most prominent ones include an increase in the elderly population, who are more prone to orthopedic conditions such as osteoporosis and arthritis. Moreover, the rise in sports injuries and road accidents are also contributing to the demand for orthopedic devices. Advances in technology and the introduction of innovative implants and prosthetics have further propelled the market growth. Additionally, government initiatives aimed at improving healthcare infrastructure and the increasing prevalence of lifestyle diseases have led to an upward trend in orthopedic surgeries, thereby fueling the market demand for these devices.
3.0 Project 2_ Developing My Brand Identity Kit.pptxtanyjahb
A personal brand exploration presentation summarizes an individual's unique qualities and goals, covering strengths, values, passions, and target audience. It helps individuals understand what makes them stand out, their desired image, and how they aim to achieve it.
Personal Brand Statement:
As an Army veteran dedicated to lifelong learning, I bring a disciplined, strategic mindset to my pursuits. I am constantly expanding my knowledge to innovate and lead effectively. My journey is driven by a commitment to excellence, and to make a meaningful impact in the world.
Improving profitability for small businessBen Wann
In this comprehensive presentation, we will explore strategies and practical tips for enhancing profitability in small businesses. Tailored to meet the unique challenges faced by small enterprises, this session covers various aspects that directly impact the bottom line. Attendees will learn how to optimize operational efficiency, manage expenses, and increase revenue through innovative marketing and customer engagement techniques.
Affordable Stationery Printing Services in Jaipur | Navpack n PrintNavpack & Print
Looking for professional printing services in Jaipur? Navpack n Print offers high-quality and affordable stationery printing for all your business needs. Stand out with custom stationery designs and fast turnaround times. Contact us today for a quote!
Explore our most comprehensive guide on lookback analysis at SafePaaS, covering access governance and how it can transform modern ERP audits. Browse now!
Cracking the Workplace Discipline Code Main.pptxWorkforce Group
Cultivating and maintaining discipline within teams is a critical differentiator for successful organisations.
Forward-thinking leaders and business managers understand the impact that discipline has on organisational success. A disciplined workforce operates with clarity, focus, and a shared understanding of expectations, ultimately driving better results, optimising productivity, and facilitating seamless collaboration.
Although discipline is not a one-size-fits-all approach, it can help create a work environment that encourages personal growth and accountability rather than solely relying on punitive measures.
In this deck, you will learn the significance of workplace discipline for organisational success. You’ll also learn
• Four (4) workplace discipline methods you should consider
• The best and most practical approach to implementing workplace discipline.
• Three (3) key tips to maintain a disciplined workplace.
Taurus Zodiac Sign_ Personality Traits and Sign Dates.pptxmy Pandit
Explore the world of the Taurus zodiac sign. Learn about their stability, determination, and appreciation for beauty. Discover how Taureans' grounded nature and hardworking mindset define their unique personality.
2. 2
Table of Contents
I. Valuation Overview
II. Comparable Public Companies
III. Precedent Transactions
IV. Discounted Cash Flow (DCF) Analysis
V. Conclusions
3. 3
How Do We Value Companies?
The valuation methodologies we will learn are largely practiced by all
types of investors, but there are some differences in practice
Types of investors are: strategic buyers (M&A), active buyers (LBO,
venture capital), and passive buyers (mutual funds, hedge funds)
Which of the following buyers would be willing to pay the highest
price for shares of a company?.....
A mutual fund seeking to acquire a 1% position
A competitor of that company seeking to buy the whole company, after
identifying significant synergies such as cross-selling into its customer
base and utilizing the target’s manufacturing facilities which have only
50% capacity utilization
An LBO firm seeking to buy the whole company by taking out a bank loan
for 70% of the purchase price, assume an active role in management,
achieve better operational efficiency, then sell it in five years
4. 4
How Do We Value Companies?
There is the “public market valuation” which is the market cap. But is
it a fair valuation? Competent investors perform their own valuation
calculation. Has the valuation been hyped or beaten down too much?
A major variable in public valuations is the expected growth rate in
the future, and the crowd can be wrong.
Both publicly traded and private companies are valued by the same
methodologies, unless the investment is a strategic one. In that case,
synergies are included in the valuation.
There are three methodologies for valuing companies:
“Comparable public companies” (comparing all peers’ valuations as
multiples to financial results, such as the PE multiple, viewed in the
context of growth and operating efficiency)
“Precedent transactions” (for M&A- at which multiples were peers
acquired in the past? Should our client get a similar price to the last
deal?)
“Discounted cash flow” (DCF)
5. 5
How Do We Value Companies?
To value companies, we need to start with the following data:
Historical income statement (at least the last 5 years)
Historical balance sheet (at least the last 5 years)
Historical cash flow statement (at least the last 5 years)
How many years of data needed depends on how much things are
different today, or may be in the future, versus the past. If a cyclical
company, we want enough years to capture two up-cycles and down-
cycles. We also want financial results during the last recession and
boom.
We then make projections for each financial statement….based on
historical data and trends if there are any, and on what we expect
about the company’s and sector’s future. Do not assume the past is
entirely a guide to the future. Judgment is a big part of making
projections.
6. 6
Total Enterprise Value (TEV)
“Total enterprise value” accounts for debt and cash in the valuation.
Think of a real estate example…..
Home value = total enterprise value
Your equity = market cap
Your mortgage = debt
If you buy a home for $500K and take out a mortgage for $400K, your
equity is $100K
TEV = MVE + debt + preferred stock + minority
interest – cash
Institutional investors will sometimes simply use “EV” of market cap +
debt – cash, but the more accurate calculation is TEV. Many
companies don’t have preferred stock or much minority interest,
which is why many use the shorthand calculation.
7. 7
Total Enterprise Value (TEV)
Why is minority interest added to the calculation?
Minority interest is when a company owns more than 50% but
less than 100% of another company. FASB requires that you
consolidate the financials at and above the operating income
line, and include an offsetting “minority interest” line below
operating income representing the portion of financial results
you owe to whoever owns the other 1% - 49%.
The TEV/Revenue valuation multiple is what’s called an
“unlevered multiple”. The P/E is a “levered multiple” because
the “E” includes interest expense.
Since the minority interest revenue is consolidated in revenue
but not 100% owned, we add the minority interest to TEV for
the TEV/Revenue valuation multiple.
8. 8
Total Enterprise Value (TEV)
Why is cash subtracted from TEV?
If you had the chance to buy either of these two companies,
assuming all else were equal, same market cap, same EBITDA,
same profit margins, same growth rate, which would you buy?
Company A has $100 million in cash, no debt
Company B has $20 million in cash, no debt
Company A’s TEV will be lower, hence a lower TEV/EBITDA
valuation multiple. You pay the same for the equity of each
(same market cap), but you get more for your money with
company A because you get its cash.
9. 9
Table of Contents
I. Valuation Overview
II. Comparable Public Companies
III. Precedent Transactions
IV. Discounted Cash Flow (DCF) Analysis
V. Conclusions
10. 10
Comparable Public Companies
You can value a company based on how similar companies
(“comps”) trade in the public markets
The first step is to identify the “comp” universe (size depends
on relevance)
The goal is to find companies of similar…
Industries, Business Models, Profitability, Size, Growth, Geography
(International vs. Domestic)
Sources for finding comps include…..
Equity research reports, “Competitors” section from 10-K, SIC
codes, Internet, senior bankers
11. 11
Multiples Analysis
Multiples analysis is a form of “relative valuation”, we
compare many companies to each other based on valuation
multiples.
The most commonly used multiples are
TEV / EBITDA (a very important one)
TEV / Revenue
TEV / Unlevered Free Cash Flow
Market cap / Free Cash Flow
(Free Cash Flow = operating cash flow minus capital expenditures)
Stock Price per Share / Earnings per Share (the PE)
Any multiple based on TEV is called an operating multiple
(unlevered)
12. 12
Operating Multiples
Why is TEV multiple an operating multiple, and unlevered?
The TEV includes the leverage, yes, but the denominators do
not. They exclude interest expense (such as EBITDA). We do
not want to double count the debt factor.
When comparing many companies’ valuations, we use the TEV
not just to account for debt, but to give credit for the cash a
company has.
All denominators for TEV multiples are operating income and
higher on the income statement. Never use a TEV to net
income ratio, it double counts the debt because net income
includes interest expense.
13. 13
Operating Multiples
What if our client is a private company, how can we determine
its valuation based on multiples?
What if we know the following….
Revenue = $19 billion
EBITDA = $2 billion
Its peer group has a median “TEV / Revenue” of 0.74x and
median “TEV / EBITDA” of 10.3x
The “implied” TEV for our privately held client would be what?
14. 14
Equity Multiples
Unlike operating multiples (TEV), equity multiples are a
function of MVE (market cap). PE is the same as market cap /
net income.
Equity multiples use denominators that include interest
expense. Never use a simple Market Cap/EBITDA or Market
Cap/Revenue multiple
What are the flaws with PE ratios? What falls below the
operating income line that can make comparisons between
companies flawed?
15. 15
“Spreading Comps”
The term “spreading” comps comes from “spreadsheet”. It means
filling out financial data for all comparable companies to compare
ratios to each other.
Use the same time frame for each company. Include a “last twelve
months” column.
Remember that different companies have different fiscal year ends.
Line them up as closely as possible calendar-wise.
Add a line to normalize results, stripping out non-recurring items and
discontinued operations.
Include projections, which you may make yourself, or use estimates
from equity or credit research analysts. Many will start with other
analysts’ estimates, and then tweak them.
Remember that past performance is not always a guide to future
performance.
16. 16
“Spreading Comps”
Emphasize the TEV multiples in the comp sheet, and use fair
market value (“FMV”) for each component…..
MVE = market cap (“market value of equity”)
FMV of preferred = public market price
FMV of debt = use the balance sheet value, unless distressed use
market value
FMV of minority interest = use the balance sheet value
FMV of cash = use the balance sheet value
17. 17
“Spreading Comps”
Calculating Fully-Diluted Shares
Basic vs. Diluted Shares Outstanding
– Dilution is built into the stock price
– If dilutive securities are “in-the-money”, market assumes that they’re
already converted to common stock
– A convertible security or option is “in-the-money” if the current share
price is greater than the strike price
Dilutive Securities include….
– Employee Options (not traded on market), Warrants, Convertible
Preferred or Debt (do not double-count if already converted)
Market Cap and TEV should always be calculated using diluted
shares
– Using basic shares will undercut the valuation, sometimes significantly
– In certain industries where options are a large part of employee
compensation, the amount of dilutive shares can be sizeable
18. 18
“Spreading Comps”
Diluted shares as disclosed in company filings is by the
“Treasury Stock Method”. You will need to know how to
calculate this yourself, because when a company is acquired,
unvested stock options may become vested. Those unvested
options were not included in FD shares in prior filings.
Weighted-average diluted shares
Weighted for average balance over a time frame
Includes in-the-money warrants, options, convertibles
These are also called “common stock equivalents” (CSEs)
Used in the calculation of diluted EPS
May not equal the very latest amount of dilutive securities
19. 19
“Spreading Comps”
The Treasury Stock Method
Let’s say there are options for 50,000 shares and avg exercise price
of $50. When exercised, company receives cash of $2.5 mil.
Company then uses the $2.5 mil to buy as many shares on open
market to deliver. If stock price is $125, it can buy 20,000 shares.
It then has to come up with another 30,000 shares to meet obligation
of 50,000 shares. It issues those 30,000 shares, maybe out of treasury
stock.
The dilution is then 30,000 shares (not 50,000 shares)
20. 20
“Spreading Comps”
The Excel formula for the Treasury Stock Method is…..
= Exercisable options outstanding x
(stock price – exercise price) / stock price
Exercisable options are found in the options table in the notes
section of the 10-K. Hit CTRL-F and use “exercise” or “option”
as the search word, hit enter until you find it.
Exercisable options are only those that are vested.
21. 21
“Spreading Comps”
The Treasury Stock Method does not include in-the-money
convertible preferred or convertible debt. This must be calculated
separately, and should be included in diluted shares as well.
These are CSEs (common stock equivalents) too. When converting
them to equity equivalents for the diluted calculation, the diluted
EPS calculation must also exclude the interest or dividends paid on
those convertibles.
Convertibles have “conversion features” that set how many shares
each bond converts to. These are found in the indentures, sometimes
in the 10K.
If a $1,000 convertible bond converts to 100 shares, you will want to
convert only when the stock price is at least $10 plus the interest
income. 100 shares * $10 = $1,000. So if the stock price is at $12, it’s “in-
the-money”.
23. 23
Selecting Multiples and Ranges
Selecting multiples for implied valuation
Eliminate outliers
Average (mean) vs. median
Total versus stripped averages
Upper and lower quartiles
Risk Rankings
Emphasis towards companies with closer business models, size,
growth and profitability, etc.
Identifying meaningful implied valuation ranges
Not too narrow, not too broad
Be consistent
Public vs. private value
Liquidity discount
Research coverage
24. 24
Table of Contents
I. Valuation Overview
II. Comparable Public Companies
III. Precedent Transactions
IV. Discounted Cash Flow (DCF) Analysis
V. Conclusions
25. 25
Precedent Transactions
Another method of “relative valuation” is by precedent
transactions (M&A)
This is especially used in M&A, whereby an argument is made that
the client should fetch a price similar to recent buyouts of
comparable companies.
This is also a multiples based valuation
The amount a company is bought for in excess of its stock
price per share is called the “control premium”
Typical premiums are 20%-25%, but can be much higher or
lower depending on synergies and the strategic fit
26. 26
Precedent Transactions
Data sources for past M&A transactions:
SDC or other M&A databases
SEC filings
Equity research reports
Press releases (company or third-party)
Industry news
Typical information you will find:
Target and acquirer descriptions
Announce date vs. transaction date
– The price at which a transaction closes at can sometimes be
materially different from the original price offered at announce date
– The spread can be due to change in target or acquirer stock price, or
transaction-related adjustments
– Considerations should be independent of unforeseen price fluctuations
and transaction-specific costs
27. 27
Precedent Transactions
Additional typical information one should keep records of and
use:
Transaction rationale
– What were the motives? Was it to expand the product line, cross-
selling, cost synergies? Were there mostly financial considerations
such as the company being under-valued, poorly run, not capitalized
properly?
Implied TEV and MVE, implied valuation multiples, premiums paid
over avg. stock price 1, 5, 30 days prior to announcement date
The deal structure
– Were there earn-out provisions whereby a portion of the consideration
is withheld until operational milestones are met?
– Was a portion of the consideration placed in escrow contingent on all
disclosures being correctly made?
28. 28
Precedent Transactions
And lastly, one of the most important stats…..
The total consideration paid
100% cash?
100% stock?
Combination of cash and stock?
What if Shareholders of target get $12.65/share cash, AND
1.45 shares of the acquirer, how much is the acquiring
company paying?
We would also need to know how many shares outstanding are
there of the target, and stock price of the acquirer
If target has 24 mil shares outstanding, and the stock price of the
acquirer is $6.55/share..........
what is total consideration paid?
29. 29
Precedent Transactions
Solution for total consideration paid:
$12.65/share in cash * 24 mil shares = $304 million cash
1.45 shares * 24 mil shares = shareholders of target get 34.8
mil shares of acquirer.
What’s that worth in dollars? 34.8 * $6.55/share = $228 mil
worth of acquirer’s stock
$304 million cash + $228 million stock = $532 million “total
consideration”
30. 30
Precedent Transactions
What if we already know the consideration paid (usually the case)
and we want to calculate the exchange ratio? Assume we know
the following……
$48/share offer price
Mix of cash/stock is 20% cash, 80% stock
Target’s shares outstanding are 381.7 million
Acquirer’s stock price $26.67
What is the exchange ratio?
31. 31
Precedent Transactions
Calculate the per share amount of the $48 dollar offer price…
Target’s shareholders get 20% * $48 = $9.60/share in cash, therefore
$48.00 - $9.60 = $38.40/share in stock of the acquirer
Convert that per share cash and stock to dollar values…$9.60/share *
381.7 (target’s shares outstanding) = $3,664 cash, $38.40/share *
381.7 = $14,657 in the acquirer’s stock
Now…how many shares of stock does the acquirer have to offer the
target?
$14,657 in acquirer’s stock / $26.67 (acquirer’s share price) = 549.6
shares of the acquirer’s stock to the target’s shareholders
Finally, what’s the exchange ratio based on that? 549.6 acquirer
shares / 381.7 target shares = 1.44x exchange ratio.
The acquirer has to offer 1.44 share of its own stock for every 1 share
of the target’s shares outstanding
32. 32
Table of Contents
I. Valuation Overview
II. Comparable Public Companies
III. Precedent Transactions
IV. Discounted Cash Flow (DCF) Analysis
V. Conclusions
33. 33
Discounted Cash Flow Overview
The DCF calculation represents a company’s “intrinsic” value
Takes all cash flows projected into the future (infinitely) and
discounts them back to present dollars
Forecasting Free
Cash Flows
•Identify
components of
FCF
•Keep in mind
historical figures
•Project
financials using
assumptions
•Decide # of years
to forecast
Estimate Cost of
Capital
•Perform a WACC
analysis
•Develop target
capital
structure
•Estimate cost of
equity
Estimating
Terminal Value
• Determine
whether to use
“EBITDA
multiple” or
“Gordon
Growth” method
• Discount it back
to present value
Calculating
Results
•Bring all cash
flows to present
value
•Perform
sensitivity
analysis
•Interpret
results
34. 34
Pros and Cons of Discounted Cash Flow
DCF is more flexible than other valuation methodologies.
However, it is very sensitive to the estimated cash flows,
discount rate and terminal value
PROS
•Objective framework for
assessing cash flows and
risk
•Not dependent upon
publicly available
information
CONS
•Very sensitive to cash
flows
•Unbalanced valuation
weight to terminal value
•Cost of capital depends
on beta and market risk
premium
35. 35
Discounted Cash Flow (DCF) Analysis
Free cash flow (FCF) is used in DCF valuations.
More scientific method of valuing future operating results because
of differences in GAAP and cash flow.
A large capex expense next year will produce a much different
present value than its 10-year straight line depreciation expense
over 10 years.
There is levered and unlevered FCF……
“Unlevered FCF” = EBIT + D&A – taxes – increase (or + decrease)
in working capital – capital expenditures
“Levered FCF” = Net income + D&A – increase (or + decrease) in
working capital – capital expenditures
“Levered FCF” is otherwise simply: operating cash flow – capex
Only difference is that unlevered FCF excludes interest expense.
It is independent of the capital structure.
36. 36
Discounted Cash Flow (DCF) Analysis
A DCF can use free cash flow projections anywhere from 5
years to 10 years in the future. An early stage company
(venture capital) may even use 12 years.
When making projections, remember that recessions do occur,
and while we do not know when in the future, one must make
assumptions that conditions will not always be good.
When making projections, one must bear in mind that cycles
do occur, and to capture at least one up-cycle and down-cycle,
if the company is a cyclical. How long are the cycles?
Aerospace has long cycles, Semiconductor short cycles.
37. 37
Terminal Value
DCF first discounts to the present value each year of annual
projections. A dollar in 10 years should be worth more than today
because you can invest it, therefore a dollar in 10 years would be
worth less in present day dollars.
The largest component of the DCF valuation is the “terminal value”
Companies are valued “in perpetuity”. The terminal value gives the
company credit for likely still being in business beyond, say, year 10
of a 10-year cash flow projection.
The terminal value uses one of the following methodologies to
calculate the “perpetuity” portion of the DCF….
Gordon Growth method
Terminal Multiple method
38. 38
Terminal Multiple v. Gordon Growth
The “terminal multiple” method’s terminal value = an assumed
TEV/EBITDA multiple at the final year of the projections, and
then discounts that back to present dollar values.
The “Gordon Growth” method’s terminal value = final year’s
FCF multiplied by (1+G), then divided by (R – G), then discount
that to the present by taking that result and divide by (1 + R) ^
year
Whereby…..
R = discount rate (same as cost of capital)
G = Projected long-term growth rate
^ = to the power of (exponent)
Year = how many years in the future is the final year’s FCF
projection times (1+G), which is one year past the final year of
the annual projections.
39. 39
Cost of Capital
Each year’s FCF projection and the terminal value will be
discounted back to present day by (1 + R) ^ year
R = discount rate = cost of capital (all are synonyms)
It is also called “cost of capital” because it is both a measure
of risk, and takes into account where else we could we invest
given the level of risk.
If you invest in something as riskless as a 3-month US Treasury,
your discount rate used = the interest rate of the 3-month T-
Bill.
If you invest in a biotech as risky as something where you stand
to lose all your money, you may use a discount rate as high as
35%.
Venture capital uses very high discount rates
40. 40
Cost of Capital
The discount rate is comprised of two types of capital:
Cost of equity
Cost of debt
Cost of preferred stock, if any
Because most companies have some debt, the discount rate is called
the “weighted average cost of capital” because one needs to weight
each component according to its proportion in the capital structure.
The formula to weight the components is:
WACC = (cost of equity * (mkt cap / (mkt cap + debt)))
+ (cost of debt * (debt / (mkt. cap + debt)) * (1 – tax rate)))
Now, how do we calculation the cost of equity and cost of debt? ……..
41. 41
Cost of Equity
The cost of equity is typically calculated by a formula called “the
capital asset pricing model” (CAPM, pronounced “cap – m”)
Cost of Equity = risk free rate + beta * (avg. stock mkt. return – risk free
rate)
Risk free rate is the US treasury of a duration similar to how long you
plan to invest, how liquid is the investment. If passive investing in a
public stock that you can sell anytime, use 3-month T-Bill. If an LBO
firm planned to buy and sell a company in 5 years, they may use the
5-year US Treasury.
The Average stock market return is debatable because a lot has
changed in recent years. Investors used to use a 12% S&P return over
the last 40 years. One may use judgment in selecting this rate.
And what is the beta? ………
42. 42
Cost of Equity – the “Beta”
(stock mkt. return – risk free rate) is otherwise known as the “risk
premium”.
The “risk premium” is multiplied by a “beta”
“Beta” is the measure of risk and the largest variable in the
calculation. It is obtained from a data service like Bloomberg or
Ibbotson, and technically it is a calculation of how much a stock has
gyrated with the overall stock market.
A beta of 1.2x means the stock, over some period of time, 2 years, 5
years, has gone up $1.20 for every $1.00 rise in the market, and
fallen by $1.20 when the market goes down $1.00.
High beta = high risk (but potentially, high reward as well)
Use your judgment, think. A beta from data over the last 5 years may
not be appropriate if a lot has changed with the company recently. Or
maybe it has become less risky.
43. 43
Cost of Equity – Levering & Unlevering Betas
Levering and un-levering betas…..
The betas you obtain from Bloomberg are “levered betas”. This
means they include the entire capital structure.
If a client is a private company, or if it will recapitalize, you need to
un-lever the beta, and then re-lever it for the company’s own capital
structure. If private company, you would take median levered beta of
peers which may have radically different debt/equity proportions, un-
lever it, then re-lever it.
Formula to un-lever a beta:
“Unlevered beta” = levered beta / (1 + D / E) * (1 – tax rate)
Formula to re-lever a beta:
“Levered Beta” = un-levered beta * (1 + D / E) * (1 – tax rate)
44. 44
Cost of Debt
Cost of debt is the after tax weighted average interest rate a
company pays for its debt. If weighted average is 9%, cost of
debt is 9% * (1- tax rate).
It is lower than the cost of equity because it carries less risk, it
is more senior in the capital structure and more likely to
recoup its money if the company liquidates.
Cost of debt rarely will be higher than cost of equity because
lenders will simply not lend more if it gets too risky, if the
company has already taken on a lot of debt.
To weight the overall interest rate, break out all debt
tranches, and weight according to how much each is as a
percent of total debt. Then multiply each tranche’s interest
rate by that weighting percentage. Add them up.
45. 45
Cost of Debt
Calculate the average (weighted) of the coupon rates of each
tranche of debt, and multiply that by the tax shield (1 - tax
rate)
First sum all debt. Then multiple each tranche’s amount by
sum of all debt. Then multiply each weight by each respective
coupon rate. Then sum all weighted coupon rates. That’s the
cost of debt.
$500M of 8.25% senior notes due 2010
$250M of 9.00% senior notes due 2012
$300M of 12.5% senior subordinated notes due 2012
Tax rate of 40%
Cost of debt = 9.64% x (1-.40) = 5.79%
47. 47
Table of Contents
I. Valuation Overview
II. Comparable Public Companies
III. Precedent Transactions
IV. Discounted Cash Flow (DCF) Analysis
V. Conclusions
48. 48
Pros and Cons of 3 Valuation Methods
Pros Cons
Comparable
Public Companies
Highly efficient
market
Easy to find
information (public
access)
Size discrepancy
Liquidity difference
Hard to find “good”
comps in niche market
Precedent
Transactions
For M&A, arguably,
the most accurate
method
Poor disclosure on
private and small
deals
Hard to find “good”
comps in niche or
slow M&A market
Discounted
Cash Flow (DCF)
Represents intrinsic
value
Can make own
projections
Highly sensitive to
discount rate and
terminal multiple
“Hockey Stick”
tendencies –
projection risk