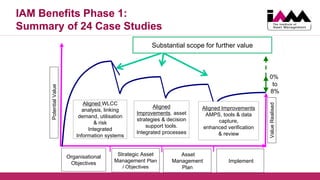
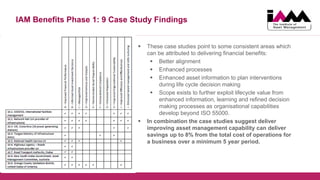
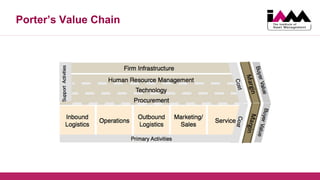
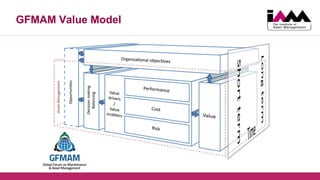
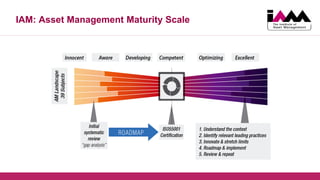
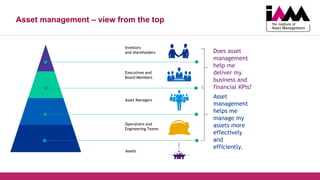
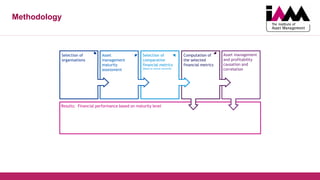
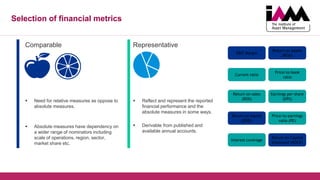
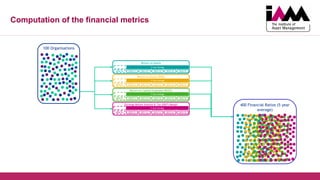
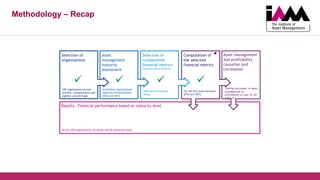
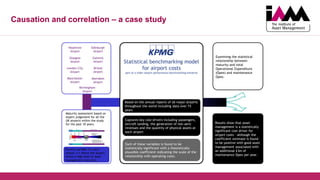
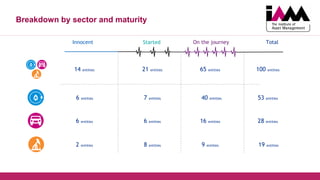
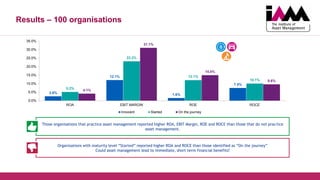
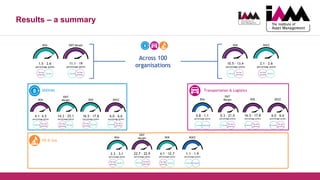
The Benefits and Value of Asset
Management
IAM Annual Conference 2017 | Tuesday 27th June
Ross Agnew | Ursula Bryan
Asset Management and Financial Performance:
Convergent Activity – Different Lenses
 IAM project phase 1: Analysis of Case Studies on The ‘Value’ and ‘Benefits’ from
Asset Management (Tim Kersley)
 IAM project phase 2: KPMG assessment of financial performance of
organisations practicing asset management (Salar Shemirani)
 Value from Assets: Using Porter’s Value Chain (Tom Smith)
 Value of Asset Management to an Organization – project by Global Forum on
Maintenance and Asset Management (GFMAM)
 Asset Management and Financial Value – (Erik Helms Nielsen)
IAM Benefits Phase 1:
Summary of 24 Case Studies
Organisational
Objectives
Strategic Asset
Management Plan
/ Objectives
Asset
Management
Plan
Implement
PotentialValue
ValueRealised
0%
to
8%
Aligned WLCC
analysis, linking
demand, utilisation
& risk
Integrated
Information systems
Aligned
Improvements. asset
strategies & decision
support tools.
Integrated processes
Aligned Improvements
AMPS, tools & data
capture,
enhanced verification
& review
Substantial scope for further value
IAM Benefits Phase 1: Benefits offset by Disbenefits
BENEFIT DISBENEFIT
Improved Financial Performance Unknown backlogs revealed
Informed asset investment decisions
True current risk levels revealed - these may be at odds with stakeholder
expectation / assumptions
managed risk (including safety & environmental) Required investment to realise strategic impact is large
Improved services and outputs
Largest sustainable benefits likely to arise beyond tenure of C-suite role holders
(i.e. > 7 years)
demonstrable social responsibility
Move towards consistent and controlled management system may be perceived
as eroding local empowerment. Some will feel 'losers' in initial phases.
demonstrable compliance withdrawal of non-value adding services may create political / stakeholder disquiet
enhanced reputation
Visibility of impacts and shortcomings of 'tactical cuts makes short term cost
savings less tolerable to stakeholders
improved organisational sustainability
Several phases of change over many years are likely necessary. This may create
change fatigue
improved efficiency & effectiveness
External pressure increases for independent scrutiny and audit to verify
appropriateness of changes
enhanced interest in pursuing a career in Asset Management.
IAM Benefits Phase 1: 9 Case Study Findings
 These case studies point to some consistent areas which
can be attributed to delivering financial benefits:
 Better alignment
 Enhanced processes
 Enhanced asset information to plan interventions
during life cycle decision making
 Scope exists to further exploit lifecycle value from
enhanced information, learning and refined decision
making processes as organisational capabilities
develop beyond ISO 55000.
 In combination the case studies suggest deliver
improving asset management capability can deliver
savings up to 8% from the total cost of operations for
a business over a minimum 5 year period.
Porter’s Value Chain
GFMAM Value Model
IAM: Asset Management Maturity Scale
Financial Benefit Case
Ross Agnew
Aims and Objectives
The principal aim of the study is to investigate if organisations that practise asset management deliver greater
value than those that do not practise asset management or practice less.
Does practising asset management contribute to organisations’ financial performance and well-
being?1
Do asset management practising organisations realise better financial performance than those that
do not, or do less, in asset management?2
Based on evidence, can we say that asset management is influential in financial performance of
organisation?3
Is there a direct relationship between asset management maturity and profitability?4
Asset management – view from the top
Assets
Operations and
Engineering Teams
Asset Managers
Executives and
Board Members
Investors
and shareholders
Asset
management
helps me
manage my
assets more
effectively
and
efficiently.
Does asset
management
help me
deliver my
business and
financial KPIs?
Results: Financial performance based on maturity level
Asset management
and profitability
causation and
correlation
Computation of
the selected
financial metrics
Methodology
Selection of
comparative
financial metrics
(Based on annual accounts)
Asset
management
maturity
assessment
Selection of
organisations
In addition to above criteria the following exemption criteria were taken into account.
 Organisations that reported significant corporate events within the past five years, namely part-sale, revenue impacting acquisition, merger
and de-merger etc.
 Organisations with majority presence in sectors other than one of the sectors in selection criteria (examples include those conglomerate that
have presence in numerous sectors).
Approach – selection of organisations
United Kingdom
India
Australia and New
Zealand
Operating
Region
Availability of
Annual Reports
Annual
Report
2010-11
Annual
Report
2011-12
Annual
Report
2012-13
Annual
Report
2013-14
Annual
Report
2014-15
Annual
Report
2009-10
Annual
Report
2010-11
Annual
Report
2011-12
Annual
Report
2012-13
Annual
Report
2013-14
Organisations is shortlisted if all of the
above available proceed.
If all of the below available
organisation is shortlisted, if not
organisation is not qualified for
this study.
1 Billion USD
> 1 Billion USD
< 1 Billion USD
Reported Revenue
Selection commence with organisations
with the highest most recent reported
revenue.
Transportation and
Logistics
Utilities
Oil & Gas
Operating Sector
Approach – maturity levels
Organisations that were found to be either well-aware of the concept of asset management or have measures in place that translate into advance
practices of asset management. Organisations allocated to this level of maturity are those that are typically referred to as those in “Competence” and
“Excellence” levels of IAM’s maturity guide.
Those organisations that have recently started implementing asset management practices or those that maintained developing awareness towards
asset management. Originations in this maturity level are those in “Awareness”, “Understanding” and “Developing” as per the IAM’s maturity
guide.
Organisations that were found to be innocent/unaware of the concept of asset management and hence do not have any indication of applying such
practices within the organisation. The IAM’s maturity guide refers to these organisations as those in “Innocence” stage.
On the
journey
Started
Innocent
The Asset Management Pulse
Innocent Started On the journey
Selection of financial metrics
Comparable
 Need for relative measures as oppose to
absolute measures.
 Absolute measures have dependency on
a wider range of nominators including
scale of operations, region, sector,
market share etc.
Representative
 Reflect and represent the reported
financial performance and the
absolute measures in some ways.
 Derivable from published and
available annual accounts.
Return on Assets
(ROA)
EBIT Margin
Return on equity
(ROE)
Return on sales
(ROS)
Current ratio
Interest coverage
Earnings per share
(EPS)
Price-to-earnings
ratio (PE)
Price-to-book
ratio
Return on Capital
Employed (ROCE)
2010-11 2011-12 2012-13 2013-14 2014-152009-10
2010-11 2011-12 2012-13 2013-14 2014-152009-10
2010-11 2011-12 2012-13 2013-14 2014-152009-10
2010-11 2011-12 2012-13 2013-14 2014-152009-10
Return on Assets
Return on Equity (ROE)
Return on Capital Employed (ROCE)
Earnings Before Interest & Tax (EBIT) Margin
5 Year Average
5 Year Average
5 Year Average
5 Year Average
Computation of the financial metrics
400 Financial Ratios (5 year
average)
100 Organisations
Results: Financial performance based on maturity level
Asset management
and profitability
causation and
correlation
Computation of
the selected
financial metrics
Methodology – Recap
Testing the impact of asset
management on
profitability (a case for UK
airports).
Selection of
comparative
financial metrics
(Based on annual accounts)
Asset
management
maturity
assessment
Selection of
organisations
100 organisations across
utilities, transportation and
logistics and oil & gas
Simplified organisational
maturity levels between
2010 and 2015
Selection of financial
ratios.
For the five years between
2010 and 2015.
Across 100 organisations, by sector and by ownership type.
   
Causation and correlation – a case study
Statistical benchmarking model
for airport costs
part of a wider airport performance benchmarking initiative
Based on the annual reports of 26 major airports
throughout the world including data over 15
years
Captures key cost drivers including passengers,
aircraft landing, the generation of non-aero
revenues and the quantity of physical assets at
each airport
Each of these variables is found to be
statistically significant with a theoretically
plausible coefficient indicating the scale of the
relationship with operating costs.
Examining the statistical
relationship between
maturity and total
Operational Expenditure
(Opex) and maintenance
Opex.
Heathrow
Airport
Edinburgh
Airport
Glasgow
Airport
Gatwick
Airport
London City
Airport
Bristol
Airport
Manchester
Airport
Birmingham
Airport
Aberdeen
Airport
Dummy variable for each
airport (=1 where the airport
shows a high level of asset
management maturity).
Maturity assessment based on
expert judgement for all the
UK airports within the study
for the past 10 years. Results show that asset
management is a statistically
significant cost driver for
airport costs - although the
coefficient estimate is found
to be positive with good asset
management associated with
an additional £3m of
maintenance Opex per year.
Breakdown by sector and maturity
Innocent Started On the journey
14 entities 21 entities 65 entities
Total
6 entities 7 entities 40 entities
6 entities 6 entities 16 entities
2 entities 8 entities 9 entities
100 entities
53 entities
28 entities
19 entities
Results – 100 organisations
2.6%
12.1%
1.6%
7.5%
5.2%
23.2%
12.1%
10.1%
4.1%
31.1%
15.0%
9.6%
0.0%
5.0%
10.0%
15.0%
20.0%
25.0%
30.0%
35.0%
ROA EBIT MARGIN ROE ROCE
Innocent Started On the journey
Those organisations that practice asset management reported higher ROA, EBIT Margin, ROE and ROCE than those that do not practice
asset management.
Organisations with maturity level “Started” reported higher ROA and ROCE than those identified as “On the journey”
Could asset management lead to immediate, short term financial benefits?
Results – by sector
5.1%
20.3%
9.0% 10.2%
4.8%
23.9%
8.7% 8.9%
4.0%
31.9%
30.0%
10.3%
0.0%
10.0%
20.0%
30.0%
Return on Assets EBIT Margin Return on equity
(ROE)
Return on Capital
Employed (ROCE)
Higher reported EBIT Margin, ROE and ROCE amongst those “On the journey” in comparison with those “Innocent”.
Those identified as “Innocent” reported higher ROA than those "On the journey”, and higher ROA,ROE and ROCE than
those “Started”.
Organisations in this study include asset owners, asset operators and asset maintainers.
3.8% 1.2%
6.6%
12.8%
6.9%
23.9%
19.3%
12.0%
6.1%
24.1%
10.7% 10.9%
0.0%
10.0%
20.0%
30.0%
Return on Assets EBIT Margin Return on equity
(ROE)
Return on Capital
Employed
(ROCE)
Those Oil & Gas organisations that practice asset management to some extent, reported higher ROA, EBIT Margin and ROE
than those that do not practice asset management.
Higher ROCE reported by “Innocent” originations that those “Started” and “On the journey”.
Could this be due to oil market volatility headlining the industry since mid-2014?
(0.4)%
7.6%
(7.6)%
3.0%4.1%
21.9%
8.9%
9.6%
3.7%
32.7%
10.2% 9.0%
(10.0)%
0.0%
10.0%
20.0%
30.0%
ROA EBIT Margin ROE ROCE
Those utilities that practice asset management reported higher ROA, EBIT Margin, ROE and ROCE than those that do not
practice asset management.
“Started” utilities reported higher ROA and ROCE than those identified as “On the journey.
Results – a summary
0.8 – 1.1
percentage points
ROA
0.3 – 21.0
percentage points
EBIT
Margin
16.5 – 17.8
percentage points
ROE
6.0 – 6.6
percentage points
ROCE
Transportation & Logistics
Started
On the
journey
Started Innocent Innocent
On the
journey
Innocent
On the
journey
4.1– 4.5
percentage points
ROA
14.3 – 25.1
percentage points
EBIT
Margin
16.5 – 17.8
percentage points
ROE
6.0 – 6.6
percentage points
ROCE
Utilities
Started
On the
journey
On the
journey
Started
On the
journey
Started Started
On the
journey
1.5 – 2.6
percentage points
ROA
11.1 – 19
percentage points
EBIT Margin
10.5 – 13.4
percentage points
ROE
2.1 – 2.6
percentage points
ROCE
Across 100
organisations
On the
journey
Started Started
On the
journey
Started
On the
journey
On the
journey
Started
2.3 – 3.1
percentage points
ROA
22.7 – 22.9
percentage points
EBIT
Margin
4.1 – 12.7
percentage points
ROE
1.1 – 1.9
percentage points
ROCE
Oil & Gas
On the
journey
Started Started Innocent
On the
journey
StartedStarted
On the
journey
Next steps and recommendations
 Extending the scope to North America.
 Increase the number of organisations within the
scope and expand into other sectors.
 Further assess the long term benefits of asset
management by extending the evaluation period.
 Next steps
 Extending the evaluation of financial performance
to indirect financial metrics that correspond to
financial well-being.
 Assessing the value and scale of asset
management based on different high level asset
classes (i.e. economic infrastructure, social
infrastructure etc.).
 Further investigation on the link between asset
management practices and:
 Fixed assets value
 Depreciation to fixed assets ratio
 Recommendations and follow-up

Stream C_Ross Agnew Ursula Bryan

  • 1.
    The Benefits andValue of Asset Management IAM Annual Conference 2017 | Tuesday 27th June Ross Agnew | Ursula Bryan
  • 2.
    Asset Management andFinancial Performance: Convergent Activity – Different Lenses  IAM project phase 1: Analysis of Case Studies on The ‘Value’ and ‘Benefits’ from Asset Management (Tim Kersley)  IAM project phase 2: KPMG assessment of financial performance of organisations practicing asset management (Salar Shemirani)  Value from Assets: Using Porter’s Value Chain (Tom Smith)  Value of Asset Management to an Organization – project by Global Forum on Maintenance and Asset Management (GFMAM)  Asset Management and Financial Value – (Erik Helms Nielsen)
  • 3.
    IAM Benefits Phase1: Summary of 24 Case Studies Organisational Objectives Strategic Asset Management Plan / Objectives Asset Management Plan Implement PotentialValue ValueRealised 0% to 8% Aligned WLCC analysis, linking demand, utilisation & risk Integrated Information systems Aligned Improvements. asset strategies & decision support tools. Integrated processes Aligned Improvements AMPS, tools & data capture, enhanced verification & review Substantial scope for further value
  • 4.
    IAM Benefits Phase1: Benefits offset by Disbenefits BENEFIT DISBENEFIT Improved Financial Performance Unknown backlogs revealed Informed asset investment decisions True current risk levels revealed - these may be at odds with stakeholder expectation / assumptions managed risk (including safety & environmental) Required investment to realise strategic impact is large Improved services and outputs Largest sustainable benefits likely to arise beyond tenure of C-suite role holders (i.e. > 7 years) demonstrable social responsibility Move towards consistent and controlled management system may be perceived as eroding local empowerment. Some will feel 'losers' in initial phases. demonstrable compliance withdrawal of non-value adding services may create political / stakeholder disquiet enhanced reputation Visibility of impacts and shortcomings of 'tactical cuts makes short term cost savings less tolerable to stakeholders improved organisational sustainability Several phases of change over many years are likely necessary. This may create change fatigue improved efficiency & effectiveness External pressure increases for independent scrutiny and audit to verify appropriateness of changes enhanced interest in pursuing a career in Asset Management.
  • 5.
    IAM Benefits Phase1: 9 Case Study Findings  These case studies point to some consistent areas which can be attributed to delivering financial benefits:  Better alignment  Enhanced processes  Enhanced asset information to plan interventions during life cycle decision making  Scope exists to further exploit lifecycle value from enhanced information, learning and refined decision making processes as organisational capabilities develop beyond ISO 55000.  In combination the case studies suggest deliver improving asset management capability can deliver savings up to 8% from the total cost of operations for a business over a minimum 5 year period.
  • 6.
  • 7.
  • 8.
    IAM: Asset ManagementMaturity Scale
  • 9.
  • 10.
    Aims and Objectives Theprincipal aim of the study is to investigate if organisations that practise asset management deliver greater value than those that do not practise asset management or practice less. Does practising asset management contribute to organisations’ financial performance and well- being?1 Do asset management practising organisations realise better financial performance than those that do not, or do less, in asset management?2 Based on evidence, can we say that asset management is influential in financial performance of organisation?3 Is there a direct relationship between asset management maturity and profitability?4
  • 11.
    Asset management –view from the top Assets Operations and Engineering Teams Asset Managers Executives and Board Members Investors and shareholders Asset management helps me manage my assets more effectively and efficiently. Does asset management help me deliver my business and financial KPIs?
  • 12.
    Results: Financial performancebased on maturity level Asset management and profitability causation and correlation Computation of the selected financial metrics Methodology Selection of comparative financial metrics (Based on annual accounts) Asset management maturity assessment Selection of organisations
  • 13.
    In addition toabove criteria the following exemption criteria were taken into account.  Organisations that reported significant corporate events within the past five years, namely part-sale, revenue impacting acquisition, merger and de-merger etc.  Organisations with majority presence in sectors other than one of the sectors in selection criteria (examples include those conglomerate that have presence in numerous sectors). Approach – selection of organisations United Kingdom India Australia and New Zealand Operating Region Availability of Annual Reports Annual Report 2010-11 Annual Report 2011-12 Annual Report 2012-13 Annual Report 2013-14 Annual Report 2014-15 Annual Report 2009-10 Annual Report 2010-11 Annual Report 2011-12 Annual Report 2012-13 Annual Report 2013-14 Organisations is shortlisted if all of the above available proceed. If all of the below available organisation is shortlisted, if not organisation is not qualified for this study. 1 Billion USD > 1 Billion USD < 1 Billion USD Reported Revenue Selection commence with organisations with the highest most recent reported revenue. Transportation and Logistics Utilities Oil & Gas Operating Sector
  • 14.
    Approach – maturitylevels Organisations that were found to be either well-aware of the concept of asset management or have measures in place that translate into advance practices of asset management. Organisations allocated to this level of maturity are those that are typically referred to as those in “Competence” and “Excellence” levels of IAM’s maturity guide. Those organisations that have recently started implementing asset management practices or those that maintained developing awareness towards asset management. Originations in this maturity level are those in “Awareness”, “Understanding” and “Developing” as per the IAM’s maturity guide. Organisations that were found to be innocent/unaware of the concept of asset management and hence do not have any indication of applying such practices within the organisation. The IAM’s maturity guide refers to these organisations as those in “Innocence” stage. On the journey Started Innocent The Asset Management Pulse Innocent Started On the journey
  • 15.
    Selection of financialmetrics Comparable  Need for relative measures as oppose to absolute measures.  Absolute measures have dependency on a wider range of nominators including scale of operations, region, sector, market share etc. Representative  Reflect and represent the reported financial performance and the absolute measures in some ways.  Derivable from published and available annual accounts. Return on Assets (ROA) EBIT Margin Return on equity (ROE) Return on sales (ROS) Current ratio Interest coverage Earnings per share (EPS) Price-to-earnings ratio (PE) Price-to-book ratio Return on Capital Employed (ROCE)
  • 16.
    2010-11 2011-12 2012-132013-14 2014-152009-10 2010-11 2011-12 2012-13 2013-14 2014-152009-10 2010-11 2011-12 2012-13 2013-14 2014-152009-10 2010-11 2011-12 2012-13 2013-14 2014-152009-10 Return on Assets Return on Equity (ROE) Return on Capital Employed (ROCE) Earnings Before Interest & Tax (EBIT) Margin 5 Year Average 5 Year Average 5 Year Average 5 Year Average Computation of the financial metrics 400 Financial Ratios (5 year average) 100 Organisations
  • 17.
    Results: Financial performancebased on maturity level Asset management and profitability causation and correlation Computation of the selected financial metrics Methodology – Recap Testing the impact of asset management on profitability (a case for UK airports). Selection of comparative financial metrics (Based on annual accounts) Asset management maturity assessment Selection of organisations 100 organisations across utilities, transportation and logistics and oil & gas Simplified organisational maturity levels between 2010 and 2015 Selection of financial ratios. For the five years between 2010 and 2015. Across 100 organisations, by sector and by ownership type.    
  • 18.
    Causation and correlation– a case study Statistical benchmarking model for airport costs part of a wider airport performance benchmarking initiative Based on the annual reports of 26 major airports throughout the world including data over 15 years Captures key cost drivers including passengers, aircraft landing, the generation of non-aero revenues and the quantity of physical assets at each airport Each of these variables is found to be statistically significant with a theoretically plausible coefficient indicating the scale of the relationship with operating costs. Examining the statistical relationship between maturity and total Operational Expenditure (Opex) and maintenance Opex. Heathrow Airport Edinburgh Airport Glasgow Airport Gatwick Airport London City Airport Bristol Airport Manchester Airport Birmingham Airport Aberdeen Airport Dummy variable for each airport (=1 where the airport shows a high level of asset management maturity). Maturity assessment based on expert judgement for all the UK airports within the study for the past 10 years. Results show that asset management is a statistically significant cost driver for airport costs - although the coefficient estimate is found to be positive with good asset management associated with an additional £3m of maintenance Opex per year.
  • 19.
    Breakdown by sectorand maturity Innocent Started On the journey 14 entities 21 entities 65 entities Total 6 entities 7 entities 40 entities 6 entities 6 entities 16 entities 2 entities 8 entities 9 entities 100 entities 53 entities 28 entities 19 entities
  • 20.
    Results – 100organisations 2.6% 12.1% 1.6% 7.5% 5.2% 23.2% 12.1% 10.1% 4.1% 31.1% 15.0% 9.6% 0.0% 5.0% 10.0% 15.0% 20.0% 25.0% 30.0% 35.0% ROA EBIT MARGIN ROE ROCE Innocent Started On the journey Those organisations that practice asset management reported higher ROA, EBIT Margin, ROE and ROCE than those that do not practice asset management. Organisations with maturity level “Started” reported higher ROA and ROCE than those identified as “On the journey” Could asset management lead to immediate, short term financial benefits?
  • 21.
    Results – bysector 5.1% 20.3% 9.0% 10.2% 4.8% 23.9% 8.7% 8.9% 4.0% 31.9% 30.0% 10.3% 0.0% 10.0% 20.0% 30.0% Return on Assets EBIT Margin Return on equity (ROE) Return on Capital Employed (ROCE) Higher reported EBIT Margin, ROE and ROCE amongst those “On the journey” in comparison with those “Innocent”. Those identified as “Innocent” reported higher ROA than those "On the journey”, and higher ROA,ROE and ROCE than those “Started”. Organisations in this study include asset owners, asset operators and asset maintainers. 3.8% 1.2% 6.6% 12.8% 6.9% 23.9% 19.3% 12.0% 6.1% 24.1% 10.7% 10.9% 0.0% 10.0% 20.0% 30.0% Return on Assets EBIT Margin Return on equity (ROE) Return on Capital Employed (ROCE) Those Oil & Gas organisations that practice asset management to some extent, reported higher ROA, EBIT Margin and ROE than those that do not practice asset management. Higher ROCE reported by “Innocent” originations that those “Started” and “On the journey”. Could this be due to oil market volatility headlining the industry since mid-2014? (0.4)% 7.6% (7.6)% 3.0%4.1% 21.9% 8.9% 9.6% 3.7% 32.7% 10.2% 9.0% (10.0)% 0.0% 10.0% 20.0% 30.0% ROA EBIT Margin ROE ROCE Those utilities that practice asset management reported higher ROA, EBIT Margin, ROE and ROCE than those that do not practice asset management. “Started” utilities reported higher ROA and ROCE than those identified as “On the journey.
  • 22.
    Results – asummary 0.8 – 1.1 percentage points ROA 0.3 – 21.0 percentage points EBIT Margin 16.5 – 17.8 percentage points ROE 6.0 – 6.6 percentage points ROCE Transportation & Logistics Started On the journey Started Innocent Innocent On the journey Innocent On the journey 4.1– 4.5 percentage points ROA 14.3 – 25.1 percentage points EBIT Margin 16.5 – 17.8 percentage points ROE 6.0 – 6.6 percentage points ROCE Utilities Started On the journey On the journey Started On the journey Started Started On the journey 1.5 – 2.6 percentage points ROA 11.1 – 19 percentage points EBIT Margin 10.5 – 13.4 percentage points ROE 2.1 – 2.6 percentage points ROCE Across 100 organisations On the journey Started Started On the journey Started On the journey On the journey Started 2.3 – 3.1 percentage points ROA 22.7 – 22.9 percentage points EBIT Margin 4.1 – 12.7 percentage points ROE 1.1 – 1.9 percentage points ROCE Oil & Gas On the journey Started Started Innocent On the journey StartedStarted On the journey
  • 23.
    Next steps andrecommendations  Extending the scope to North America.  Increase the number of organisations within the scope and expand into other sectors.  Further assess the long term benefits of asset management by extending the evaluation period.  Next steps  Extending the evaluation of financial performance to indirect financial metrics that correspond to financial well-being.  Assessing the value and scale of asset management based on different high level asset classes (i.e. economic infrastructure, social infrastructure etc.).  Further investigation on the link between asset management practices and:  Fixed assets value  Depreciation to fixed assets ratio  Recommendations and follow-up