Download as PDF, PPTX


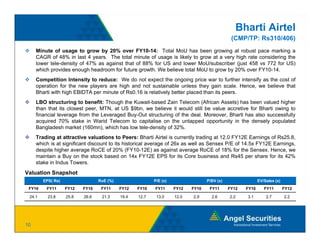
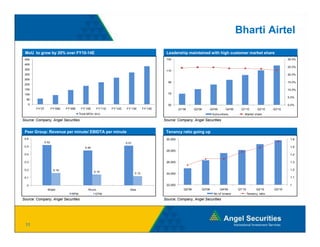


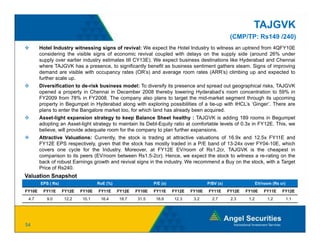

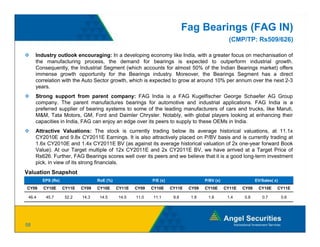

Bharti Airtel is well positioned for strong growth over the next few years. Total minutes of usage are expected to grow at 20% annually through FY2014 as tele-density and usage per subscriber remain well below developed markets. Competition is also expected to moderate as costs for new entrants are high. Bharti trades at an attractive valuation of 12x FY2012 earnings compared to its historical average of 26x and the Sensex P/E of 14.5x, despite higher returns. The acquisition of African and Bangladesh assets is also expected to be accretive. Overall, Bharti Airtel provides exposure to the growing Indian telecom sector at a reasonable valuation.


