Download to read offline
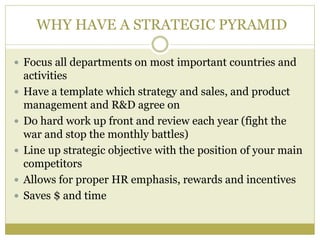
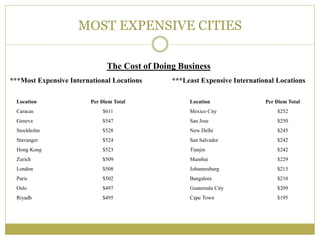
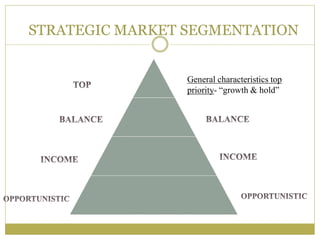
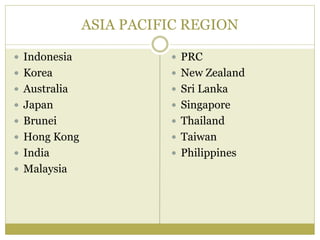

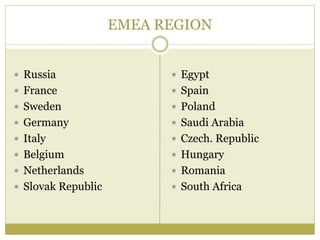

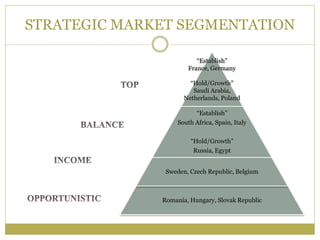

This document outlines a strategic pyramid framework for an organization. It recommends focusing resources on the most important countries and activities, having aligned strategies across departments, doing strategic planning upfront and reviewing annually, aligning objectives with competitors, and ensuring proper incentives. It also provides data on the most and least expensive international cities to do business. Finally, it outlines a strategic market segmentation approach that categorizes markets as growth and hold, balance, income, or opportunistic based on factors like market size and revenue potential to guide resource allocation.


