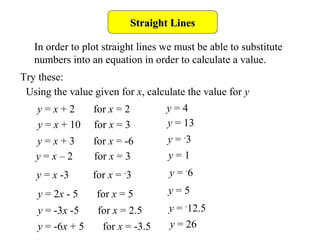
This document discusses plotting and graphing straight lines. It explains how to generate points by substituting values into linear equations and completing tables of values. Examples show linear equations in the form y=mx+c, where c represents the y-intercept. The document demonstrates that lines with the same m value but different c values are parallel, and c determines where the line crosses the y-axis. Completing tables of values and plotting points allows straight lines to be graphed.