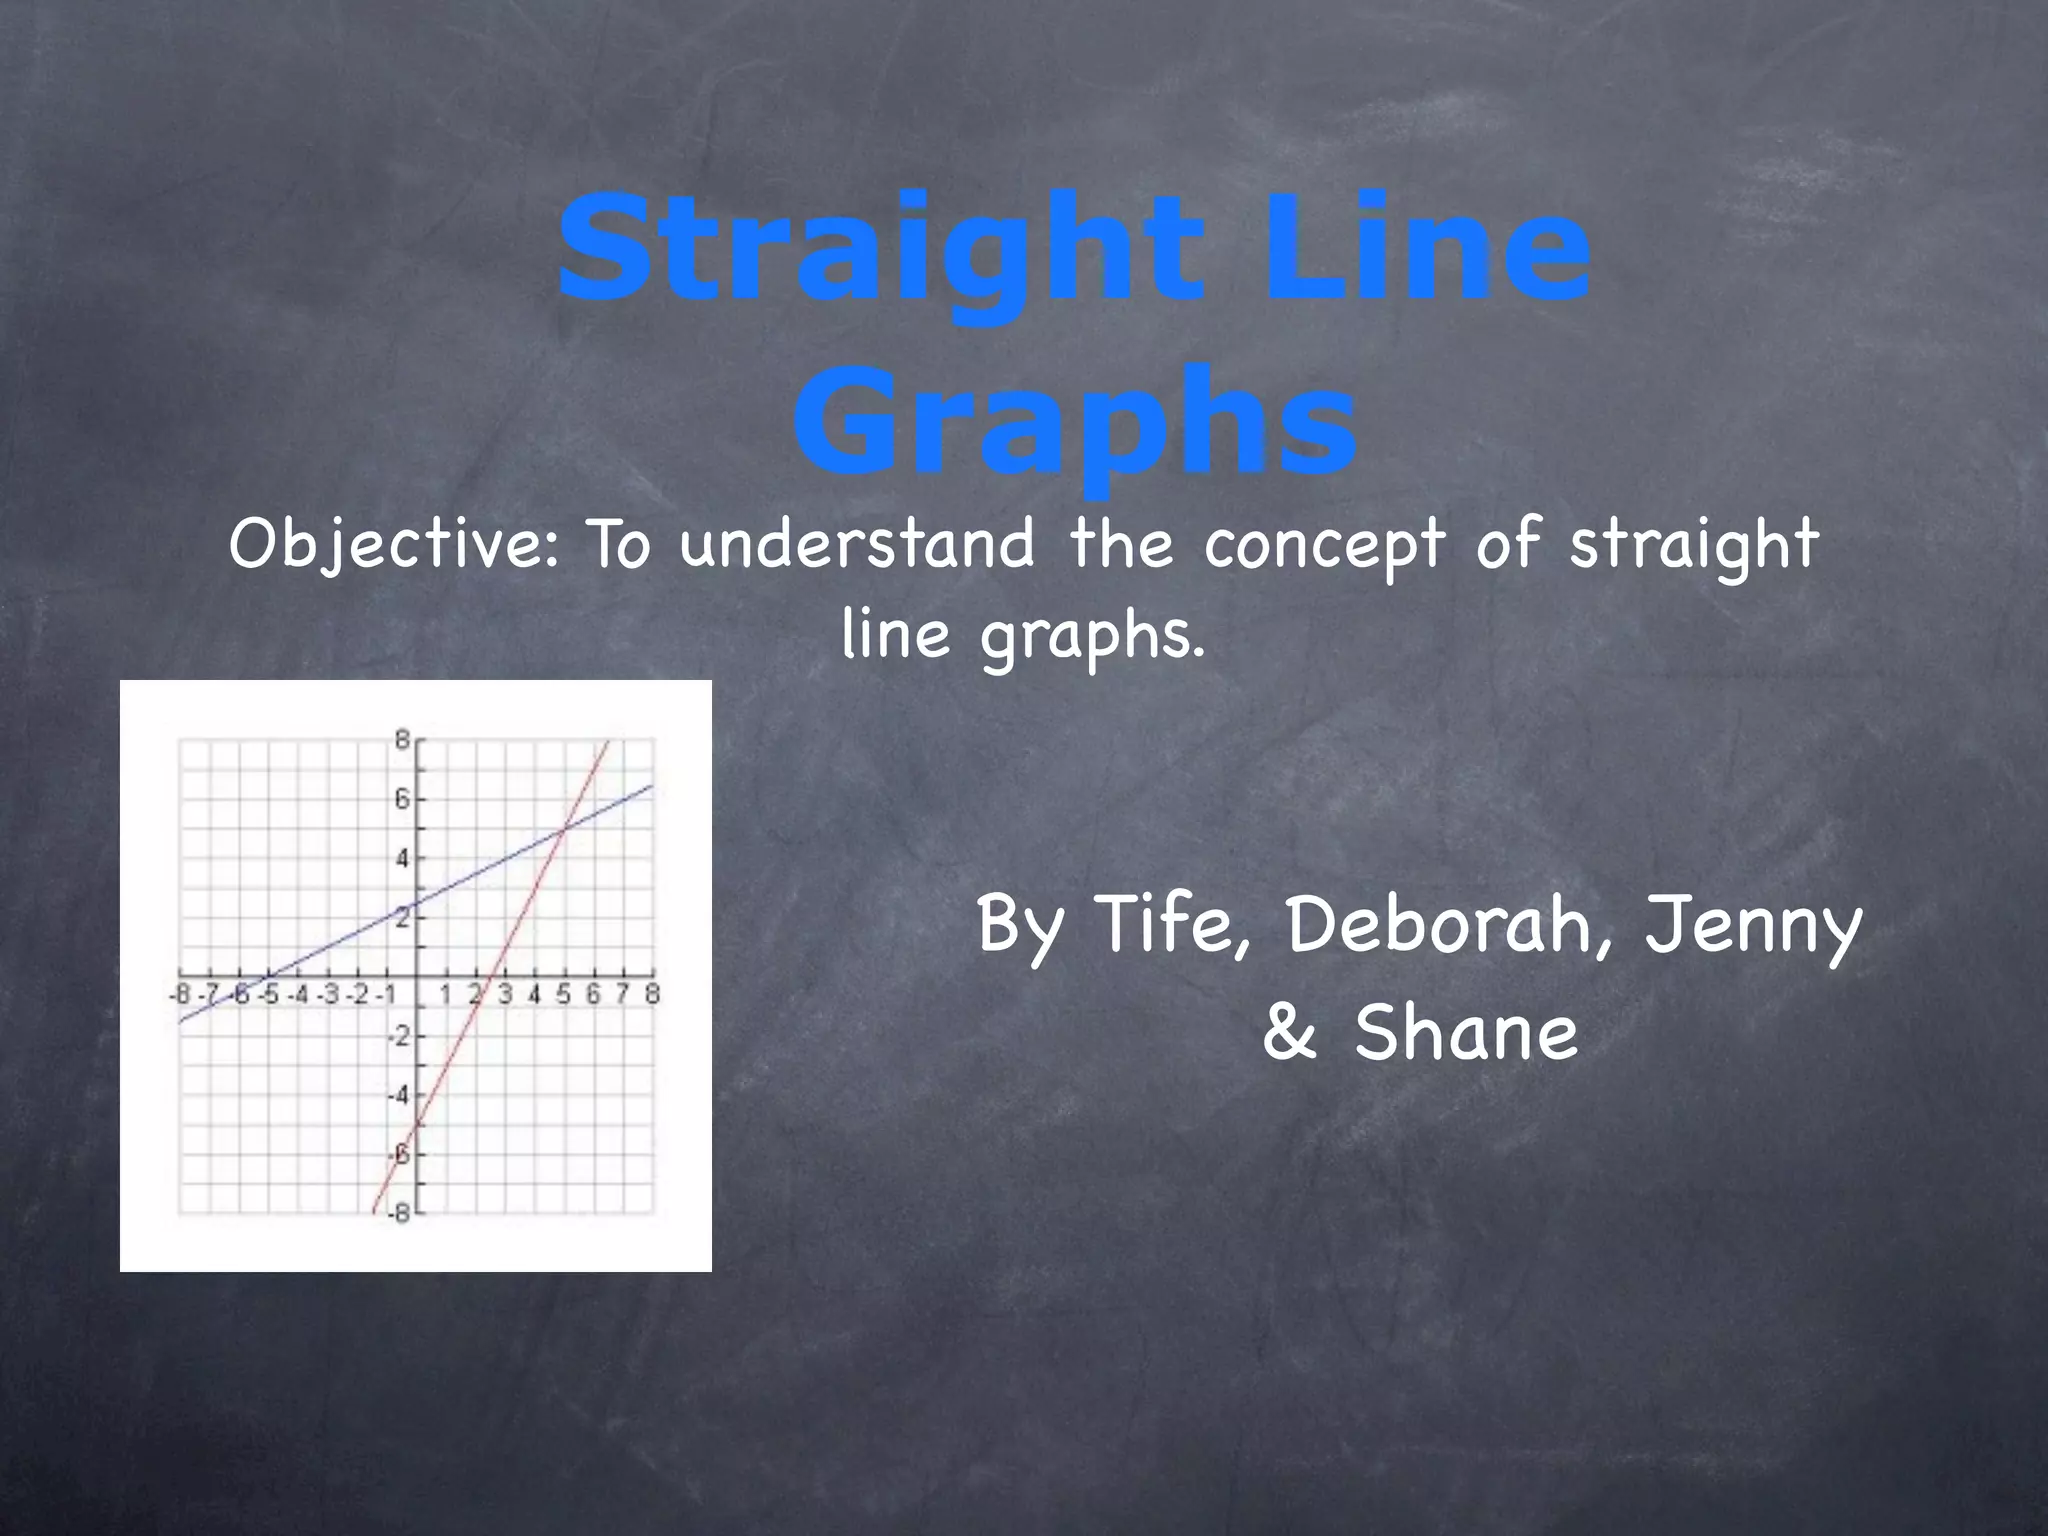
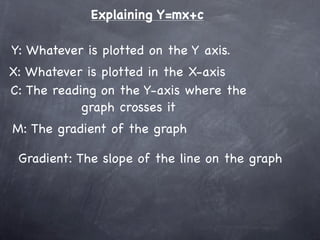
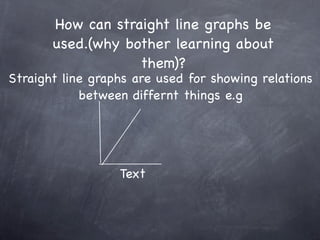
Straight line graphs use the equation y=mx+c, where m is the gradient or slope of the line and c is the y-intercept. The document explains key terms like x, y, m, and c used in straight line graphs and provides examples of how straight line graphs can show relationships between different variables.