Download to read offline
![International Research Journal of Engineering and Technology (IRJET) e-ISSN: 2395-0056
Volume: 09 Issue: 11 | Nov 2022 www.irjet.net p-ISSN: 2395-0072
© 2022, IRJET | Impact Factor value: 7.529 | ISO 9001:2008 Certified Journal | Page 671
Faraz et al. (2020) have used AE-LSTM for the prediction
of the closing price of S&P stocks. The autoencoders are
trained to provide a reduced representation of the data by
giving importance to appropriate aspects of the data. The
reduced representation is then fed to an LSTM-based
forecasting network to predict the closing price of the next
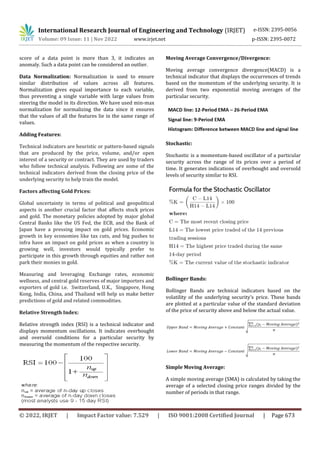
day. Technical indicators like MACD, RSI, SMA, etc are
added as features apart from OHLC and Volume. The
authors have performed various things as part of data
preprocessing - converting data to stationary time series
data, using wavelet transform to denoise the data,
removing outliers by the z-score method, and normalizing
data using the min-max normalization method. The
proposed method performs better than GANs in predicting
the next day's closing price as depicted in the paper. After
predicting the next day's closing price, buy/sell signal is
generated by following a pair of simple rules.
Ghosh et al. (2021) [2] used 2 methods - cuDNNLSTM and
Random Forest to predict the probability of the stock
giving intraday returns greater than the cross-sectional
median intraday returns of all the stocks at time t. Data
from the S&P 500 for the period from 1990 to 2018 is
considered. The data is broken down by taking windows of
size 4 years and stride of 1 year. In each window,
approximately 3 years’ worth of data is used for training
and the rest for testing. 3 types of features are derived for
each stock at time t - intraday returns for m days, returns
with respect to closing price m days prior, and return with
respect to opening price m days prior. The authors have
chosen 31 values of m, thus there are a total of 93 features.
Random forest uses these 93 features, and LSTM derives
its 3 features from 93 features by using Robust Scaler
Standardization. Their setting involving LSTM obtains
daily returns of 0.64% and that involving Random Forest
obtains 0.54% daily returns, both prior to transaction
costs.
Tomar et al. (2020) [3] have used various variants of
LSTM (Slim Variants) for predicting next-minute price
movements (binary classification, 1 for buy and 0 for sell).
The variants are then compared using measures such as
precision, recall, F1 score, and AUC.
Mabrouk et al. (2022) [4] used a model that stacked CNN
Layer, GRU Layer, and Dense Layer upon the Input Layer
to predict whether to buy, sell or hold a currency using
one-hot encoding. The input layer contains a 2d matrix in
which each row contains observation of all features of a
particular currency on a specific day. Feature selection
techniques were used to reduce the number of features
from 150 to less than 30 important input features.
Technical indicators are also included in these features.
Paspanthong et al. (2019) [5] experimented with various
models with the aim of predicting the next-minute price
movements (binary classification, 1 for buy and 0 for sell).
Statistically, significant features like SMA, Crossovers,
Consecutive Price Trends, etc were selected using Lasso
regularization. SPDR S&P 500 Trust (NYSE: SPY) dataset
with 1-minute intervals from March 1st until May 24th,
2019. Models like logistic regression, CNN, RNN, LSTM,
and SVM were used. SVM that used Polynomial kernels
obtained the best accuracy and gave the best returns
among other models. The authors highlight that higher
accuracy might not always mean greater returns since
there can be greater instances of small profits and fewer
instances of huge losses. Future scopes as discussed in this
paper are - modifying models to take into account the
magnitude of profit/loss, assigning weights to different
stocks based on their predicted probability, and trading
accordingly.
Hamoudi and Elseif (2021) [6] tested two types of models
- 3 LSTM and 2 CNN which differed in their architecture.
Only the top k (e.g. - 10) percentile of all the trades were
labeled as positive trades for training purposes which is
consistent with the study of S&P 500 historical returns
according to which 10 days in a year are responsible for
generating an average of 50% of the total market return of
that year and 50 days responsible for about 93%. The
dataset is extracted from the Jane Street Market Prediction
competition on Kaggle. The authors chose to use a rolling
cross-validation approach owing to the sequential nature
of the dataset. The models are then trained after replacing
missing data points with feature median and normalizing
the data. The models are then compared on the basis of
measures like precision, recall, and F1 score and using
financial performance metrics like the number of trades,
Sharpe ratio, Total return, etc. LSTM256x128 was found to
be the best among all the other models that were tested
with almost double the total returns than any other model.
Miao (2020) [6] employed LSTM to predict the closing
price of Amazon, Google, and Facebook after rescaling the
data. The author confined the scope to only 3 stocks so
that there is no unnecessary influence due to other
industries. The author experimented by varying the
hyperparameters of the LSTM like layers, dropout, batch
size, and epoch, and compared them on the basis of RMSE
on the 3 datasets.
3. PROPOSED SYSTEM
3.1 Problem Statement
To implement a model that analyzes the daily prices of all
the stocks in an index and predicts trends in the closing](https://image.slidesharecdn.com/irjet-v9i11142-221208101458-8dc63518/85/Stock-Market-Prediction-Using-Deep-Learning-2-320.jpg)
![International Research Journal of Engineering and Technology (IRJET) e-ISSN: 2395-0056
Volume: 09 Issue: 11 | Nov 2022 www.irjet.net p-ISSN: 2395-0072
© 2022, IRJET | Impact Factor value: 7.529 | ISO 9001:2008 Certified Journal | Page 676
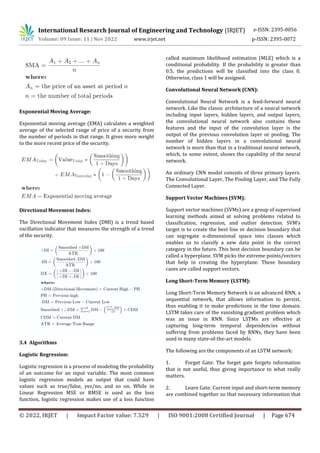
Training: Based on the current conditions and possible
actions and long term goals , the model takes action . And
based on its action the model will be punished or
rewarded.
The model continues to learn.
The best solution is determined based on the maximum
reward.
Few basic elements of an RL problem:
Environment — The physical world in which the agent
operates and will receive feedback from .
State — Explains the current situation of the agent
Reward — Feedback received from the environment
based on the action
Policy — This helps in choosing which actions to take
based on one's current state.
Value — Long term reward that the model aims to achieve
4. CONCLUSION
In this research paper we have provided an overview of
the relevant research that has been carried out in similar
fields. We provide a review and relative study of different
deep learning models that have been used for the purpose
of predicting stock market prices. The purpose of a stock
market price prediction system is to analyze current
trends and predict prices. This will help shortlist probable
winning trades thereby providing profits.
REFERENCES
[1] M. Faraz, H. Khaloozadeh and M. Abbasi, "Stock
Market Prediction-by-Prediction Based on Autoencoder
Long Short-Term Memory Networks," 2020 28th Iranian
Conference on Electrical Engineering (ICEE), 2020, pp. 1-5,
doi: 10.1109/ICEE50131.2020.9261055.
[2] Ghosh, P., Neufeld, A., & Sahoo, J. K. (2020).
Forecasting directional movements of stock prices for
intraday trading using LSTM and random forests. arXiv.
https://doi.org/10.48550/arXiv.2004.10178
[3] G. Taroon, A. Tomar, C. Manjunath, M.
Balamurugan, B. Ghosh and A. V. N. Krishna, "Employing
Deep Learning In Intraday Stock Trading," 2020 Fifth
International Conference on Research in Computational
Intelligence and Communication Networks (ICRCICN),
2020, pp. 209-214, doi:
10.1109/ICRCICN50933.2020.9296174.
[4] Nabil MABROUK, Marouane CHIHAB, Zakaria
HACHKAR and Younes CHIHAB, “Intraday Trading
Strategy based on Gated Recurrent Unit and Convolutional
Neural Network: Forecasting Daily Price Direction”
International Journal of Advanced Computer Science and
Applications(IJACSA), 13(3), 2022.
http://dx.doi.org/10.14569/IJACSA.2022.0130369
[5] Art Paspanthong, Nick Tantivasadakarn and Will
Vithayapalert. (2019). Machine Learning in Intraday Stock
Trading. Computer Science Department, Stanford
University.
[6] Hamdy Hamoudi and Mohamed A Elseif. (2021).
Stock Market Prediction using CNN and LSTM. Computer
Science Department, Stanford University.
[7] Yan Miao. (2020). A Deep Learning Approach for
Stock Market Prediction. Computer Science Department,
Stanford University.
[8] https://www.motilaloswal.com/blog-
details/What-factors-impact-the-price-of-gold-in-the-
global-markets/1310
[9] https://www.bankbazaar.com/gold-rate/top-5-
factors-that-affect-gold-rate-in-india.html
BIOGRAPHIES
Aayush Shah, B. Tech Student,
Dept. of Computer Engineering
and IT, VJTI College, Mumbai,
Maharashtra, India.
Mann Doshi, B. Tech Student,
Dept. of Computer Engineering
and IT, VJTI College, Mumbai,
Maharashtra, India
Meet Parekh, B. Tech Student,
Dept. of Computer Engineering
and IT, VJTI College, Mumbai,
Maharashtra, India.](https://image.slidesharecdn.com/irjet-v9i11142-221208101458-8dc63518/85/Stock-Market-Prediction-Using-Deep-Learning-7-320.jpg)


This document summarizes research on using deep learning techniques to predict stock market prices. Specifically, it discusses prior research that has used models like LSTM, CNN, random forest and logistic regression with technical indicators as inputs to predict stock prices, trends and trading signals. It also outlines some of the challenges in making accurate stock predictions, such as accessing reliable market data and accounting for the large volume of time series data. The literature review covers several papers that have developed and evaluated deep learning models for stock prediction and generated trading signals.