Download to read offline

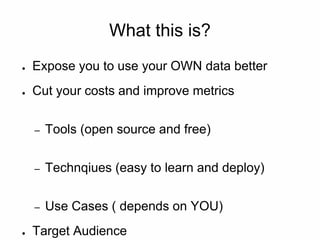

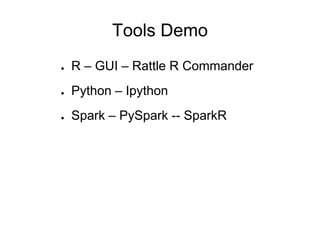


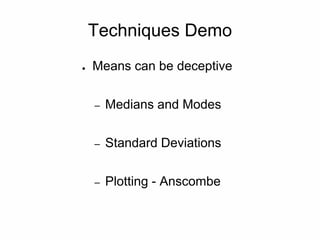


This document provides an overview of analyzing data using open source tools and techniques to cut costs and improve metrics. It demonstrates tools like R, Python, and Spark that can be used for tasks like data exploration, predictive modeling, and clustering. Common techniques are discussed like examining median, mode, and standard deviation instead of just means. The document also gives examples of use cases like churn prediction, conversion propensity, and web/social network analytics. It concludes by encouraging the systematic collection and use of data to make decisions and that visualizing data through graphs is very helpful.