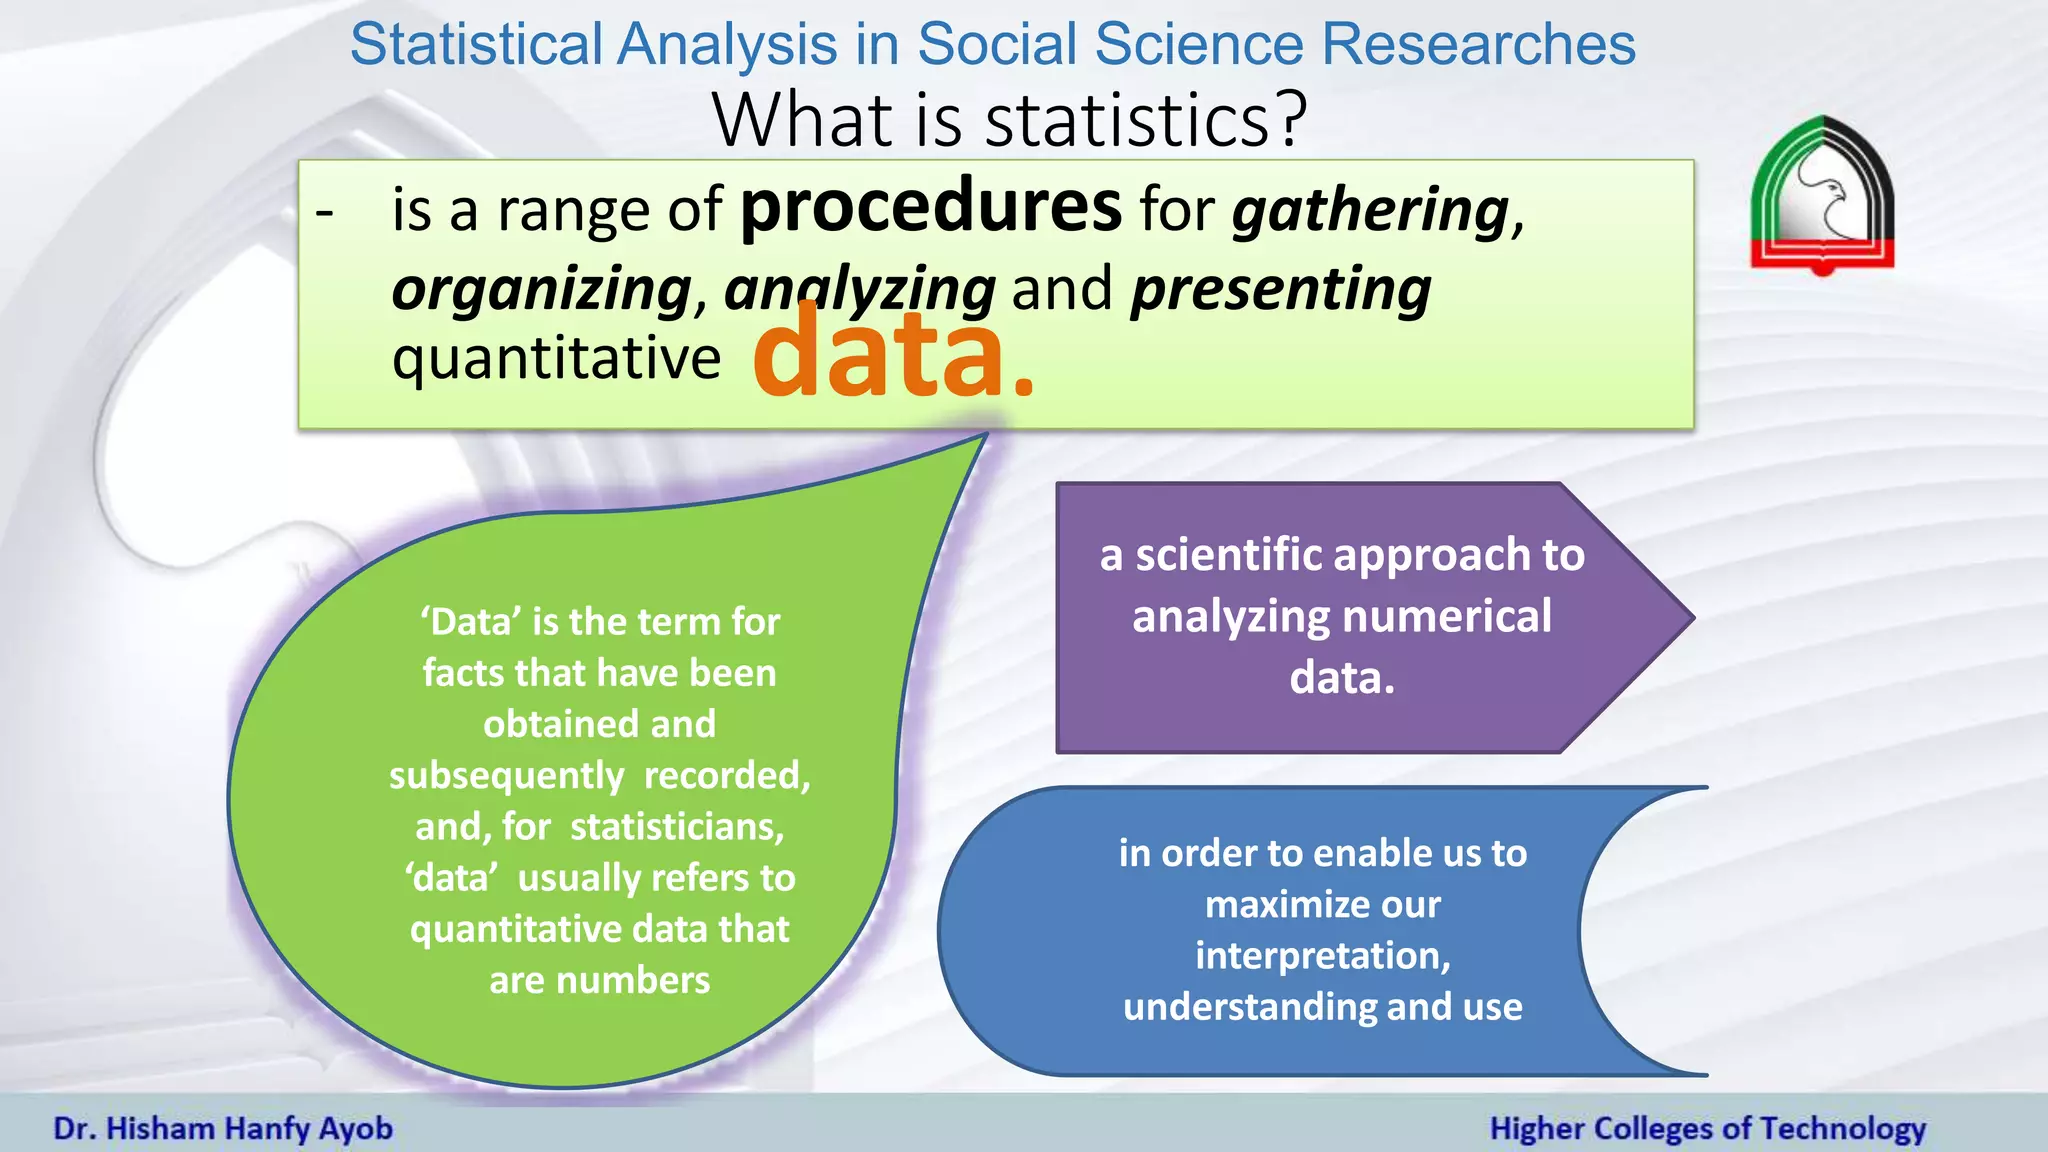
SlideShare a Scribd company logo
Statistical Analysis in Social Science Researches
 What is Statistics?
 Why we Need Statistics in Research?
 Where we Need to use Statistical Analysis tools in Research?
 Important Items to Consider in Choosing a Particular Analysis
 Structure of Statistical Analysis
Statistical Analysis in Social Science Researches
- is a range of procedures for gathering,
organizing, analyzing and presenting
What is statistics?
‘Data’ is the term for
facts that have been
obtained and
subsequently recorded,
and, for statisticians,
‘data’ usually refers to
quantitative data that
are numbers
a scientific approach to
analyzing numerical
data.
in order to enable us to
maximize our
interpretation,
understanding and use
quantitative data.
Statistical Analysis in Social Science Researches
Why you need to
use statistics
in your
research?
Statistical Analysis in Social Science Researches
Why you need to use statistical analysis
Tools in your research?
 measure things;
 examine relationships;
 make predictions;
 test hypotheses;
 construct concepts and
develop theories;
 explore issues;
 explain activities or
 attitudes;
 describe what is happening;
 present information;
 make comparisons to find
similarities and differences;
 draw conclusions about
populations based only on
sample results.
Statistical Analysis in Social Science Researches
Where we Need to use Statistical Analysis tools in Research?
Inform
Others
Interpret
Data
Analyze
Data
Collect
Data
Design
Study
Focus
Question
Select
Topic
Pre-Test
Analysis
Tools
validity
and
reliability
Statistical Analysis in Social Science Researches
Important items to consider in
choosing a particular analysis
If the problem requires for the data to be
summarized and described
If the problem requires for an inference to
be made
If the problem requires for data to be
classified or pattern determined
Descriptive
Statistics
Inferential
Statistics
Exploratory
Statistics
 The problem or the specific objective
Statistical Analysis in Social Science Researches
Important items to consider in
choosing a particular analysis
 The type of data set
Discrete Data (counts, ranks)
Non-Parametric Tests
Continuous Data (ratio, interval)
Parametric Tests
Statistical Analysis in Social Science Researches
Important items to consider in
choosing a particular analysis
 Number of Variables
There are different tests for 2 variables and > 2 variables
Statistical Analysis in Social Science Researches
 The population where the samples were taken
Dependent Population
data of variables to be compared were taken from the same
population (e.g. before and after experiment measurements)
Independent Population
data of variables to be compared were taken from two separate
and distinct population
Important items to consider in
choosing a particular analysis
Statistical Analysis in Social Science Researches
Structure of Statistical Analysis
Statistical Analysis in Social Science Researches
Structure of Statistical Analysis
Descriptive Statistics
• Summarizing Data
• Frequency (For discrete data
sets usually but there are also
instances wherein continuous
data sets are summarized into
frequency tables)
• Central Tendencies
• Mean
• Median
• Mode
Statistical Analysis in Social Science Researches
Descriptive Statistics
• Summarizing Data
• Measures of Dispersion
(variations among the
data)
• Range (minimum
and maximum
values)
• Standard Deviation
(measure of
precision: “how close
are your
measurements”)
• Confidence Interval
(measure of accuracy:
“how close are you to
the true value”)
Structure of Statistical Analysis
Statistical Analysis in Social Science Researches
Structure of Statistical Analysis
Inferential Statistics
Significant relationships
are determined by rejecting
the null hypothesis and
accepting the alternative
hypothesis
Ho: Variable A =
Variable B
H1: Variable A =
Variable B
Statistical Analysis in Social Science Researches
Structure of Statistical Analysis
Inferential Statistics
Null hypothesis are
rejected if:
computed statistics is
greater than the table
(critical) value at 
(for manual
computation)
probability value is less
than 
(computer generated)
 is the confidence level
(usually set at 95% or 0.05)
Statistical Analysis in Social Science Researches
Structure of Statistical Analysis
Statistical Analysis in Social Science Researches
Structure of Statistical Analysis
Inferential Statistics
Comparing Frequency
Tables
Observed Frequency
Table vs Theoretical
Distribution
Chi Square Test (X2):
Goodness of Fit Test
2 or more Observed
Frequency Tables
Chi Square Test (X2):
Contingency Table
Chi Square Test for
Independence
Statistical Analysis in Social Science Researches
Structure of Statistical Analysis
Statistical Analysis in Social Science Researches
Structure of Statistical Analysis
Inferential Statistics
Relationship between two
variables
Continuous Data
Pearson Product Moment
Correlation (r)
Scatter plot
Rank Data Set
Spearman Rank Correlation (r)
If r approaches 1 : the
relationship is directly
proportional
If r approaches 0 : there is no
relationship
If r approaches -1: the
relationship is inversely
The Spearman rank-order correlation is used when
both variables are at least ordinal scales of
measurement, but one is not sure that both would
qualify as interval or ratio scales of measurement.
Remember that a Pearson product-moment
correlation is an index of the degree
of linear relationship between two variables.
That is, the correlation gives an indication of how
closely the points in a scatter plot cluster around
a straight line. But the relationship between two
variables is not always linear.
Statistical Analysis in Social Science Researches
Structure of Statistical Analysis
Statistical Analysis in Social Science Researches
Structure of Statistical Analysis
Inferential Statistics
 To predict values for Y variable given a value for X variable
Regression analysis
For a simple linear regression (y = a + bX), the analysis will determine the a and b values in
the equation
In principle, the regression analysis can only predict values with the range of the values
of the samples used in the correlation.
Statistical Analysis in Social Science Researches
Structure of Statistical Analysis
Statistical Analysis in Social Science Researches
Structure of Statistical Analysis
Statistical Analysis in Social Science Researches
Structure of Statistical Analysis
Statistical Analysis in Social Science Researches
Structure of Statistical Analysis
Statistical Analysis in Social Science Researches
Structure of Statistical Analysis
Exploratory Statistics
Cluster Analysis
Cluster Analysis develops artificial groupings based on an
index of dissimilarity generated from the occurrence or
weight of attributes in the variables being studied.
Statistical Analysis in Social Science Researches
Thank you

More Related Content

Similar to Statistical Analysis in Social Science Researches.pptx

Maths ppt
Maths pptMaths ppt
Choosing Appropriate Statistical Tools in research.pptx
Choosing Appropriate Statistical Tools in research.pptxChoosing Appropriate Statistical Tools in research.pptx
Choosing Appropriate Statistical Tools in research.pptx
Epoy15
 
Descriptive Analysis.pptx
Descriptive Analysis.pptxDescriptive Analysis.pptx
Descriptive Analysis.pptx
Parveen Vashisth
 
Biostatistics
BiostatisticsBiostatistics
Quantitative Research-statistics.pdf
Quantitative Research-statistics.pdfQuantitative Research-statistics.pdf
Quantitative Research-statistics.pdf
Sameena Siddique
 
MELJUN CORTES research lectures_evaluating_data_statistical_treatment
MELJUN CORTES research lectures_evaluating_data_statistical_treatmentMELJUN CORTES research lectures_evaluating_data_statistical_treatment
MELJUN CORTES research lectures_evaluating_data_statistical_treatment
MELJUN CORTES
 
Basic Statistics & Data Analysis
Basic Statistics & Data AnalysisBasic Statistics & Data Analysis
Basic Statistics & Data Analysis
Ajendra Sharma
 
Medical Statistics.pptx
Medical Statistics.pptxMedical Statistics.pptx
Medical Statistics.pptx
Siddanna B Chougala C
 
Statistics as a discipline
Statistics as a disciplineStatistics as a discipline
Statistics as a discipline
RosalinaTPayumo
 
IDS-Unit-II. bachelor of computer applicatio notes
IDS-Unit-II. bachelor of computer applicatio notesIDS-Unit-II. bachelor of computer applicatio notes
IDS-Unit-II. bachelor of computer applicatio notes
AnkurTiwari813070
 
Research and Statistics Report- Estonio, Ryan.pptx
Research  and Statistics Report- Estonio, Ryan.pptxResearch  and Statistics Report- Estonio, Ryan.pptx
Research and Statistics Report- Estonio, Ryan.pptx
RyanEstonio
 
Analysis and Interpretation of Data
Analysis and Interpretation of DataAnalysis and Interpretation of Data
Analysis and Interpretation of Data
Multan Post Graduate College, Multan
 
April Heyward Research Methods Class Session - 8-5-2021
April Heyward Research Methods Class Session - 8-5-2021April Heyward Research Methods Class Session - 8-5-2021
April Heyward Research Methods Class Session - 8-5-2021
April Heyward
 
Data Analysis with SPSS PPT.pdf
Data Analysis with SPSS PPT.pdfData Analysis with SPSS PPT.pdf
Data Analysis with SPSS PPT.pdf
Thanavathi C
 
Data Analysis
Data Analysis Data Analysis
Data Analysis
DawitDibekulu
 
Lect 1_Biostat.pdf
Lect 1_Biostat.pdfLect 1_Biostat.pdf
Lect 1_Biostat.pdf
BirhanTesema
 
SOC2002 Lecture 11
SOC2002 Lecture 11SOC2002 Lecture 11
SOC2002 Lecture 11
Bonnie Green
 
Need a nonplagiarised paper and a form completed by 1006015 before.docx
Need a nonplagiarised paper and a form completed by 1006015 before.docxNeed a nonplagiarised paper and a form completed by 1006015 before.docx
Need a nonplagiarised paper and a form completed by 1006015 before.docx
lea6nklmattu
 
Data Analysis & Interpretation and Report Writing
Data Analysis & Interpretation and Report WritingData Analysis & Interpretation and Report Writing
Data Analysis & Interpretation and Report Writing
SOMASUNDARAM T
 
SIGIR2016
SIGIR2016SIGIR2016
SIGIR2016
Tetsuya Sakai
 

Similar to Statistical Analysis in Social Science Researches.pptx (20)

Maths ppt
Maths pptMaths ppt
Maths ppt
 
Choosing Appropriate Statistical Tools in research.pptx
Choosing Appropriate Statistical Tools in research.pptxChoosing Appropriate Statistical Tools in research.pptx
Choosing Appropriate Statistical Tools in research.pptx
 
Descriptive Analysis.pptx
Descriptive Analysis.pptxDescriptive Analysis.pptx
Descriptive Analysis.pptx
 
Biostatistics
BiostatisticsBiostatistics
Biostatistics
 
Quantitative Research-statistics.pdf
Quantitative Research-statistics.pdfQuantitative Research-statistics.pdf
Quantitative Research-statistics.pdf
 
MELJUN CORTES research lectures_evaluating_data_statistical_treatment
MELJUN CORTES research lectures_evaluating_data_statistical_treatmentMELJUN CORTES research lectures_evaluating_data_statistical_treatment
MELJUN CORTES research lectures_evaluating_data_statistical_treatment
 
Basic Statistics & Data Analysis
Basic Statistics & Data AnalysisBasic Statistics & Data Analysis
Basic Statistics & Data Analysis
 
Medical Statistics.pptx
Medical Statistics.pptxMedical Statistics.pptx
Medical Statistics.pptx
 
Statistics as a discipline
Statistics as a disciplineStatistics as a discipline
Statistics as a discipline
 
IDS-Unit-II. bachelor of computer applicatio notes
IDS-Unit-II. bachelor of computer applicatio notesIDS-Unit-II. bachelor of computer applicatio notes
IDS-Unit-II. bachelor of computer applicatio notes
 
Research and Statistics Report- Estonio, Ryan.pptx
Research  and Statistics Report- Estonio, Ryan.pptxResearch  and Statistics Report- Estonio, Ryan.pptx
Research and Statistics Report- Estonio, Ryan.pptx
 
Analysis and Interpretation of Data
Analysis and Interpretation of DataAnalysis and Interpretation of Data
Analysis and Interpretation of Data
 
April Heyward Research Methods Class Session - 8-5-2021
April Heyward Research Methods Class Session - 8-5-2021April Heyward Research Methods Class Session - 8-5-2021
April Heyward Research Methods Class Session - 8-5-2021
 
Data Analysis with SPSS PPT.pdf
Data Analysis with SPSS PPT.pdfData Analysis with SPSS PPT.pdf
Data Analysis with SPSS PPT.pdf
 
Data Analysis
Data Analysis Data Analysis
Data Analysis
 
Lect 1_Biostat.pdf
Lect 1_Biostat.pdfLect 1_Biostat.pdf
Lect 1_Biostat.pdf
 
SOC2002 Lecture 11
SOC2002 Lecture 11SOC2002 Lecture 11
SOC2002 Lecture 11
 
Need a nonplagiarised paper and a form completed by 1006015 before.docx
Need a nonplagiarised paper and a form completed by 1006015 before.docxNeed a nonplagiarised paper and a form completed by 1006015 before.docx
Need a nonplagiarised paper and a form completed by 1006015 before.docx
 
Data Analysis & Interpretation and Report Writing
Data Analysis & Interpretation and Report WritingData Analysis & Interpretation and Report Writing
Data Analysis & Interpretation and Report Writing
 
SIGIR2016
SIGIR2016SIGIR2016
SIGIR2016
 

Recently uploaded

PIMS Job Advertisement 2024.pdf Islamabad
PIMS Job Advertisement 2024.pdf IslamabadPIMS Job Advertisement 2024.pdf Islamabad
PIMS Job Advertisement 2024.pdf Islamabad
AyyanKhan40
 
World environment day ppt For 5 June 2024
World environment day ppt For 5 June 2024World environment day ppt For 5 June 2024
World environment day ppt For 5 June 2024
ak6969907
 
Advanced Java[Extra Concepts, Not Difficult].docx
Advanced Java[Extra Concepts, Not Difficult].docxAdvanced Java[Extra Concepts, Not Difficult].docx
Advanced Java[Extra Concepts, Not Difficult].docx
adhitya5119
 
Liberal Approach to the Study of Indian Politics.pdf
Liberal Approach to the Study of Indian Politics.pdfLiberal Approach to the Study of Indian Politics.pdf
Liberal Approach to the Study of Indian Politics.pdf
WaniBasim
 
Pride Month Slides 2024 David Douglas School District
Pride Month Slides 2024 David Douglas School DistrictPride Month Slides 2024 David Douglas School District
Pride Month Slides 2024 David Douglas School District
David Douglas School District
 
Introduction to AI for Nonprofits with Tapp Network
Introduction to AI for Nonprofits with Tapp NetworkIntroduction to AI for Nonprofits with Tapp Network
Introduction to AI for Nonprofits with Tapp Network
TechSoup
 
June 3, 2024 Anti-Semitism Letter Sent to MIT President Kornbluth and MIT Cor...
June 3, 2024 Anti-Semitism Letter Sent to MIT President Kornbluth and MIT Cor...June 3, 2024 Anti-Semitism Letter Sent to MIT President Kornbluth and MIT Cor...
June 3, 2024 Anti-Semitism Letter Sent to MIT President Kornbluth and MIT Cor...
Levi Shapiro
 
writing about opinions about Australia the movie
writing about opinions about Australia the moviewriting about opinions about Australia the movie
writing about opinions about Australia the movie
Nicholas Montgomery
 
Lapbook sobre os Regimes Totalitários.pdf
Lapbook sobre os Regimes Totalitários.pdfLapbook sobre os Regimes Totalitários.pdf
Lapbook sobre os Regimes Totalitários.pdf
Jean Carlos Nunes Paixão
 
South African Journal of Science: Writing with integrity workshop (2024)
South African Journal of Science: Writing with integrity workshop (2024)South African Journal of Science: Writing with integrity workshop (2024)
South African Journal of Science: Writing with integrity workshop (2024)
Academy of Science of South Africa
 
How to Add Chatter in the odoo 17 ERP Module
How to Add Chatter in the odoo 17 ERP ModuleHow to Add Chatter in the odoo 17 ERP Module
How to Add Chatter in the odoo 17 ERP Module
Celine George
 
Film vocab for eal 3 students: Australia the movie
Film vocab for eal 3 students: Australia the movieFilm vocab for eal 3 students: Australia the movie
Film vocab for eal 3 students: Australia the movie
Nicholas Montgomery
 
Digital Artifact 1 - 10VCD Environments Unit
Digital Artifact 1 - 10VCD Environments UnitDigital Artifact 1 - 10VCD Environments Unit
Digital Artifact 1 - 10VCD Environments Unit
chanes7
 
CACJapan - GROUP Presentation 1- Wk 4.pdf
CACJapan - GROUP Presentation 1- Wk 4.pdfCACJapan - GROUP Presentation 1- Wk 4.pdf
CACJapan - GROUP Presentation 1- Wk 4.pdf
camakaiclarkmusic
 
Exploiting Artificial Intelligence for Empowering Researchers and Faculty, In...
Exploiting Artificial Intelligence for Empowering Researchers and Faculty, In...Exploiting Artificial Intelligence for Empowering Researchers and Faculty, In...
Exploiting Artificial Intelligence for Empowering Researchers and Faculty, In...
Dr. Vinod Kumar Kanvaria
 
RPMS TEMPLATE FOR SCHOOL YEAR 2023-2024 FOR TEACHER 1 TO TEACHER 3
RPMS TEMPLATE FOR SCHOOL YEAR 2023-2024 FOR TEACHER 1 TO TEACHER 3RPMS TEMPLATE FOR SCHOOL YEAR 2023-2024 FOR TEACHER 1 TO TEACHER 3
RPMS TEMPLATE FOR SCHOOL YEAR 2023-2024 FOR TEACHER 1 TO TEACHER 3
IreneSebastianRueco1
 
How to Build a Module in Odoo 17 Using the Scaffold Method
How to Build a Module in Odoo 17 Using the Scaffold MethodHow to Build a Module in Odoo 17 Using the Scaffold Method
How to Build a Module in Odoo 17 Using the Scaffold Method
Celine George
 
Biological Screening of Herbal Drugs in detailed.
Biological Screening of Herbal Drugs in detailed.Biological Screening of Herbal Drugs in detailed.
Biological Screening of Herbal Drugs in detailed.
Ashokrao Mane college of Pharmacy Peth-Vadgaon
 
Natural birth techniques - Mrs.Akanksha Trivedi Rama University
Natural birth techniques - Mrs.Akanksha Trivedi Rama UniversityNatural birth techniques - Mrs.Akanksha Trivedi Rama University
Natural birth techniques - Mrs.Akanksha Trivedi Rama University
Akanksha trivedi rama nursing college kanpur.
 
Aficamten in HCM (SEQUOIA HCM TRIAL 2024)
Aficamten in HCM (SEQUOIA HCM TRIAL 2024)Aficamten in HCM (SEQUOIA HCM TRIAL 2024)
Aficamten in HCM (SEQUOIA HCM TRIAL 2024)
Ashish Kohli
 

Recently uploaded (20)

PIMS Job Advertisement 2024.pdf Islamabad
PIMS Job Advertisement 2024.pdf IslamabadPIMS Job Advertisement 2024.pdf Islamabad
PIMS Job Advertisement 2024.pdf Islamabad
 
World environment day ppt For 5 June 2024
World environment day ppt For 5 June 2024World environment day ppt For 5 June 2024
World environment day ppt For 5 June 2024
 
Advanced Java[Extra Concepts, Not Difficult].docx
Advanced Java[Extra Concepts, Not Difficult].docxAdvanced Java[Extra Concepts, Not Difficult].docx
Advanced Java[Extra Concepts, Not Difficult].docx
 
Liberal Approach to the Study of Indian Politics.pdf
Liberal Approach to the Study of Indian Politics.pdfLiberal Approach to the Study of Indian Politics.pdf
Liberal Approach to the Study of Indian Politics.pdf
 
Pride Month Slides 2024 David Douglas School District
Pride Month Slides 2024 David Douglas School DistrictPride Month Slides 2024 David Douglas School District
Pride Month Slides 2024 David Douglas School District
 
Introduction to AI for Nonprofits with Tapp Network
Introduction to AI for Nonprofits with Tapp NetworkIntroduction to AI for Nonprofits with Tapp Network
Introduction to AI for Nonprofits with Tapp Network
 
June 3, 2024 Anti-Semitism Letter Sent to MIT President Kornbluth and MIT Cor...
June 3, 2024 Anti-Semitism Letter Sent to MIT President Kornbluth and MIT Cor...June 3, 2024 Anti-Semitism Letter Sent to MIT President Kornbluth and MIT Cor...
June 3, 2024 Anti-Semitism Letter Sent to MIT President Kornbluth and MIT Cor...
 
writing about opinions about Australia the movie
writing about opinions about Australia the moviewriting about opinions about Australia the movie
writing about opinions about Australia the movie
 
Lapbook sobre os Regimes Totalitários.pdf
Lapbook sobre os Regimes Totalitários.pdfLapbook sobre os Regimes Totalitários.pdf
Lapbook sobre os Regimes Totalitários.pdf
 
South African Journal of Science: Writing with integrity workshop (2024)
South African Journal of Science: Writing with integrity workshop (2024)South African Journal of Science: Writing with integrity workshop (2024)
South African Journal of Science: Writing with integrity workshop (2024)
 
How to Add Chatter in the odoo 17 ERP Module
How to Add Chatter in the odoo 17 ERP ModuleHow to Add Chatter in the odoo 17 ERP Module
How to Add Chatter in the odoo 17 ERP Module
 
Film vocab for eal 3 students: Australia the movie
Film vocab for eal 3 students: Australia the movieFilm vocab for eal 3 students: Australia the movie
Film vocab for eal 3 students: Australia the movie
 
Digital Artifact 1 - 10VCD Environments Unit
Digital Artifact 1 - 10VCD Environments UnitDigital Artifact 1 - 10VCD Environments Unit
Digital Artifact 1 - 10VCD Environments Unit
 
CACJapan - GROUP Presentation 1- Wk 4.pdf
CACJapan - GROUP Presentation 1- Wk 4.pdfCACJapan - GROUP Presentation 1- Wk 4.pdf
CACJapan - GROUP Presentation 1- Wk 4.pdf
 
Exploiting Artificial Intelligence for Empowering Researchers and Faculty, In...
Exploiting Artificial Intelligence for Empowering Researchers and Faculty, In...Exploiting Artificial Intelligence for Empowering Researchers and Faculty, In...
Exploiting Artificial Intelligence for Empowering Researchers and Faculty, In...
 
RPMS TEMPLATE FOR SCHOOL YEAR 2023-2024 FOR TEACHER 1 TO TEACHER 3
RPMS TEMPLATE FOR SCHOOL YEAR 2023-2024 FOR TEACHER 1 TO TEACHER 3RPMS TEMPLATE FOR SCHOOL YEAR 2023-2024 FOR TEACHER 1 TO TEACHER 3
RPMS TEMPLATE FOR SCHOOL YEAR 2023-2024 FOR TEACHER 1 TO TEACHER 3
 
How to Build a Module in Odoo 17 Using the Scaffold Method
How to Build a Module in Odoo 17 Using the Scaffold MethodHow to Build a Module in Odoo 17 Using the Scaffold Method
How to Build a Module in Odoo 17 Using the Scaffold Method
 
Biological Screening of Herbal Drugs in detailed.
Biological Screening of Herbal Drugs in detailed.Biological Screening of Herbal Drugs in detailed.
Biological Screening of Herbal Drugs in detailed.
 
Natural birth techniques - Mrs.Akanksha Trivedi Rama University
Natural birth techniques - Mrs.Akanksha Trivedi Rama UniversityNatural birth techniques - Mrs.Akanksha Trivedi Rama University
Natural birth techniques - Mrs.Akanksha Trivedi Rama University
 
Aficamten in HCM (SEQUOIA HCM TRIAL 2024)
Aficamten in HCM (SEQUOIA HCM TRIAL 2024)Aficamten in HCM (SEQUOIA HCM TRIAL 2024)
Aficamten in HCM (SEQUOIA HCM TRIAL 2024)
 

Statistical Analysis in Social Science Researches.pptx

  • 1. Statistical Analysis in Social Science Researches Statistical Analysis in Social Science Researches  What is Statistics?  Why we Need Statistics in Research?  Where we Need to use Statistical Analysis tools in Research?  Important Items to Consider in Choosing a Particular Analysis  Structure of Statistical Analysis
  • 2. Statistical Analysis in Social Science Researches - is a range of procedures for gathering, organizing, analyzing and presenting What is statistics? ‘Data’ is the term for facts that have been obtained and subsequently recorded, and, for statisticians, ‘data’ usually refers to quantitative data that are numbers a scientific approach to analyzing numerical data. in order to enable us to maximize our interpretation, understanding and use quantitative data.
  • 3. Statistical Analysis in Social Science Researches Why you need to use statistics in your research?
  • 4. Statistical Analysis in Social Science Researches Why you need to use statistical analysis Tools in your research?  measure things;  examine relationships;  make predictions;  test hypotheses;  construct concepts and develop theories;  explore issues;  explain activities or  attitudes;  describe what is happening;  present information;  make comparisons to find similarities and differences;  draw conclusions about populations based only on sample results.
  • 5. Statistical Analysis in Social Science Researches Where we Need to use Statistical Analysis tools in Research? Inform Others Interpret Data Analyze Data Collect Data Design Study Focus Question Select Topic Pre-Test Analysis Tools validity and reliability
  • 6. Statistical Analysis in Social Science Researches Important items to consider in choosing a particular analysis If the problem requires for the data to be summarized and described If the problem requires for an inference to be made If the problem requires for data to be classified or pattern determined Descriptive Statistics Inferential Statistics Exploratory Statistics  The problem or the specific objective
  • 7. Statistical Analysis in Social Science Researches Important items to consider in choosing a particular analysis  The type of data set Discrete Data (counts, ranks) Non-Parametric Tests Continuous Data (ratio, interval) Parametric Tests
  • 8. Statistical Analysis in Social Science Researches Important items to consider in choosing a particular analysis  Number of Variables There are different tests for 2 variables and > 2 variables
  • 9. Statistical Analysis in Social Science Researches  The population where the samples were taken Dependent Population data of variables to be compared were taken from the same population (e.g. before and after experiment measurements) Independent Population data of variables to be compared were taken from two separate and distinct population Important items to consider in choosing a particular analysis
  • 10. Statistical Analysis in Social Science Researches Structure of Statistical Analysis
  • 11. Statistical Analysis in Social Science Researches Structure of Statistical Analysis Descriptive Statistics • Summarizing Data • Frequency (For discrete data sets usually but there are also instances wherein continuous data sets are summarized into frequency tables) • Central Tendencies • Mean • Median • Mode
  • 12. Statistical Analysis in Social Science Researches Descriptive Statistics • Summarizing Data • Measures of Dispersion (variations among the data) • Range (minimum and maximum values) • Standard Deviation (measure of precision: “how close are your measurements”) • Confidence Interval (measure of accuracy: “how close are you to the true value”) Structure of Statistical Analysis
  • 13. Statistical Analysis in Social Science Researches Structure of Statistical Analysis Inferential Statistics Significant relationships are determined by rejecting the null hypothesis and accepting the alternative hypothesis Ho: Variable A = Variable B H1: Variable A = Variable B
  • 14. Statistical Analysis in Social Science Researches Structure of Statistical Analysis Inferential Statistics Null hypothesis are rejected if: computed statistics is greater than the table (critical) value at  (for manual computation) probability value is less than  (computer generated)  is the confidence level (usually set at 95% or 0.05)
  • 15. Statistical Analysis in Social Science Researches Structure of Statistical Analysis
  • 16. Statistical Analysis in Social Science Researches Structure of Statistical Analysis Inferential Statistics Comparing Frequency Tables Observed Frequency Table vs Theoretical Distribution Chi Square Test (X2): Goodness of Fit Test 2 or more Observed Frequency Tables Chi Square Test (X2): Contingency Table Chi Square Test for Independence
  • 17. Statistical Analysis in Social Science Researches Structure of Statistical Analysis
  • 18. Statistical Analysis in Social Science Researches Structure of Statistical Analysis Inferential Statistics Relationship between two variables Continuous Data Pearson Product Moment Correlation (r) Scatter plot Rank Data Set Spearman Rank Correlation (r) If r approaches 1 : the relationship is directly proportional If r approaches 0 : there is no relationship If r approaches -1: the relationship is inversely The Spearman rank-order correlation is used when both variables are at least ordinal scales of measurement, but one is not sure that both would qualify as interval or ratio scales of measurement. Remember that a Pearson product-moment correlation is an index of the degree of linear relationship between two variables. That is, the correlation gives an indication of how closely the points in a scatter plot cluster around a straight line. But the relationship between two variables is not always linear.
  • 19. Statistical Analysis in Social Science Researches Structure of Statistical Analysis
  • 20. Statistical Analysis in Social Science Researches Structure of Statistical Analysis Inferential Statistics  To predict values for Y variable given a value for X variable Regression analysis For a simple linear regression (y = a + bX), the analysis will determine the a and b values in the equation In principle, the regression analysis can only predict values with the range of the values of the samples used in the correlation.
  • 21. Statistical Analysis in Social Science Researches Structure of Statistical Analysis
  • 22. Statistical Analysis in Social Science Researches Structure of Statistical Analysis
  • 23. Statistical Analysis in Social Science Researches Structure of Statistical Analysis
  • 24. Statistical Analysis in Social Science Researches Structure of Statistical Analysis
  • 25. Statistical Analysis in Social Science Researches Structure of Statistical Analysis Exploratory Statistics Cluster Analysis Cluster Analysis develops artificial groupings based on an index of dissimilarity generated from the occurrence or weight of attributes in the variables being studied.
  • 26. Statistical Analysis in Social Science Researches Thank you