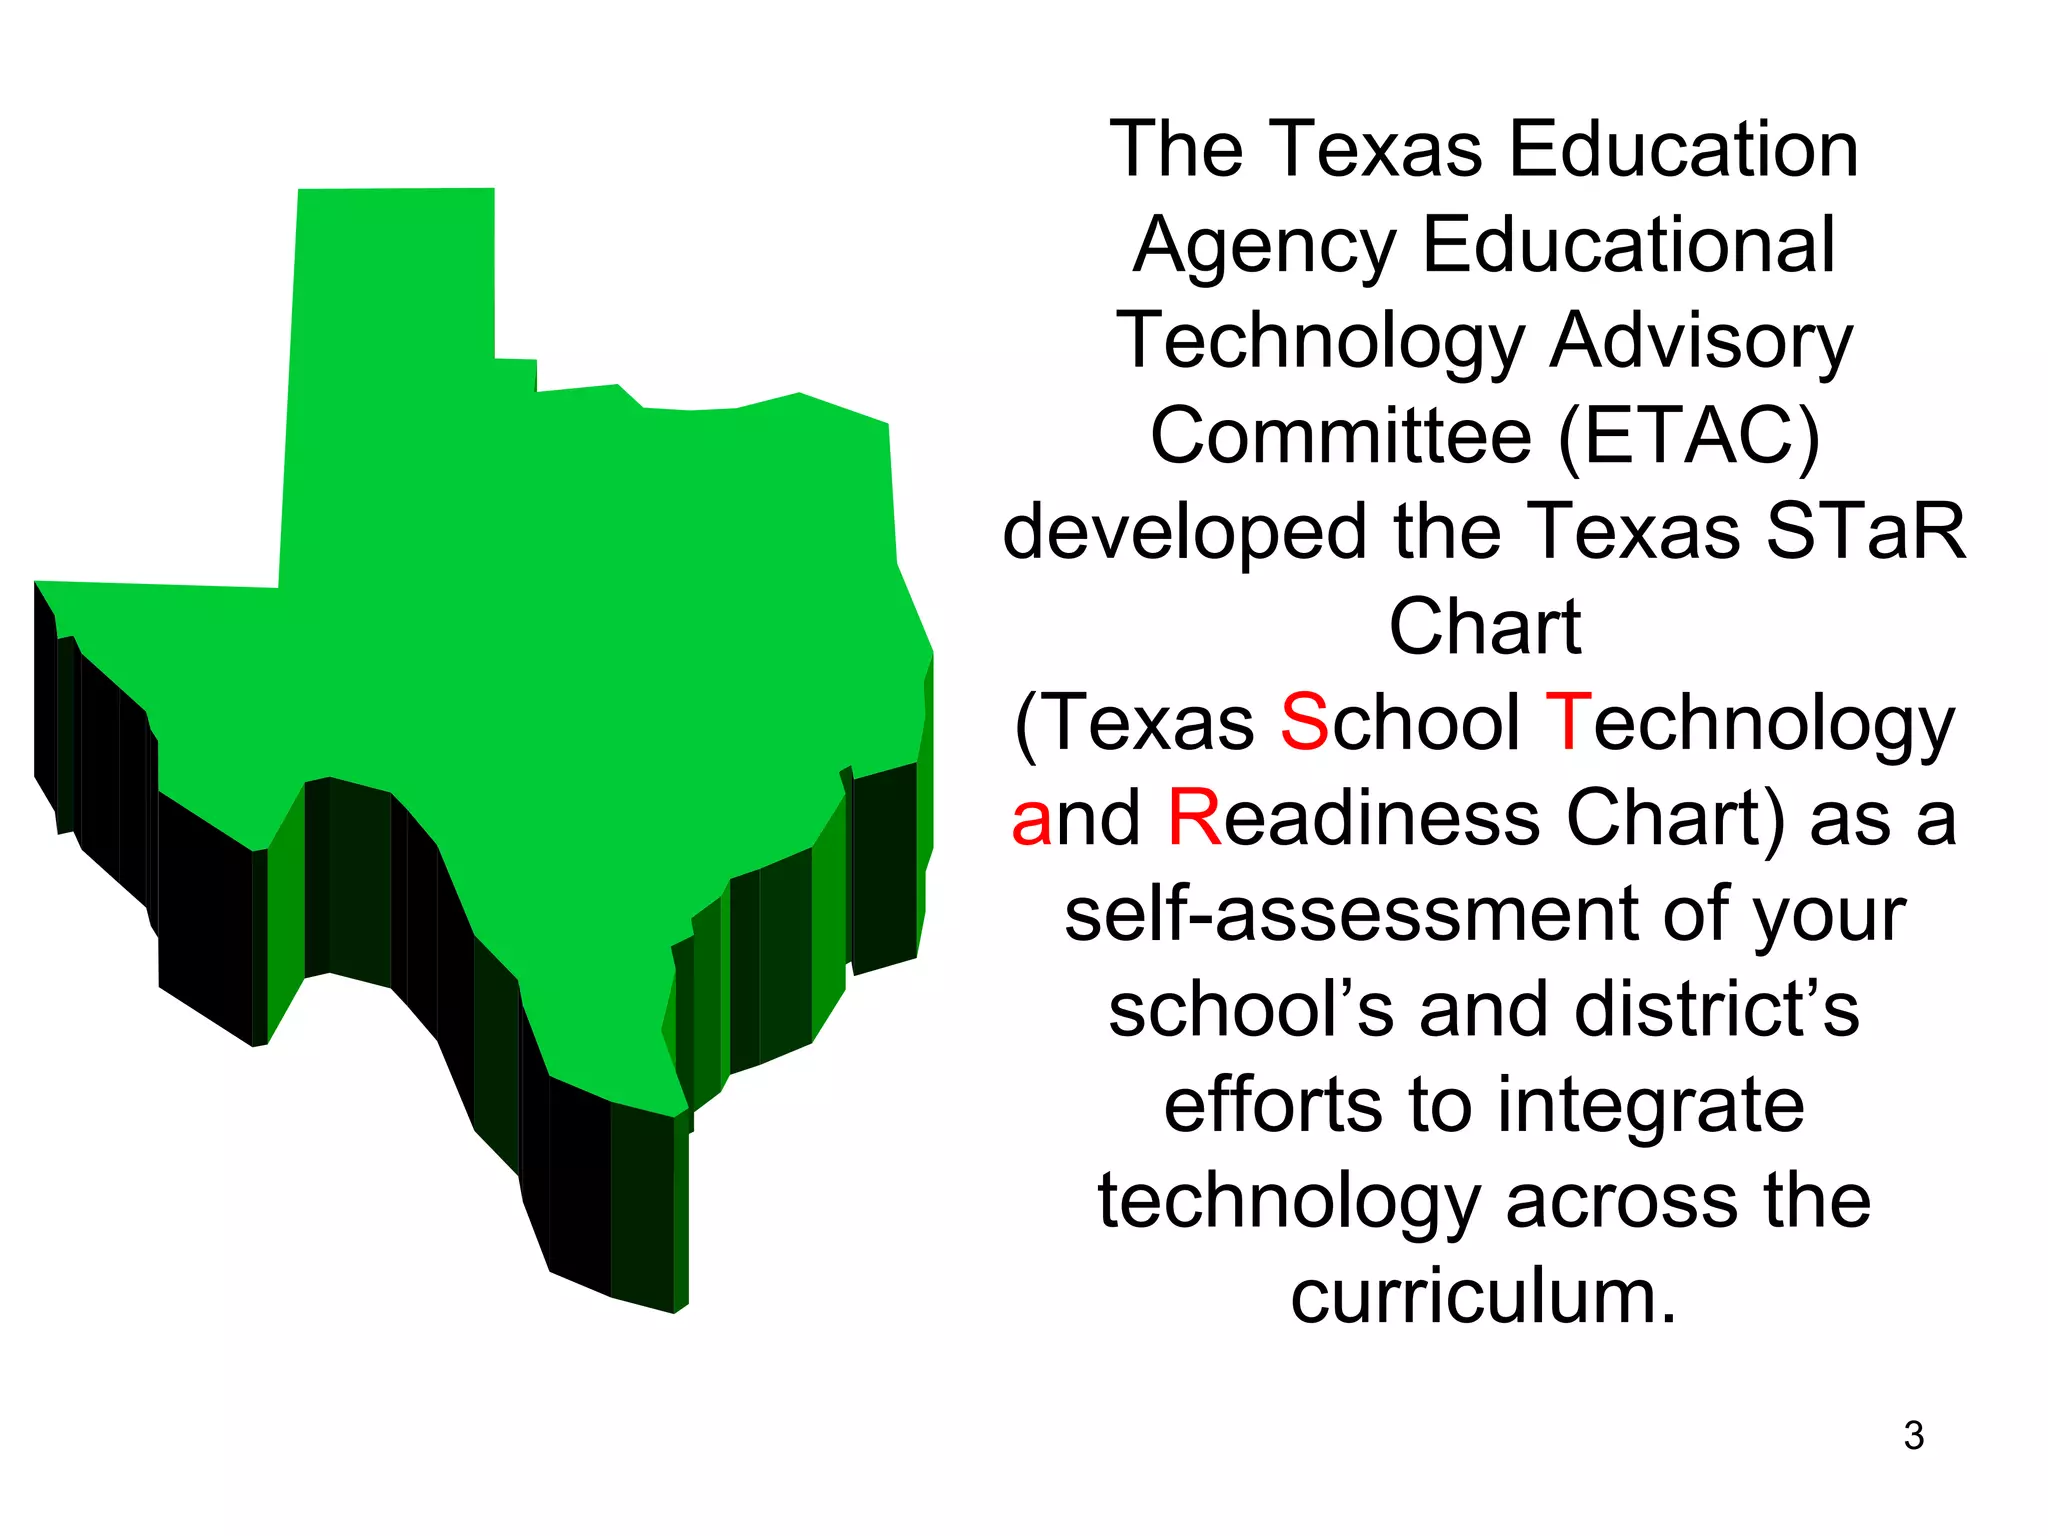
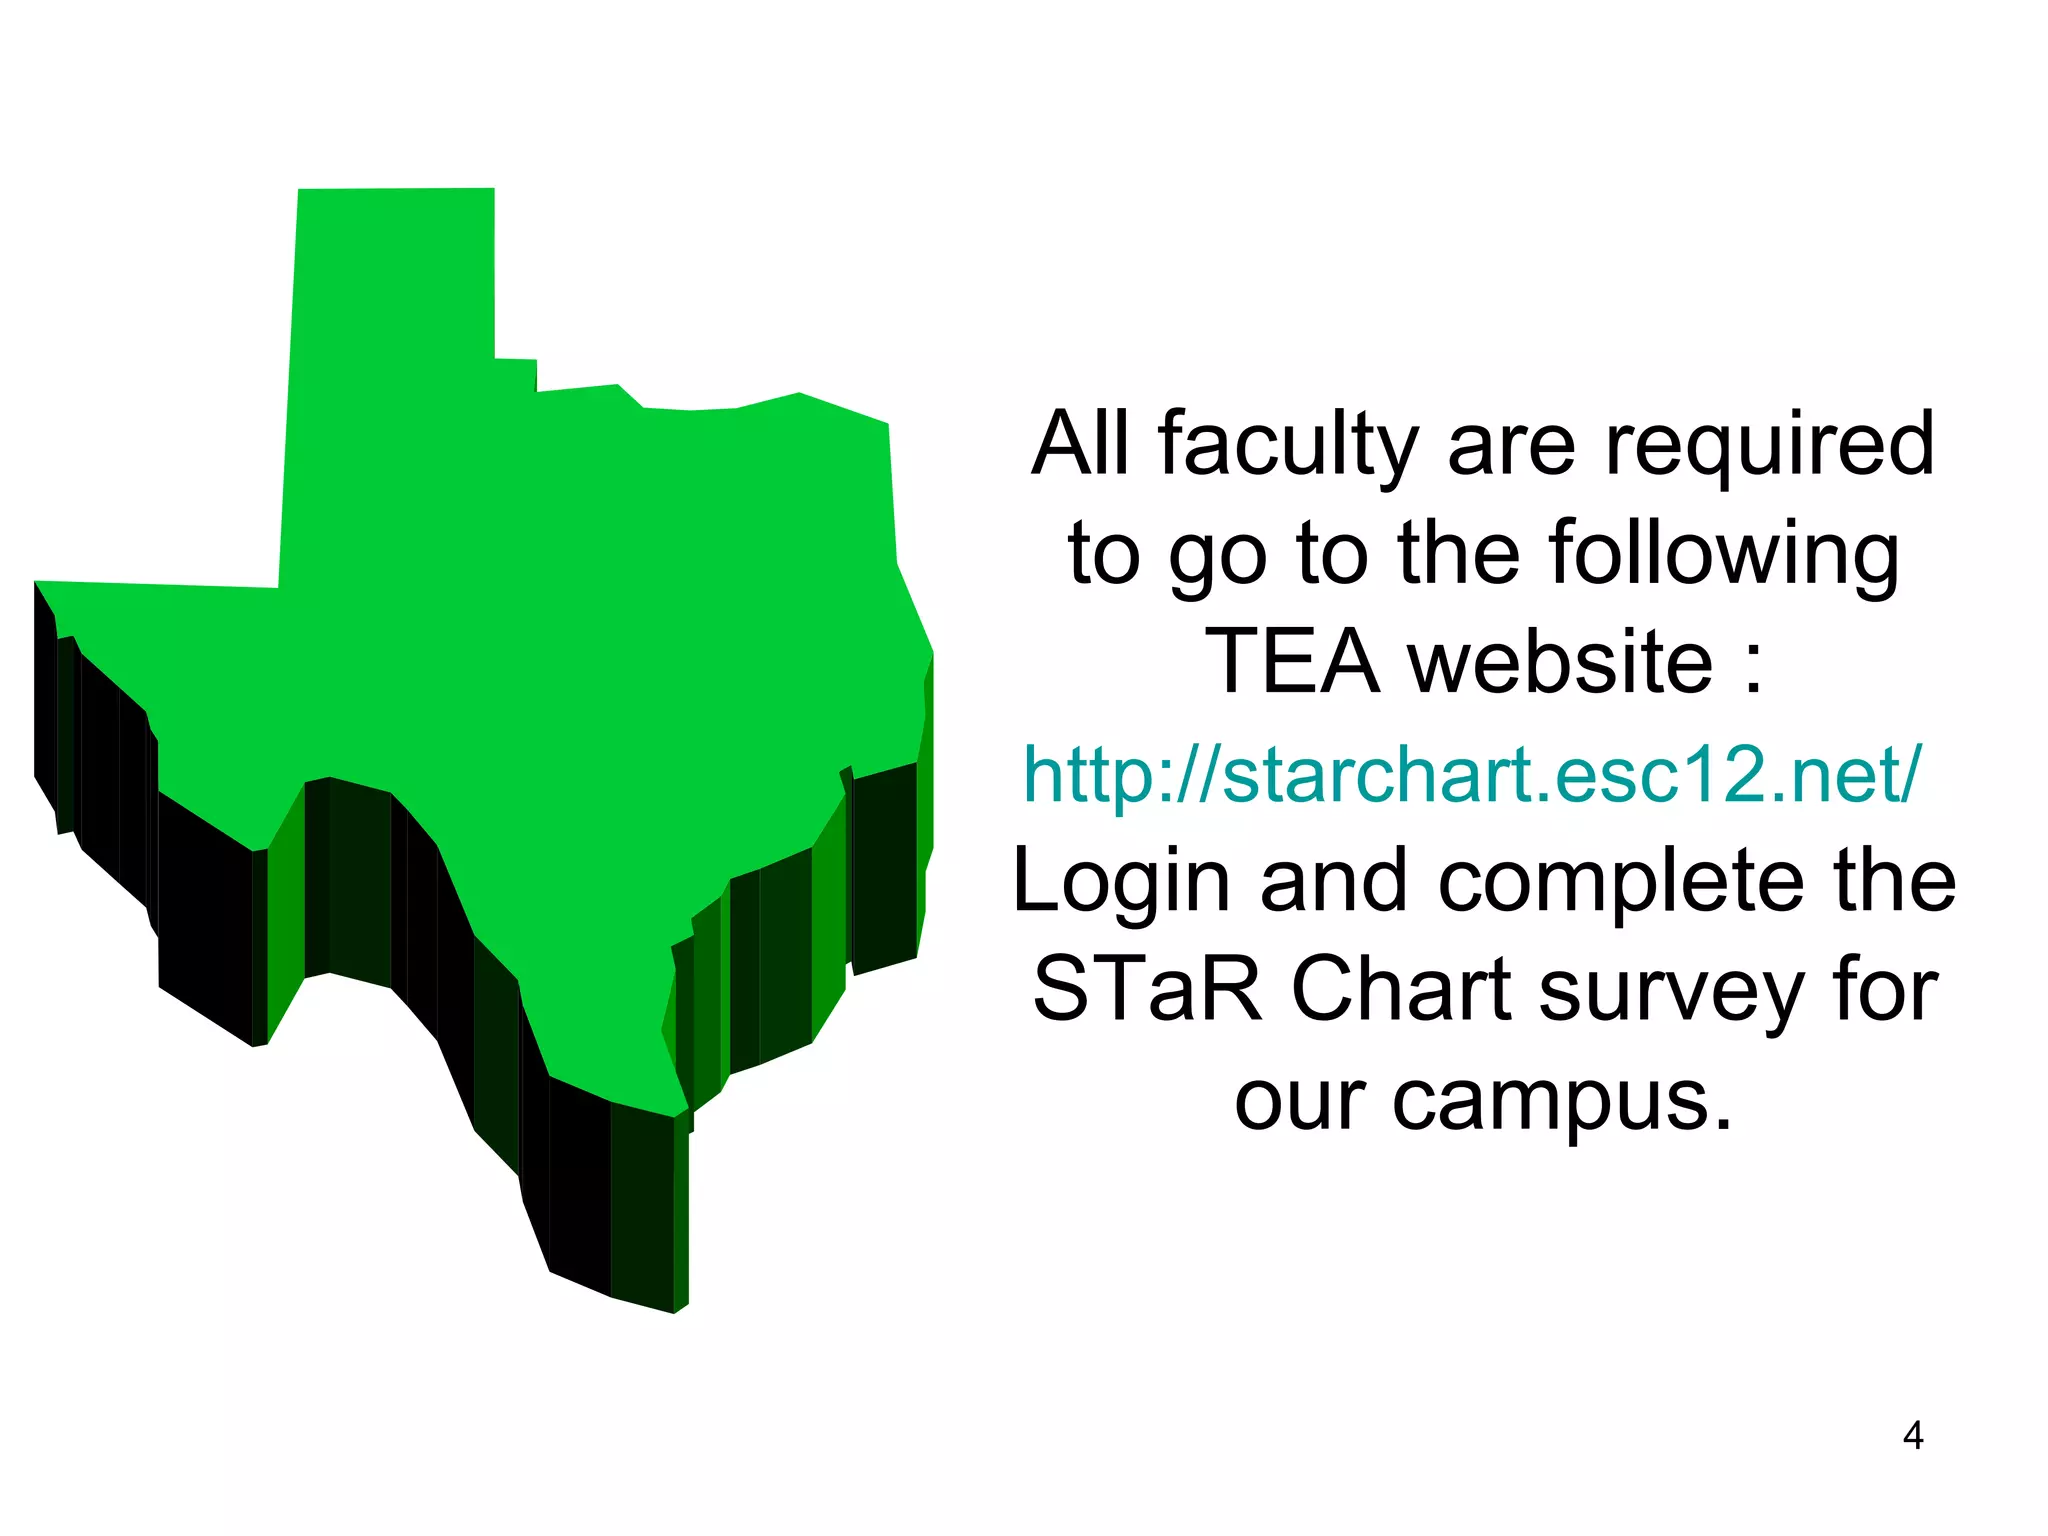
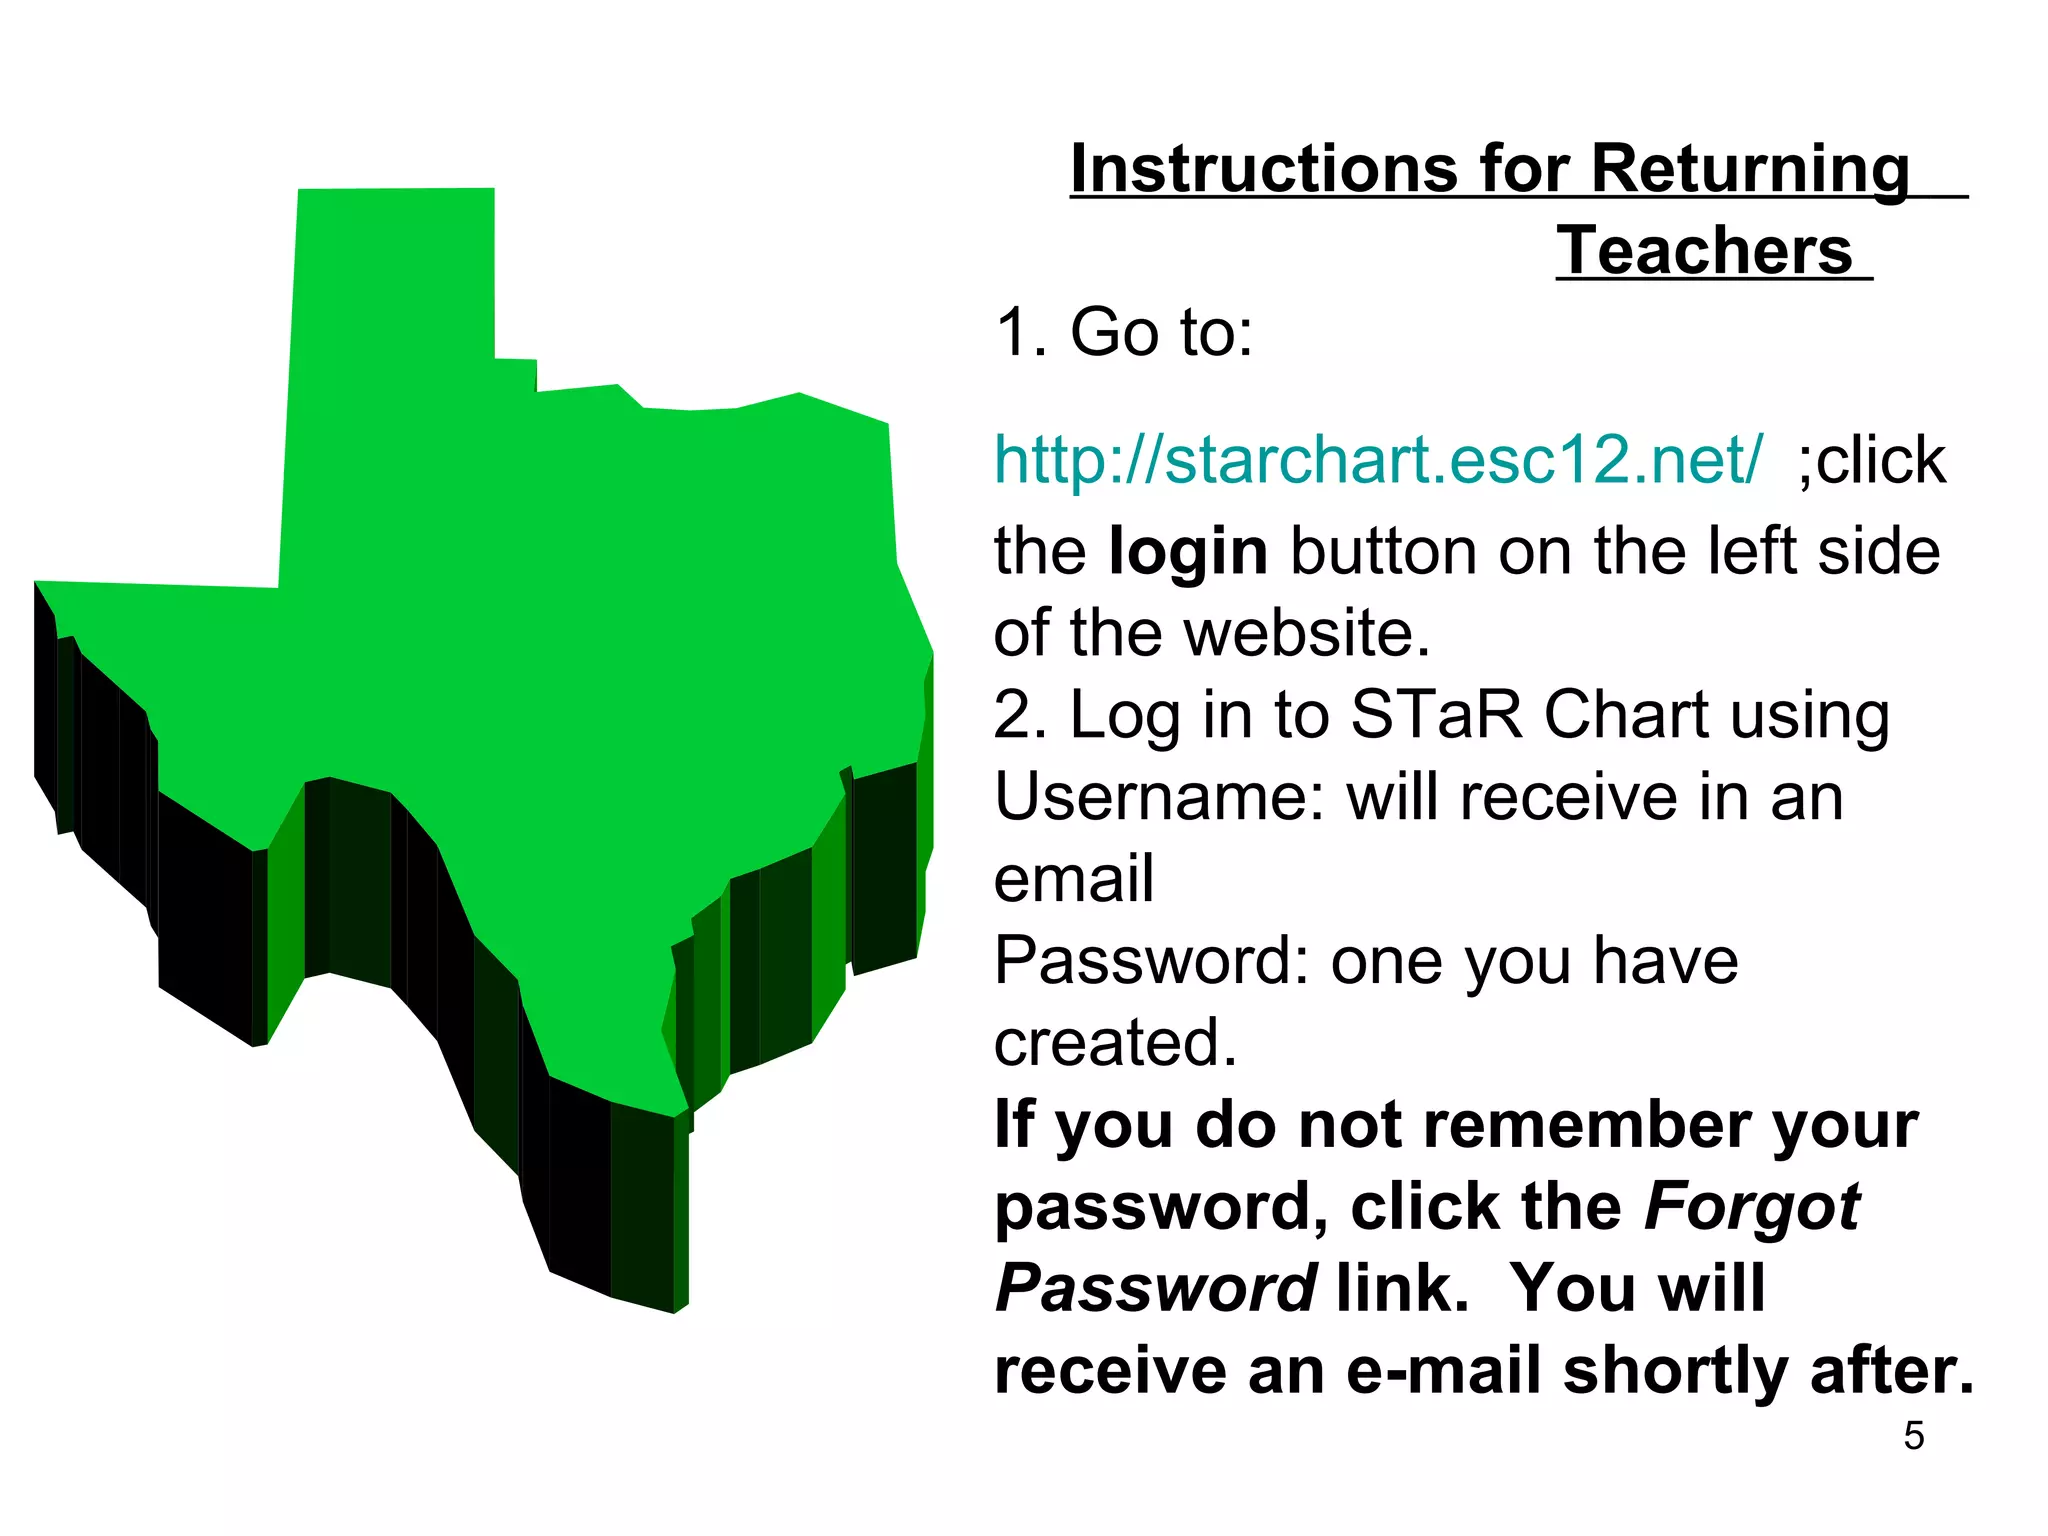
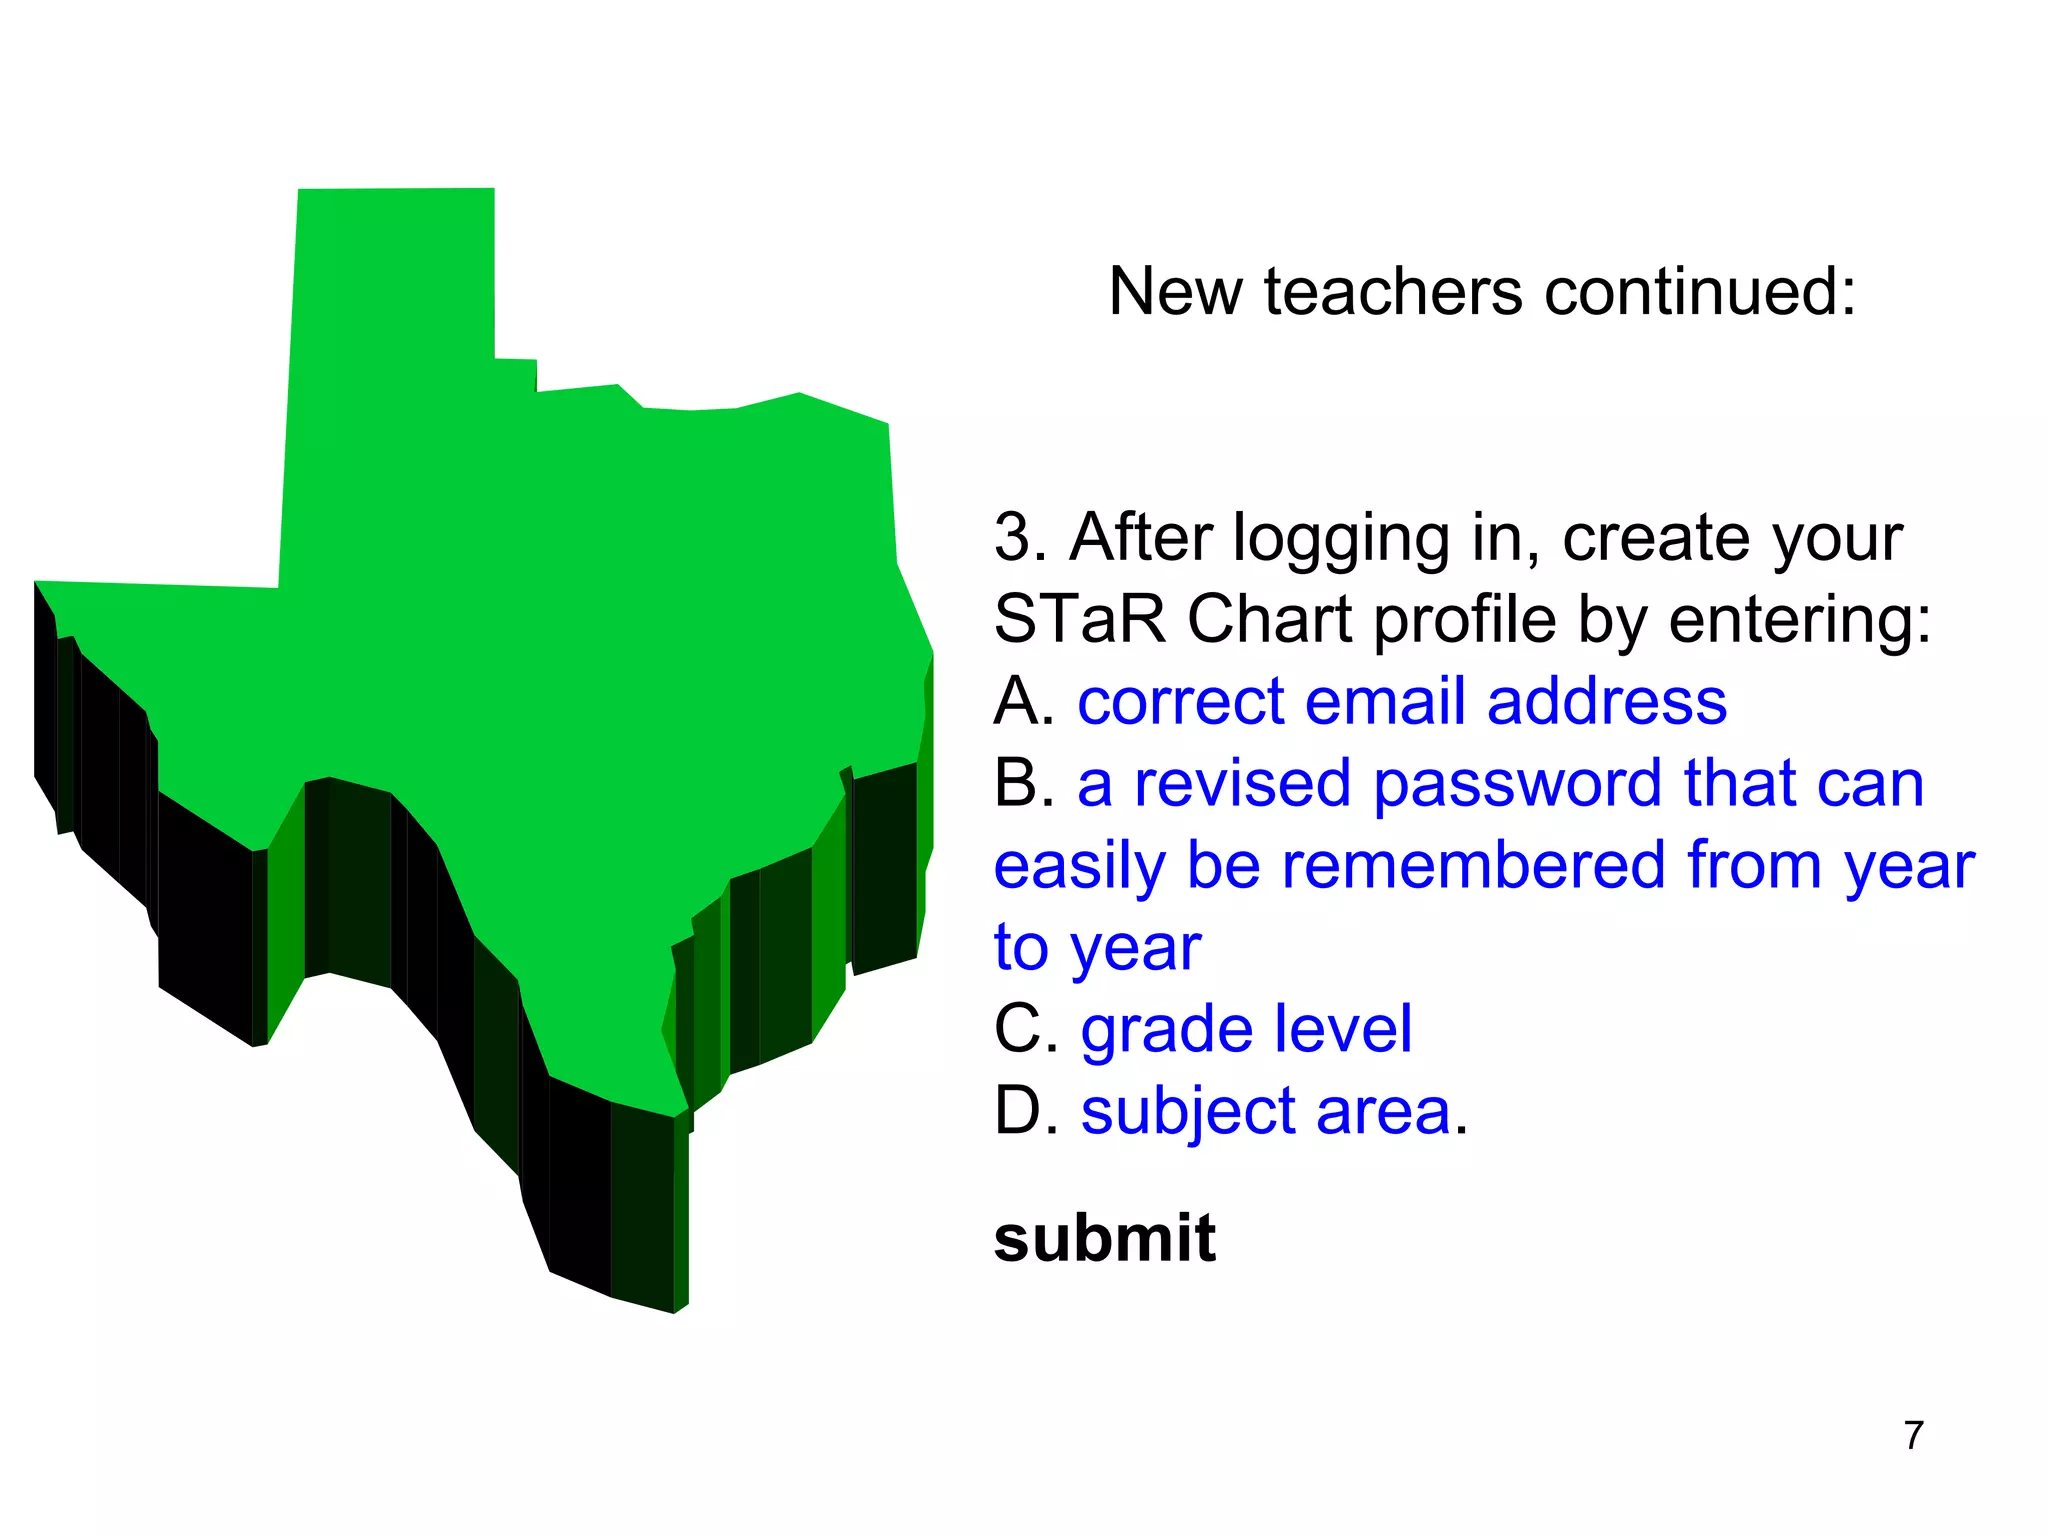
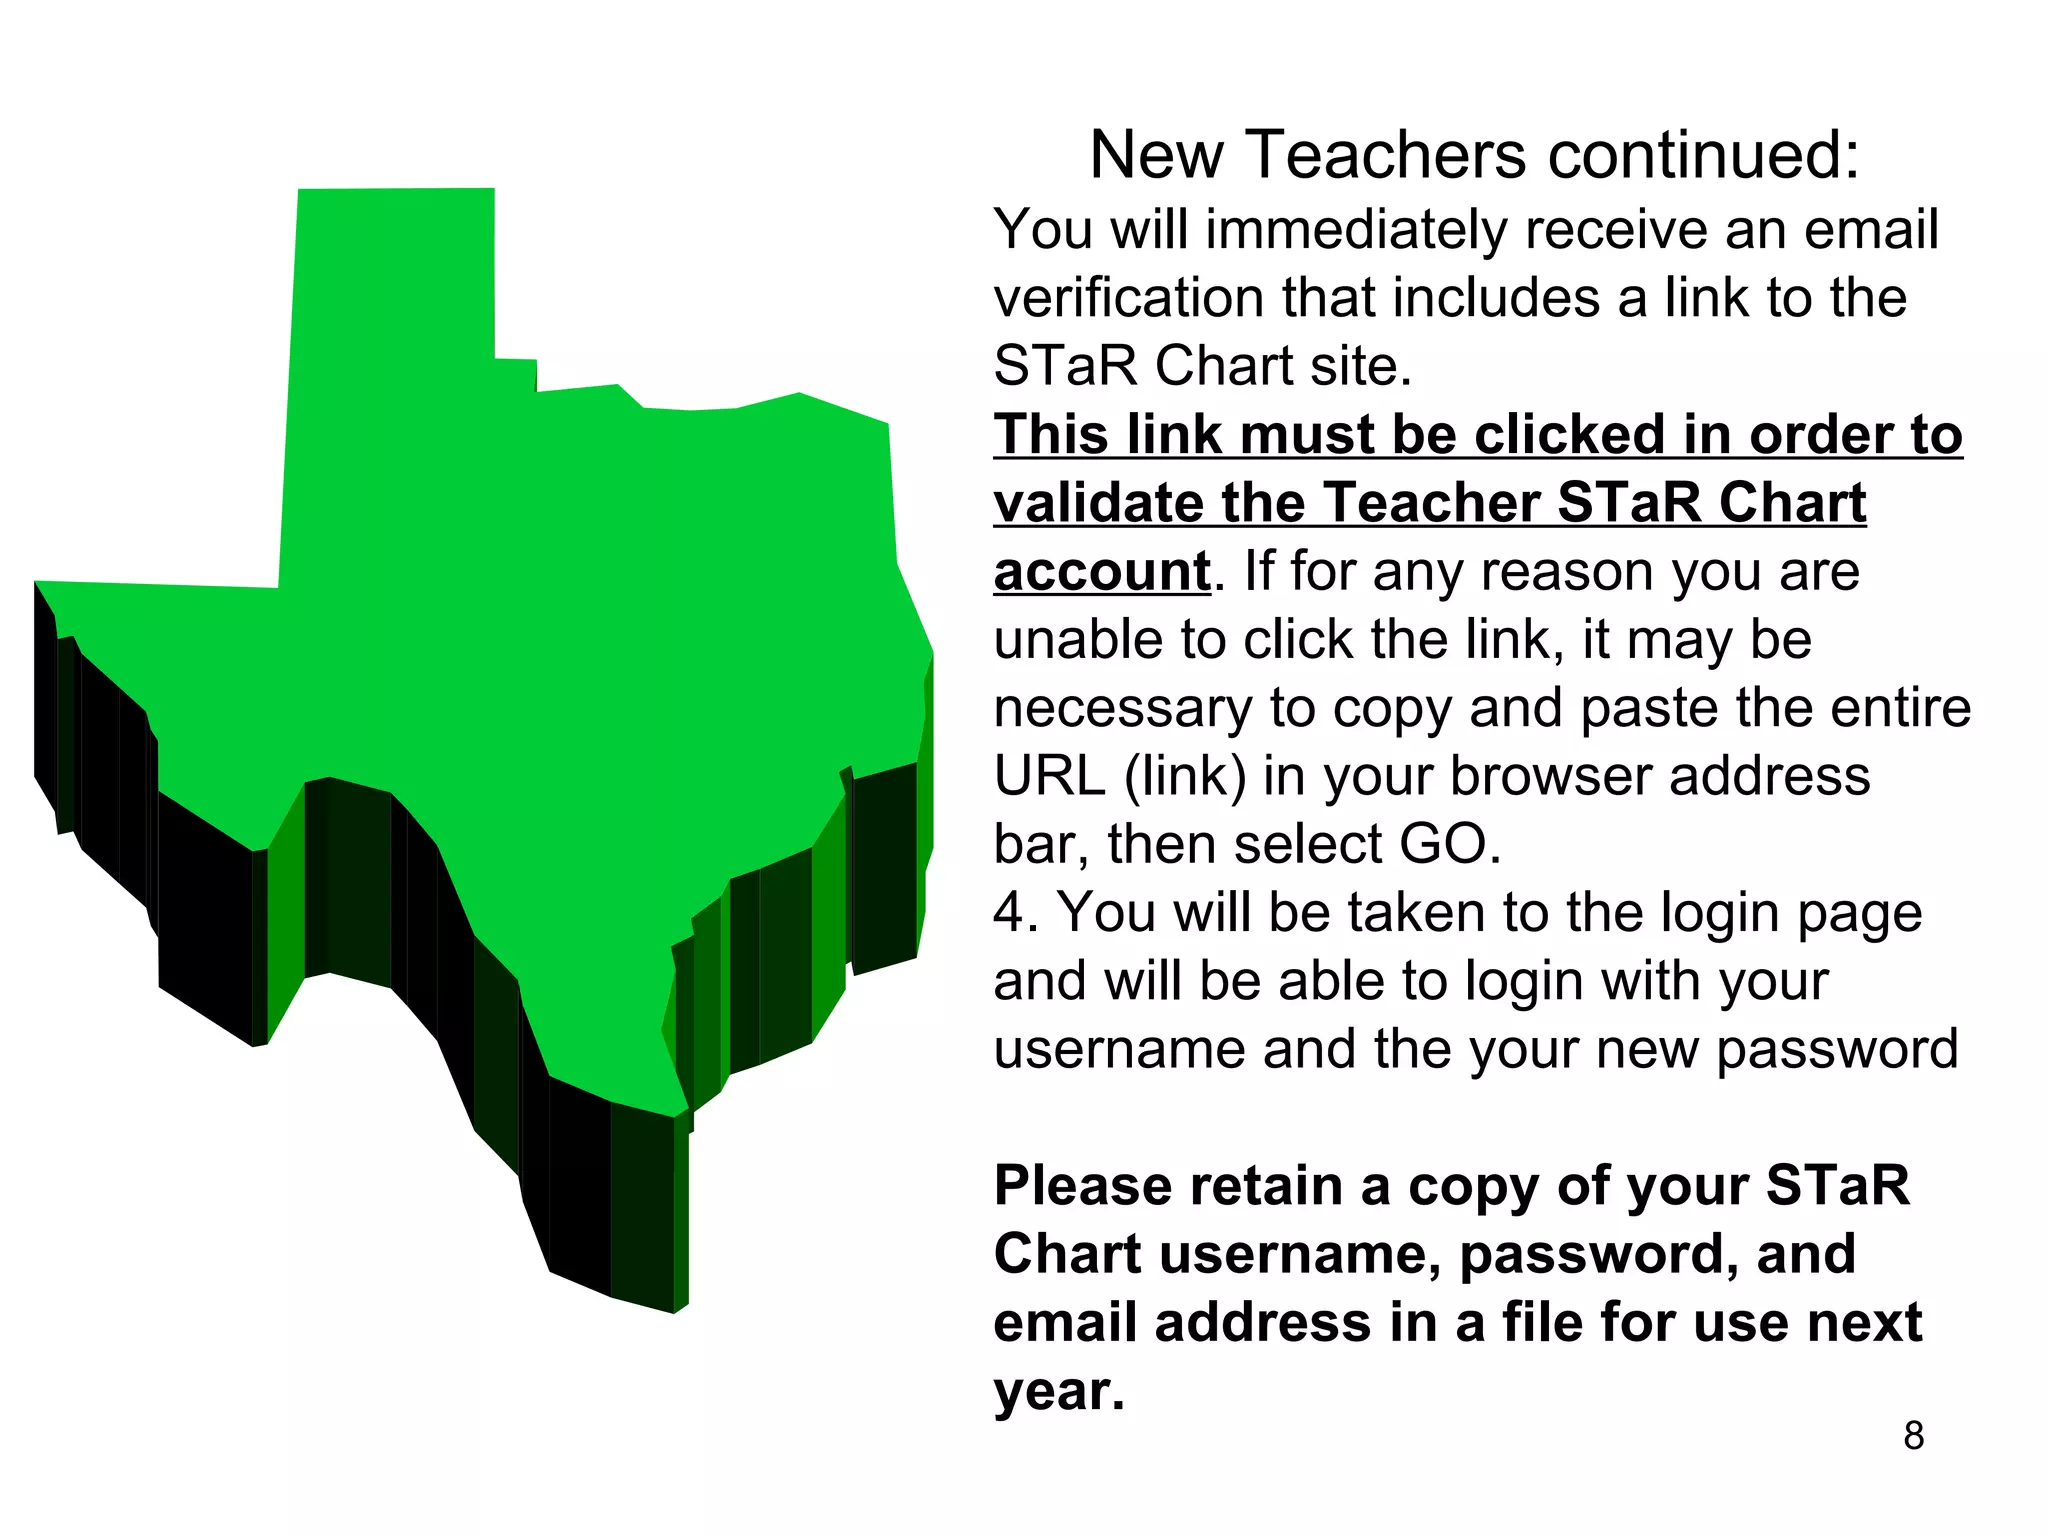
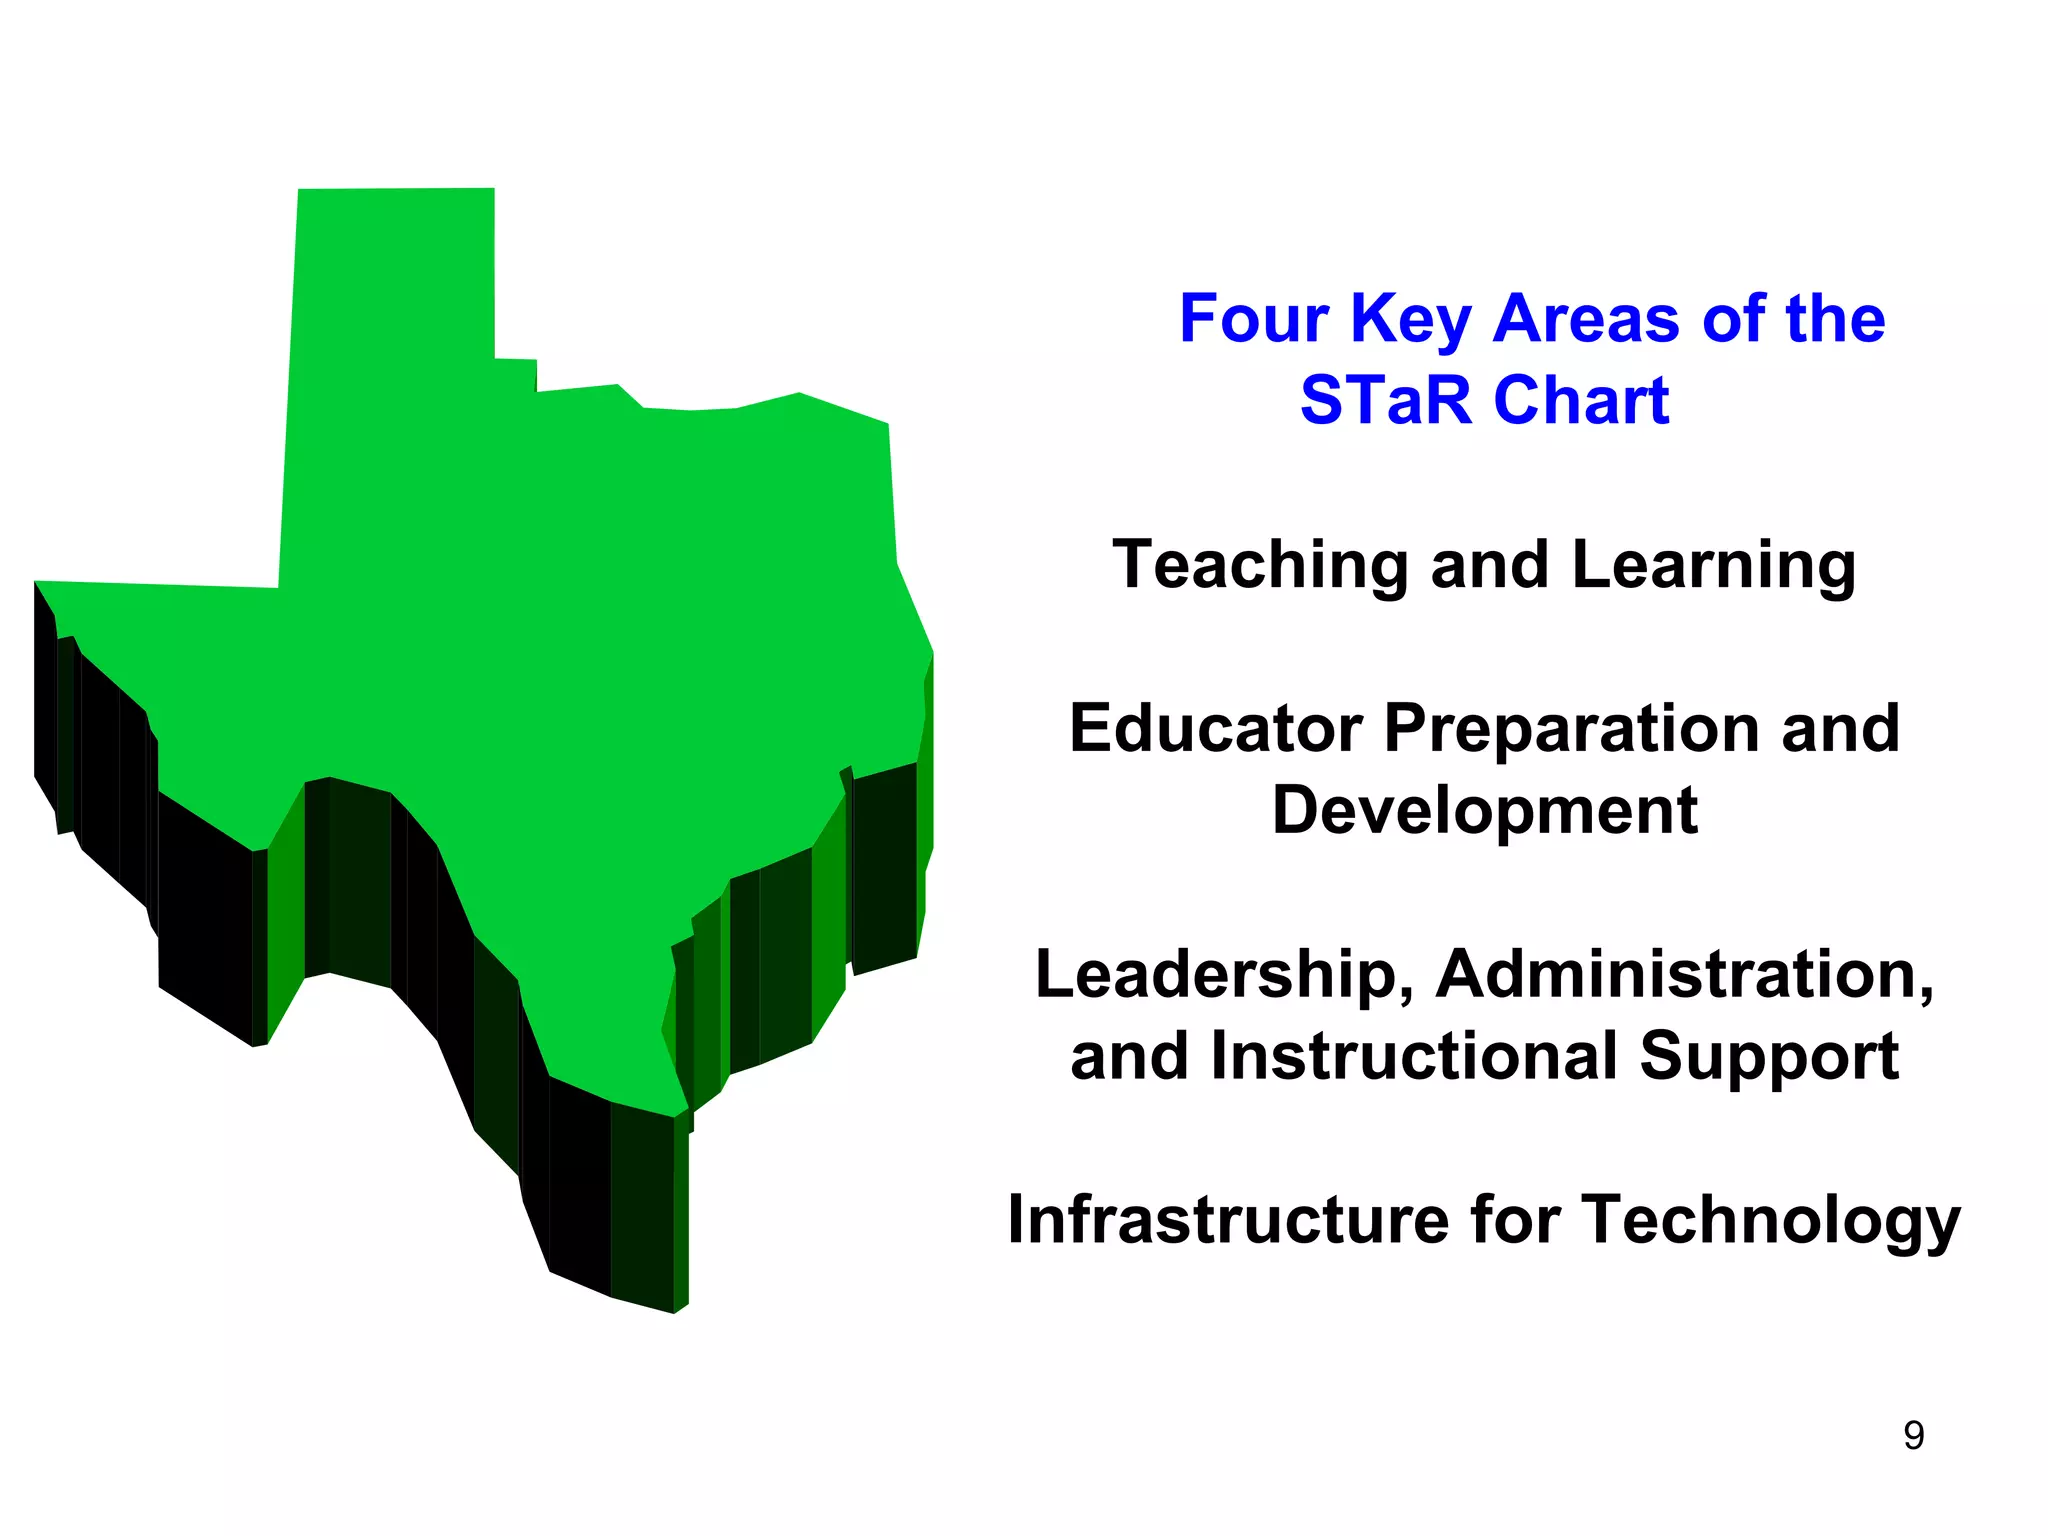
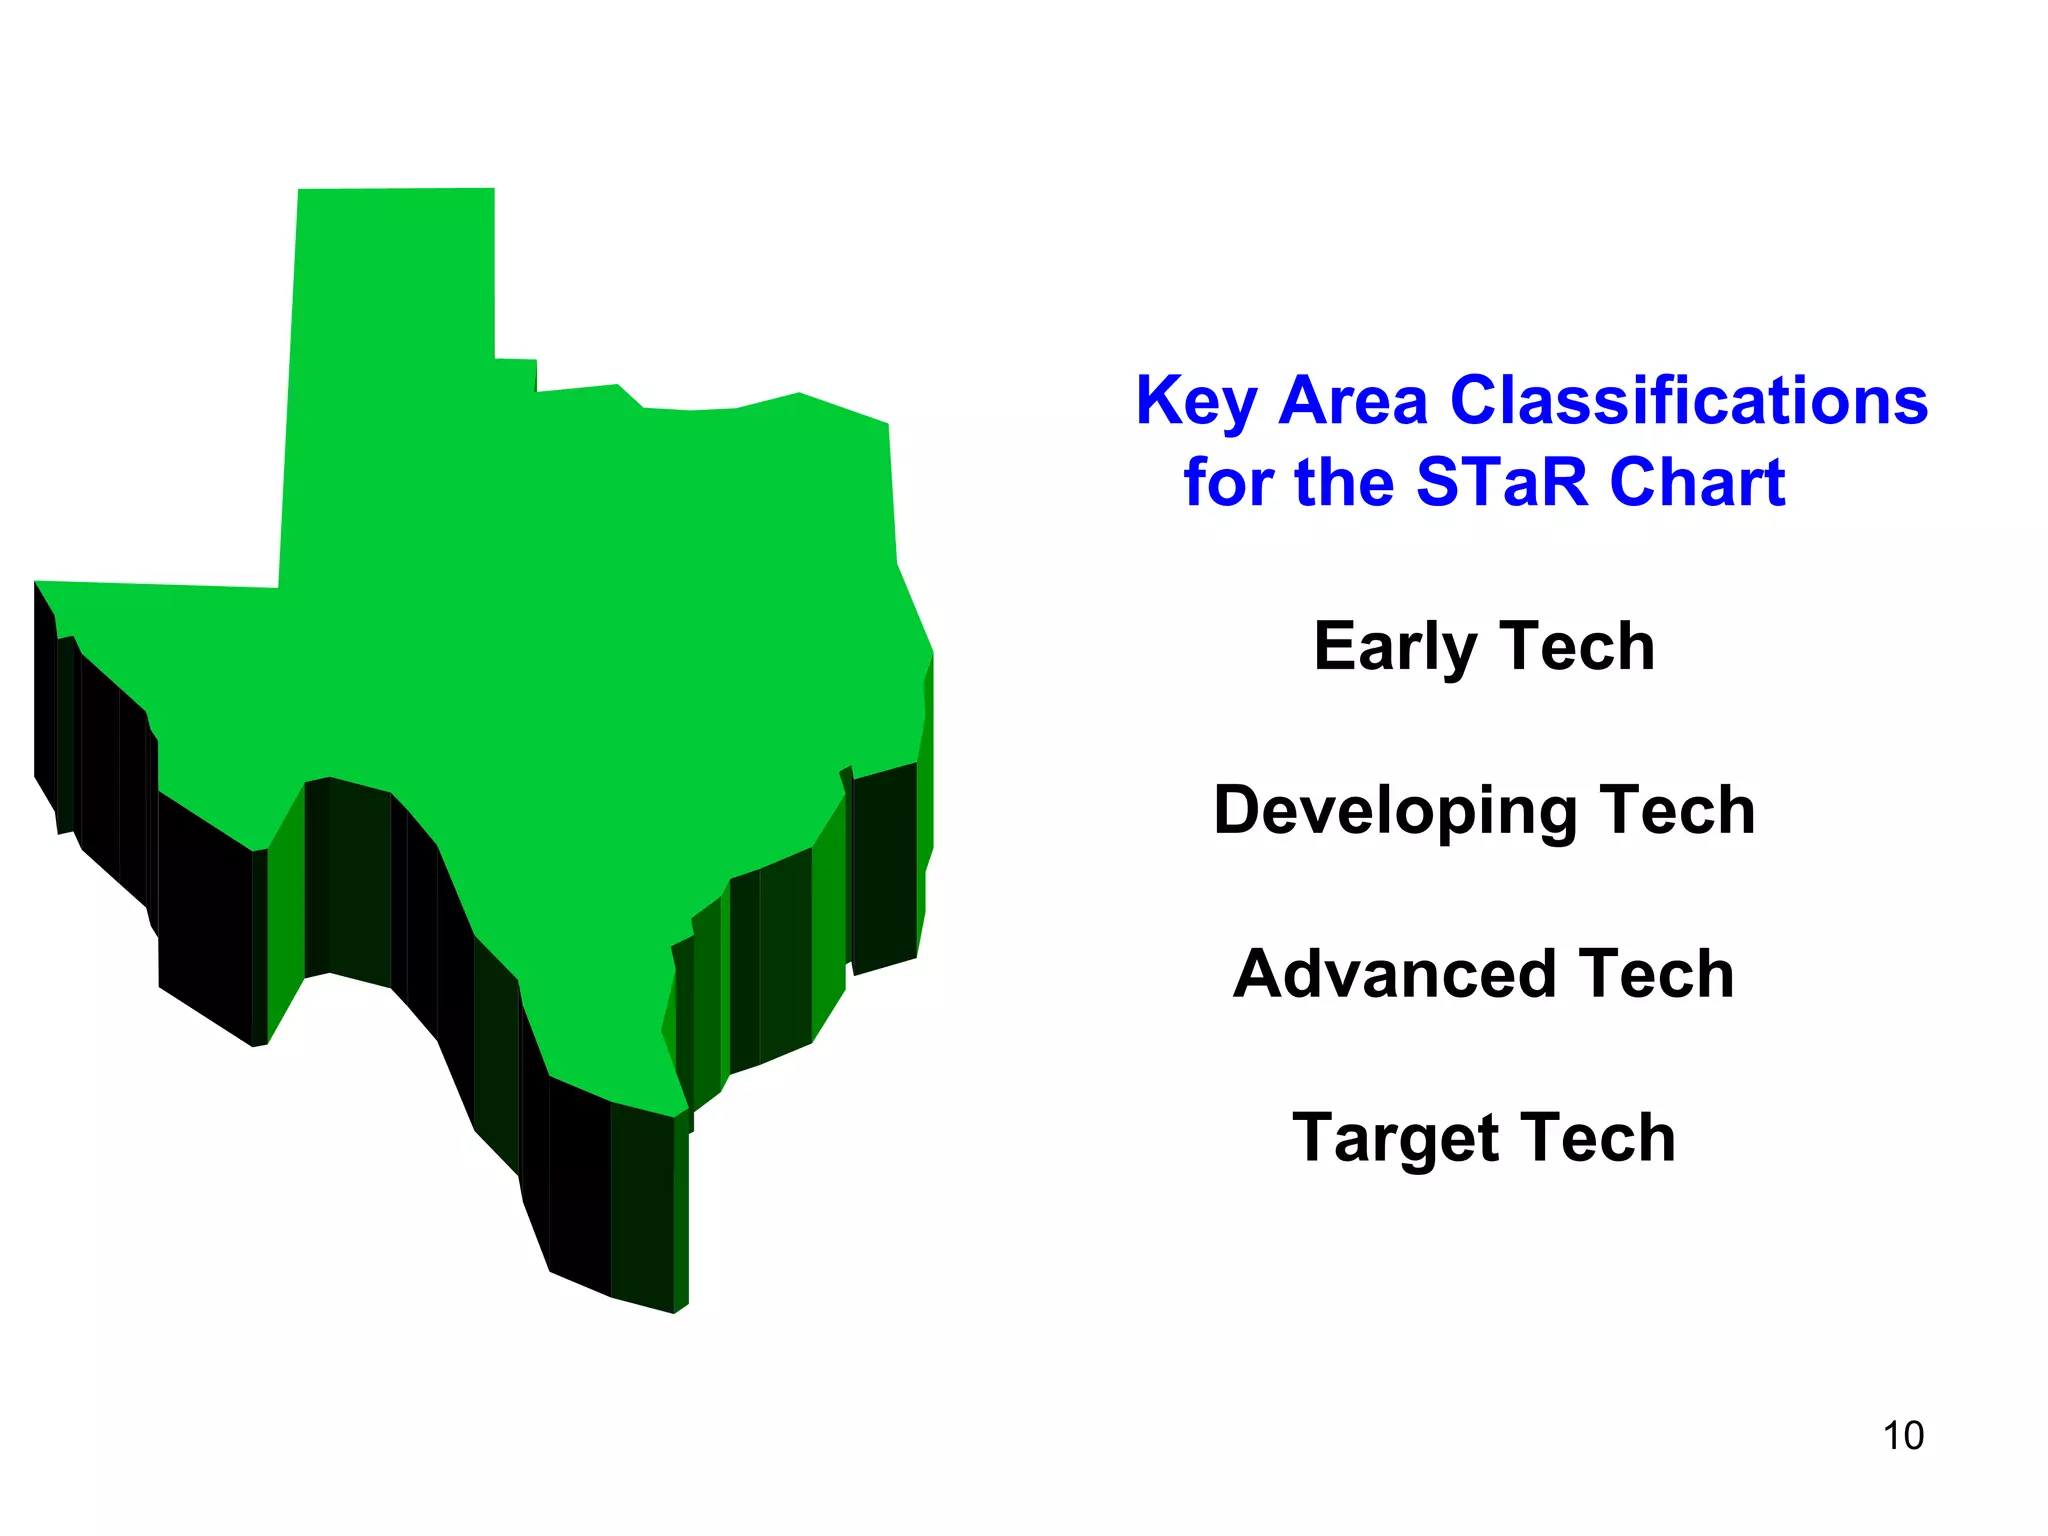
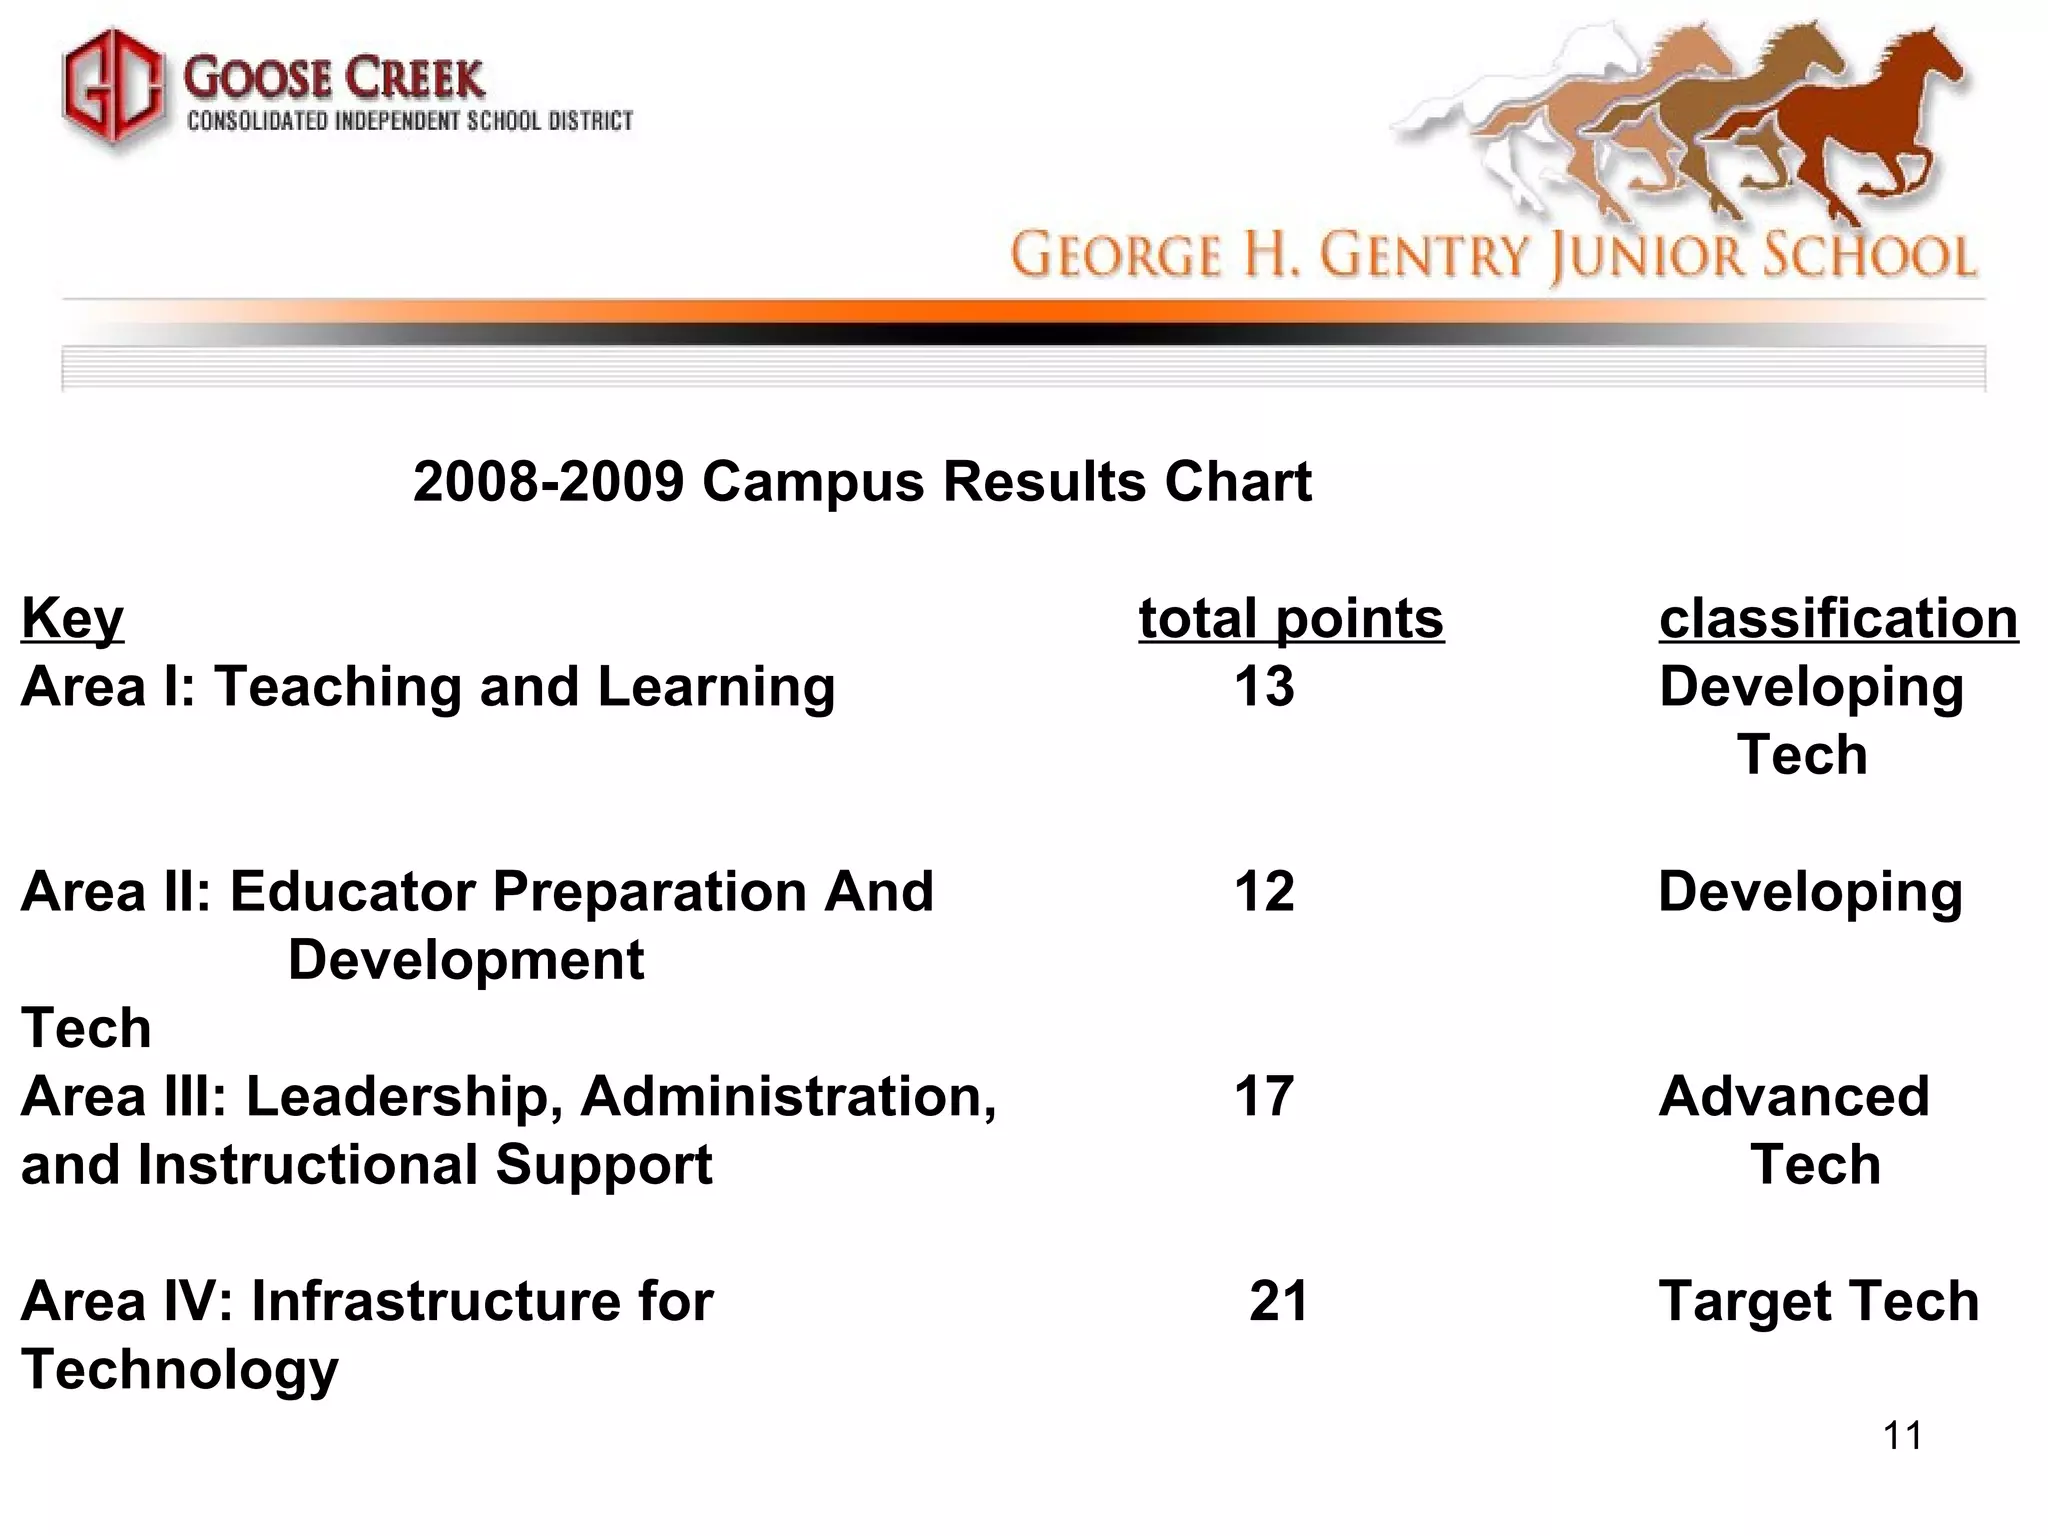
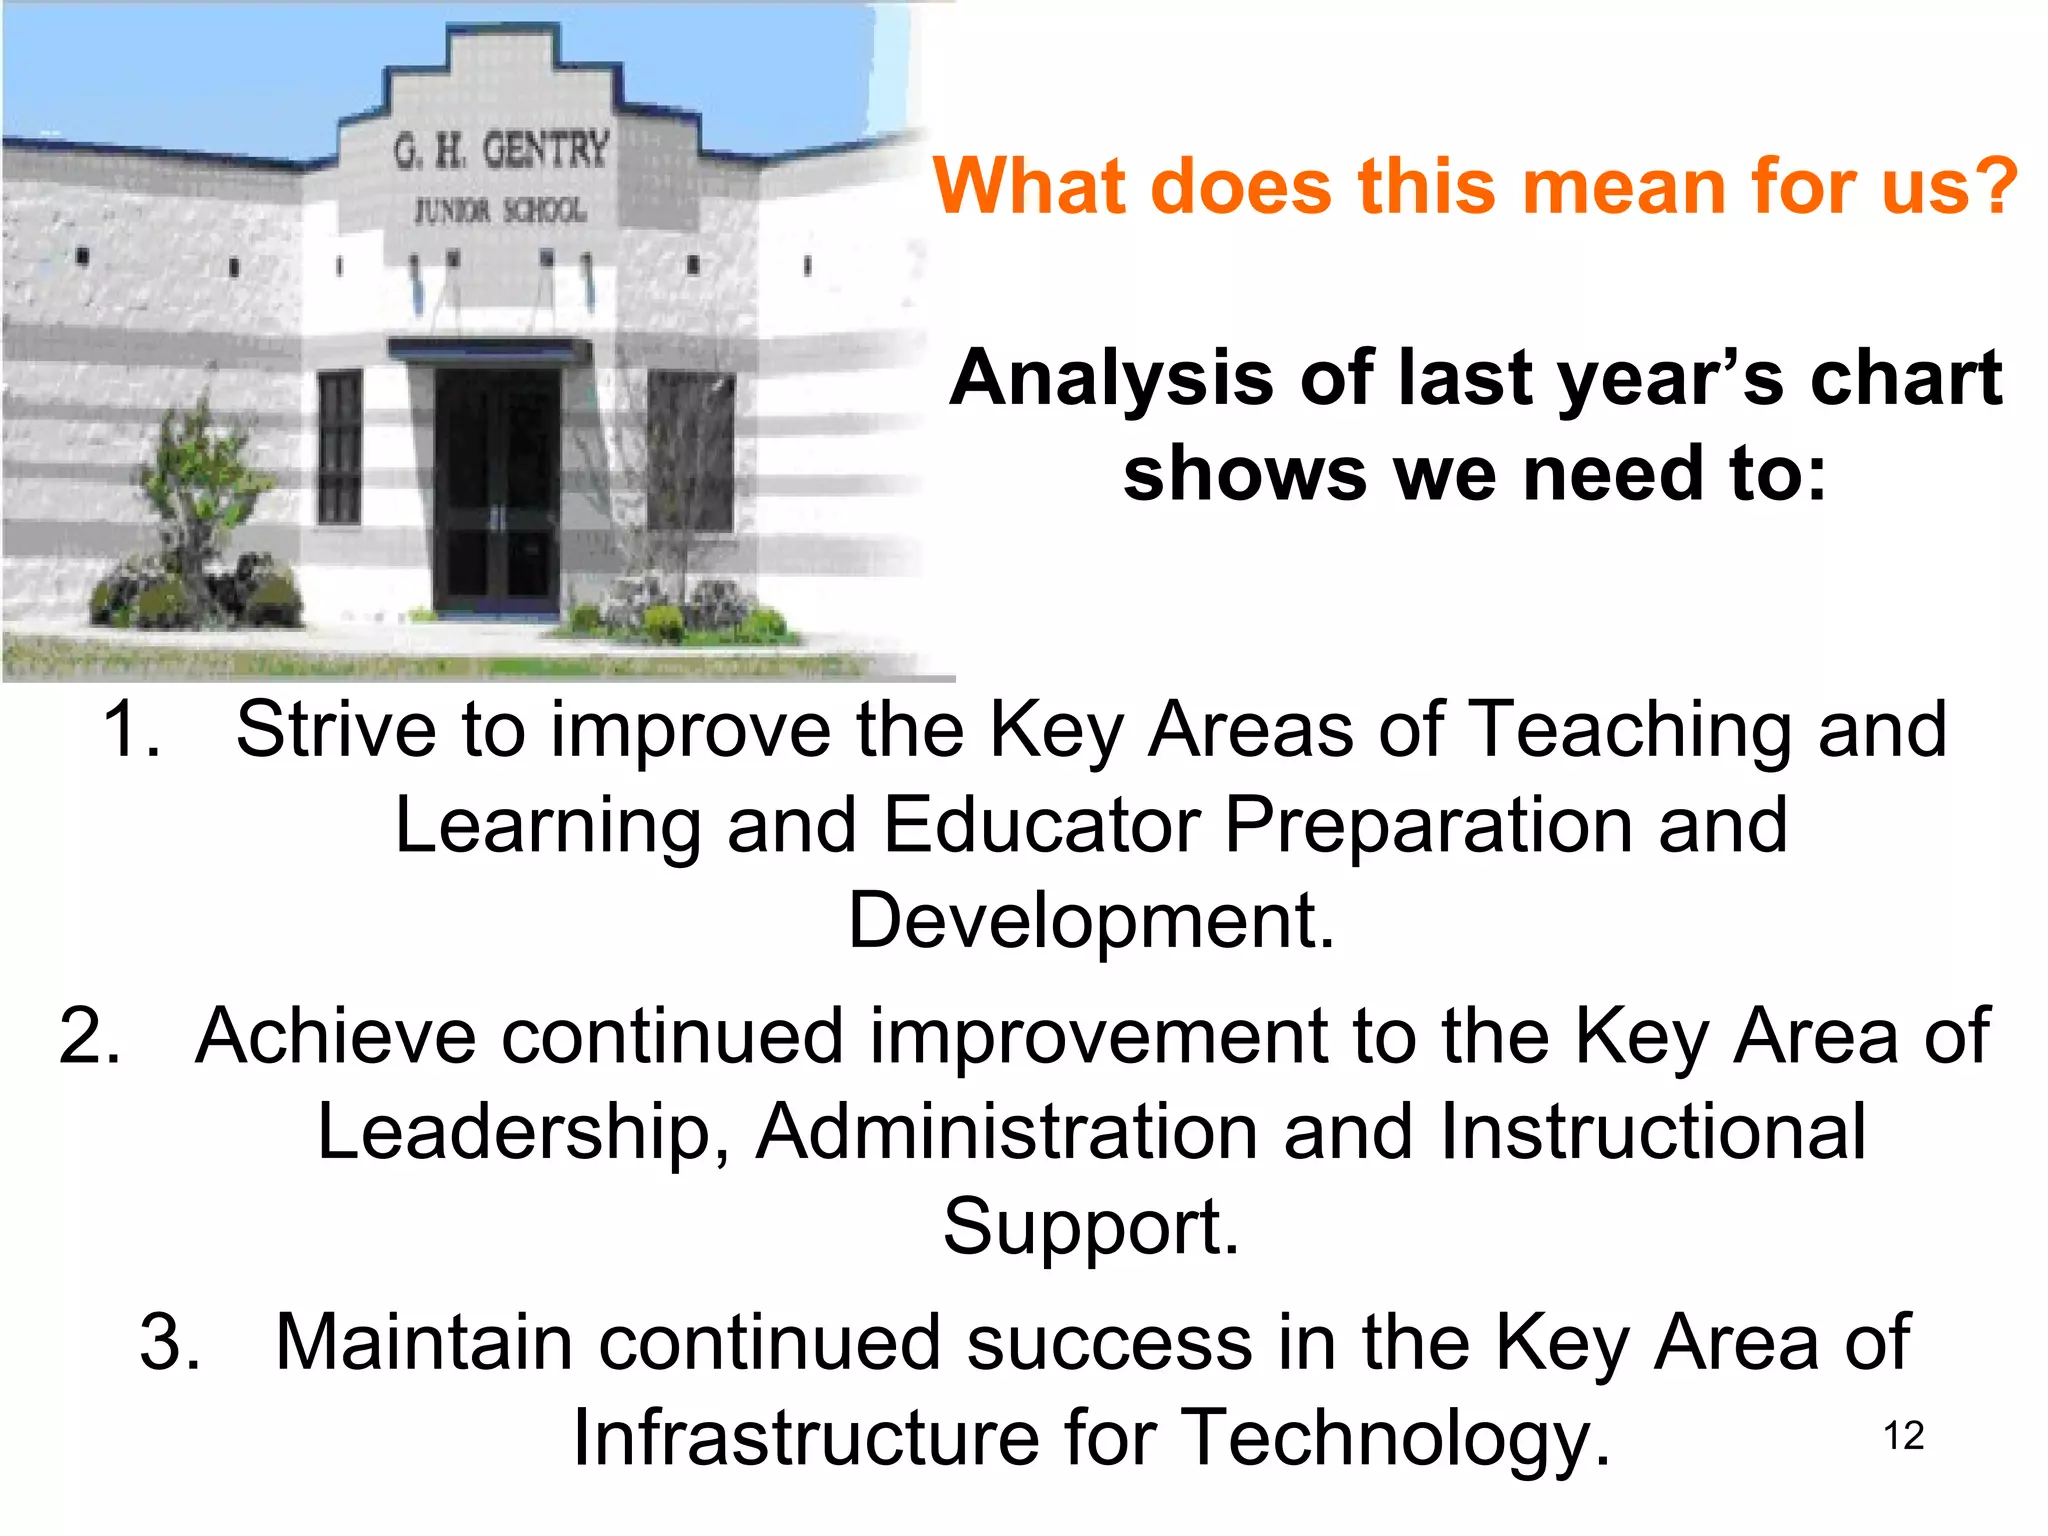
The  Texas STaR Chart
Agenda   slide What is a STaR Chart?.....................3 What do I need to do?.......................4 Instructions for returning teachers….5 Instructions for new teachers….….6-8 What are the Key Areas?..................9 Key Area Classifications..................10 Our campus classifications..............11 What does this mean to us?............12 Conclusion.......................................13
The Texas Education Agency Educational Technology Advisory Committee (ETAC) developed the Texas STaR Chart (Texas  S chool  T echnology  a nd  R eadiness Chart) as a self-assessment of your school’s and district’s efforts to integrate technology across the curriculum.
All faculty are required to go to the following TEA website : http://starchart.esc12.net/   Login and complete the STaR Chart survey for our campus.
Instructions for Returning    Teachers  1. Go to:  http://starchart.esc12.net/   ;click the  login  button on the left side of the website. 2. Log in to STaR Chart using   Username: will receive in an email Password: one you have created. If you do not remember your password, click the  Forgot Password  link.  You will receive an e-mail shortly after.
Instructions for new    Teachers    Create Teacher Profile  1.Go to:  http://starchart.esc12.net/ ; click the  login  button on the left side of the website. 2.Log in to STaR Chart using   Username: will receive in an email Temporary  Password:   password
New teachers continued: 3. After logging in, create your STaR Chart profile by entering:  A.  correct email address   B.  a revised password that can easily be remembered from year to year  C.  grade level   D.  subject area .  submit
New Teachers continued: You will immediately receive an email verification that includes a link to the STaR Chart site.  This link must be clicked in order to validate the Teacher STaR Chart account . If for any reason you are unable to click the link, it may be necessary to copy and paste the entire URL (link) in your browser address bar, then select GO.  4. You will be taken to the login page and will be able to login with your username and the your new password    Please retain a copy of your STaR Chart username, password, and email address in a file for use next year.
Four Key Areas of the STaR Chart Teaching and Learning Educator Preparation and Development Leadership, Administration, and Instructional Support Infrastructure for Technology
Key Area Classifications for the STaR Chart Early Tech Developing Tech Advanced Tech Target Tech
2008-2009 Campus Results Chart   Key   total points classification Area I: Teaching and Learning    13 Developing    Tech Area II: Educator Preparation And    12  Developing  Development    Tech    Area III: Leadership, Administration,    17 Advanced and Instructional Support  Tech Area IV: Infrastructure for 21  Target Tech Technology
What does this mean for us? Analysis of last year’s chart shows we need to: Strive to improve the Key Areas of Teaching and Learning and Educator Preparation and Development. Achieve continued improvement to the Key Area of Leadership, Administration and Instructional Support. Maintain continued success in the Key Area of Infrastructure for Technology.
Conclusion By continually assessing data from the STaR Chart on our advancement in technological usage, we can maximize our use of technology and the benefits it holds for our students’ success!

Starchartpresentation

  • 1.
    The TexasSTaR Chart
  • 2.
    Agenda slide What is a STaR Chart?.....................3 What do I need to do?.......................4 Instructions for returning teachers….5 Instructions for new teachers….….6-8 What are the Key Areas?..................9 Key Area Classifications..................10 Our campus classifications..............11 What does this mean to us?............12 Conclusion.......................................13
  • 3.
    The Texas EducationAgency Educational Technology Advisory Committee (ETAC) developed the Texas STaR Chart (Texas S chool T echnology a nd R eadiness Chart) as a self-assessment of your school’s and district’s efforts to integrate technology across the curriculum.
  • 4.
    All faculty arerequired to go to the following TEA website : http://starchart.esc12.net/ Login and complete the STaR Chart survey for our campus.
  • 5.
    Instructions for Returning Teachers 1. Go to: http://starchart.esc12.net/ ;click the login button on the left side of the website. 2. Log in to STaR Chart using   Username: will receive in an email Password: one you have created. If you do not remember your password, click the Forgot Password link.  You will receive an e-mail shortly after.
  • 6.
    Instructions for new Teachers   Create Teacher Profile 1.Go to: http://starchart.esc12.net/ ; click the login button on the left side of the website. 2.Log in to STaR Chart using   Username: will receive in an email Temporary Password:  password
  • 7.
    New teachers continued:3. After logging in, create your STaR Chart profile by entering: A. correct email address B. a revised password that can easily be remembered from year to year C. grade level D. subject area . submit
  • 8.
    New Teachers continued:You will immediately receive an email verification that includes a link to the STaR Chart site. This link must be clicked in order to validate the Teacher STaR Chart account . If for any reason you are unable to click the link, it may be necessary to copy and paste the entire URL (link) in your browser address bar, then select GO. 4. You will be taken to the login page and will be able to login with your username and the your new password   Please retain a copy of your STaR Chart username, password, and email address in a file for use next year.
  • 9.
    Four Key Areasof the STaR Chart Teaching and Learning Educator Preparation and Development Leadership, Administration, and Instructional Support Infrastructure for Technology
  • 10.
    Key Area Classificationsfor the STaR Chart Early Tech Developing Tech Advanced Tech Target Tech
  • 11.
    2008-2009 Campus ResultsChart Key total points classification Area I: Teaching and Learning 13 Developing Tech Area II: Educator Preparation And 12 Developing Development Tech Area III: Leadership, Administration, 17 Advanced and Instructional Support Tech Area IV: Infrastructure for 21 Target Tech Technology
  • 12.
    What does thismean for us? Analysis of last year’s chart shows we need to: Strive to improve the Key Areas of Teaching and Learning and Educator Preparation and Development. Achieve continued improvement to the Key Area of Leadership, Administration and Instructional Support. Maintain continued success in the Key Area of Infrastructure for Technology.
  • 13.
    Conclusion By continuallyassessing data from the STaR Chart on our advancement in technological usage, we can maximize our use of technology and the benefits it holds for our students’ success!