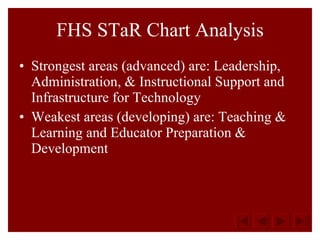
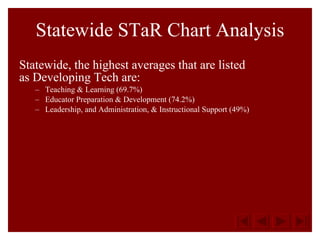
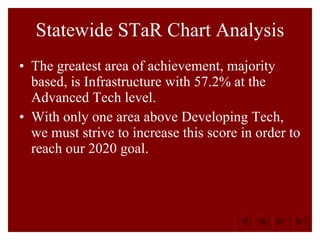
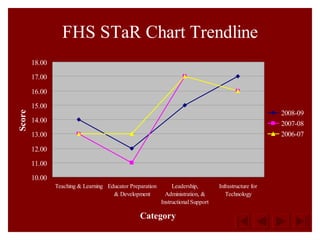
STaR Chart Analysis Fairfield High School
Introduction STaR Chart Ideology  FHS STaR Chart Analysis Statewide Wide Analysis FHS Trends Summary Questions
STaR Chart The STaR Chart is based on principle areas of the state’s Long-Range Technology Plan. Used as a measurement tool to determine progress in meeting state and local goals. Based on 4 level of achievement: Early, Developing, Advanced and Target
FHS STaR Chart Analysis Strongest areas (advanced) are:  Leadership, Administration, & Instructional Support and Infrastructure for Technology Weakest areas (developing) are: Teaching & Learning and Educator Preparation & Development
Statewide STaR Chart Analysis Statewide, the highest averages that  are listed as Developing Tech are: T eaching & Learning (69.7%) Educator Preparation & Development (74.2%) Leadership, and Administration, & Instructional Support (49%)
Statewide STaR Chart Analysis The greatest area of achievement, majority based, is Infrastructure with 57.2% at the Advanced Tech level. With only one area above Developing Tech, we must strive to increase this score in order to reach our 2020 goal.
 
Summary Our campus is only one section ahead of the state average, but with our resources we should be scoring much higher. For complete results from around the state, please visit:  http://starchart.esc12.net/default.html
Questions/Comments You may contact me with any questions, comments or suggestions. [email_address]

STaR Chart Analysis

  • 1.
    STaR Chart AnalysisFairfield High School
  • 2.
    Introduction STaR ChartIdeology FHS STaR Chart Analysis Statewide Wide Analysis FHS Trends Summary Questions
  • 3.
    STaR Chart TheSTaR Chart is based on principle areas of the state’s Long-Range Technology Plan. Used as a measurement tool to determine progress in meeting state and local goals. Based on 4 level of achievement: Early, Developing, Advanced and Target
  • 4.
    FHS STaR ChartAnalysis Strongest areas (advanced) are: Leadership, Administration, & Instructional Support and Infrastructure for Technology Weakest areas (developing) are: Teaching & Learning and Educator Preparation & Development
  • 5.
    Statewide STaR ChartAnalysis Statewide, the highest averages that are listed as Developing Tech are: T eaching & Learning (69.7%) Educator Preparation & Development (74.2%) Leadership, and Administration, & Instructional Support (49%)
  • 6.
    Statewide STaR ChartAnalysis The greatest area of achievement, majority based, is Infrastructure with 57.2% at the Advanced Tech level. With only one area above Developing Tech, we must strive to increase this score in order to reach our 2020 goal.
  • 7.
  • 8.
    Summary Our campusis only one section ahead of the state average, but with our resources we should be scoring much higher. For complete results from around the state, please visit: http://starchart.esc12.net/default.html
  • 9.
    Questions/Comments You maycontact me with any questions, comments or suggestions. [email_address]