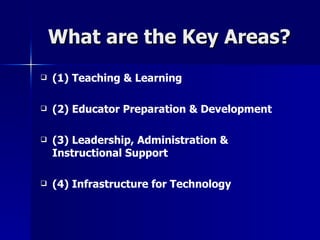
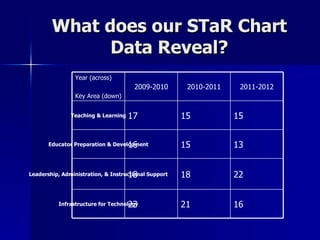
Texas STaR Chart
Introduction Texas STaR Chart Key Areas STaR Chart Data
What is the Texas STaR Chart? STaR =  S chool  T echnology  a nd R eadiness
What is the Texas STaR Chart? The Texas Teacher STaR Chart was developed to help those in the field of education such as educators, campuses and school districts.
What is the Texas STaR Chart? Its intent is to determine campus and district progress toward meeting the goals of the Texas Long Range Plan for Technology,   2006 – 2020.
What are the Key Areas? (1) Teaching & Learning (2)   Educator Preparation & Development (3)   Leadership, Administration & Instructional Support (4) Infrastructure for Technology
What does our STaR Chart Data Reveal? Year (across) Key Area (down) 2009-2010 2010-2011 2011-2012 Teaching & Learning 17 15 15 Educator Preparation & Development 16 15 13 Leadership, Administration, & Instructional Support 18 18 22 Infrastructure for Technology 23 21 16
What does our STaR Chart Data Reveal? The STaR Chart revealed Infrastructure and Technology as our greatest strength. However, we are pretty strong in all areas. The STaR Chart revealed educator preparation and development as our campus greatest weakness.
How can we improve as a campus? Professional Developments Administration Support More planning time Suggestions?
Conclusion Texas STaR Chart http://starchart.esc12.net/

Star Chart Presentation

  • 1.
  • 2.
    Introduction Texas STaRChart Key Areas STaR Chart Data
  • 3.
    What is theTexas STaR Chart? STaR = S chool T echnology a nd R eadiness
  • 4.
    What is theTexas STaR Chart? The Texas Teacher STaR Chart was developed to help those in the field of education such as educators, campuses and school districts.
  • 5.
    What is theTexas STaR Chart? Its intent is to determine campus and district progress toward meeting the goals of the Texas Long Range Plan for Technology, 2006 – 2020.
  • 6.
    What are theKey Areas? (1) Teaching & Learning (2) Educator Preparation & Development (3) Leadership, Administration & Instructional Support (4) Infrastructure for Technology
  • 7.
    What does ourSTaR Chart Data Reveal? Year (across) Key Area (down) 2009-2010 2010-2011 2011-2012 Teaching & Learning 17 15 15 Educator Preparation & Development 16 15 13 Leadership, Administration, & Instructional Support 18 18 22 Infrastructure for Technology 23 21 16
  • 8.
    What does ourSTaR Chart Data Reveal? The STaR Chart revealed Infrastructure and Technology as our greatest strength. However, we are pretty strong in all areas. The STaR Chart revealed educator preparation and development as our campus greatest weakness.
  • 9.
    How can weimprove as a campus? Professional Developments Administration Support More planning time Suggestions?
  • 10.
    Conclusion Texas STaRChart http://starchart.esc12.net/