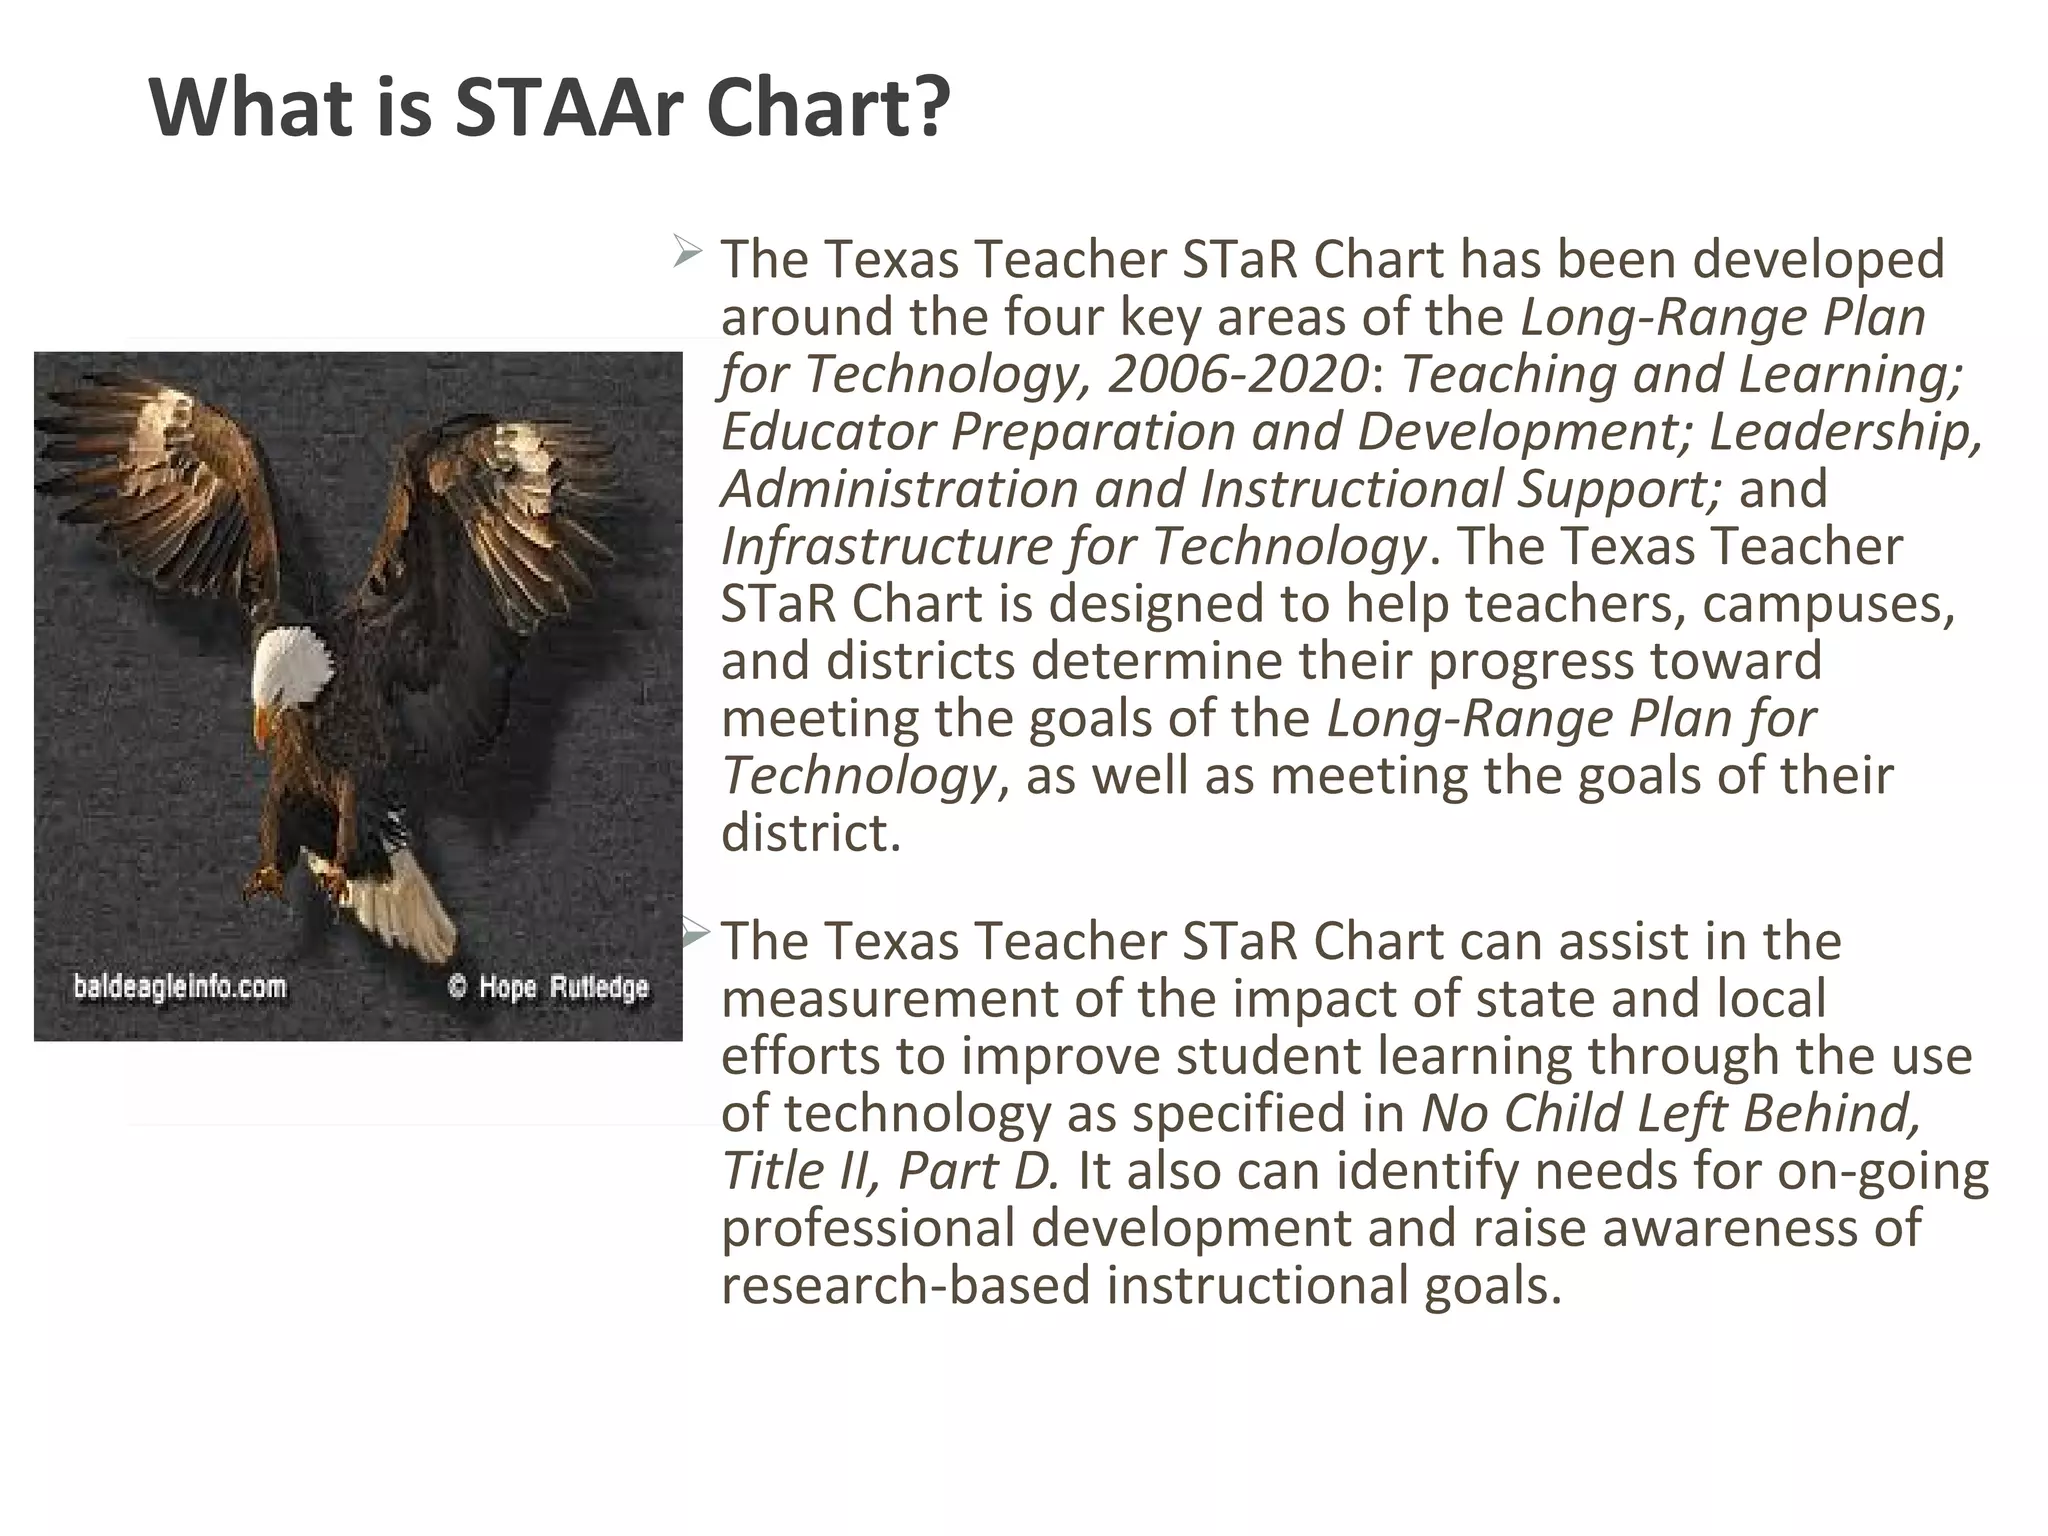
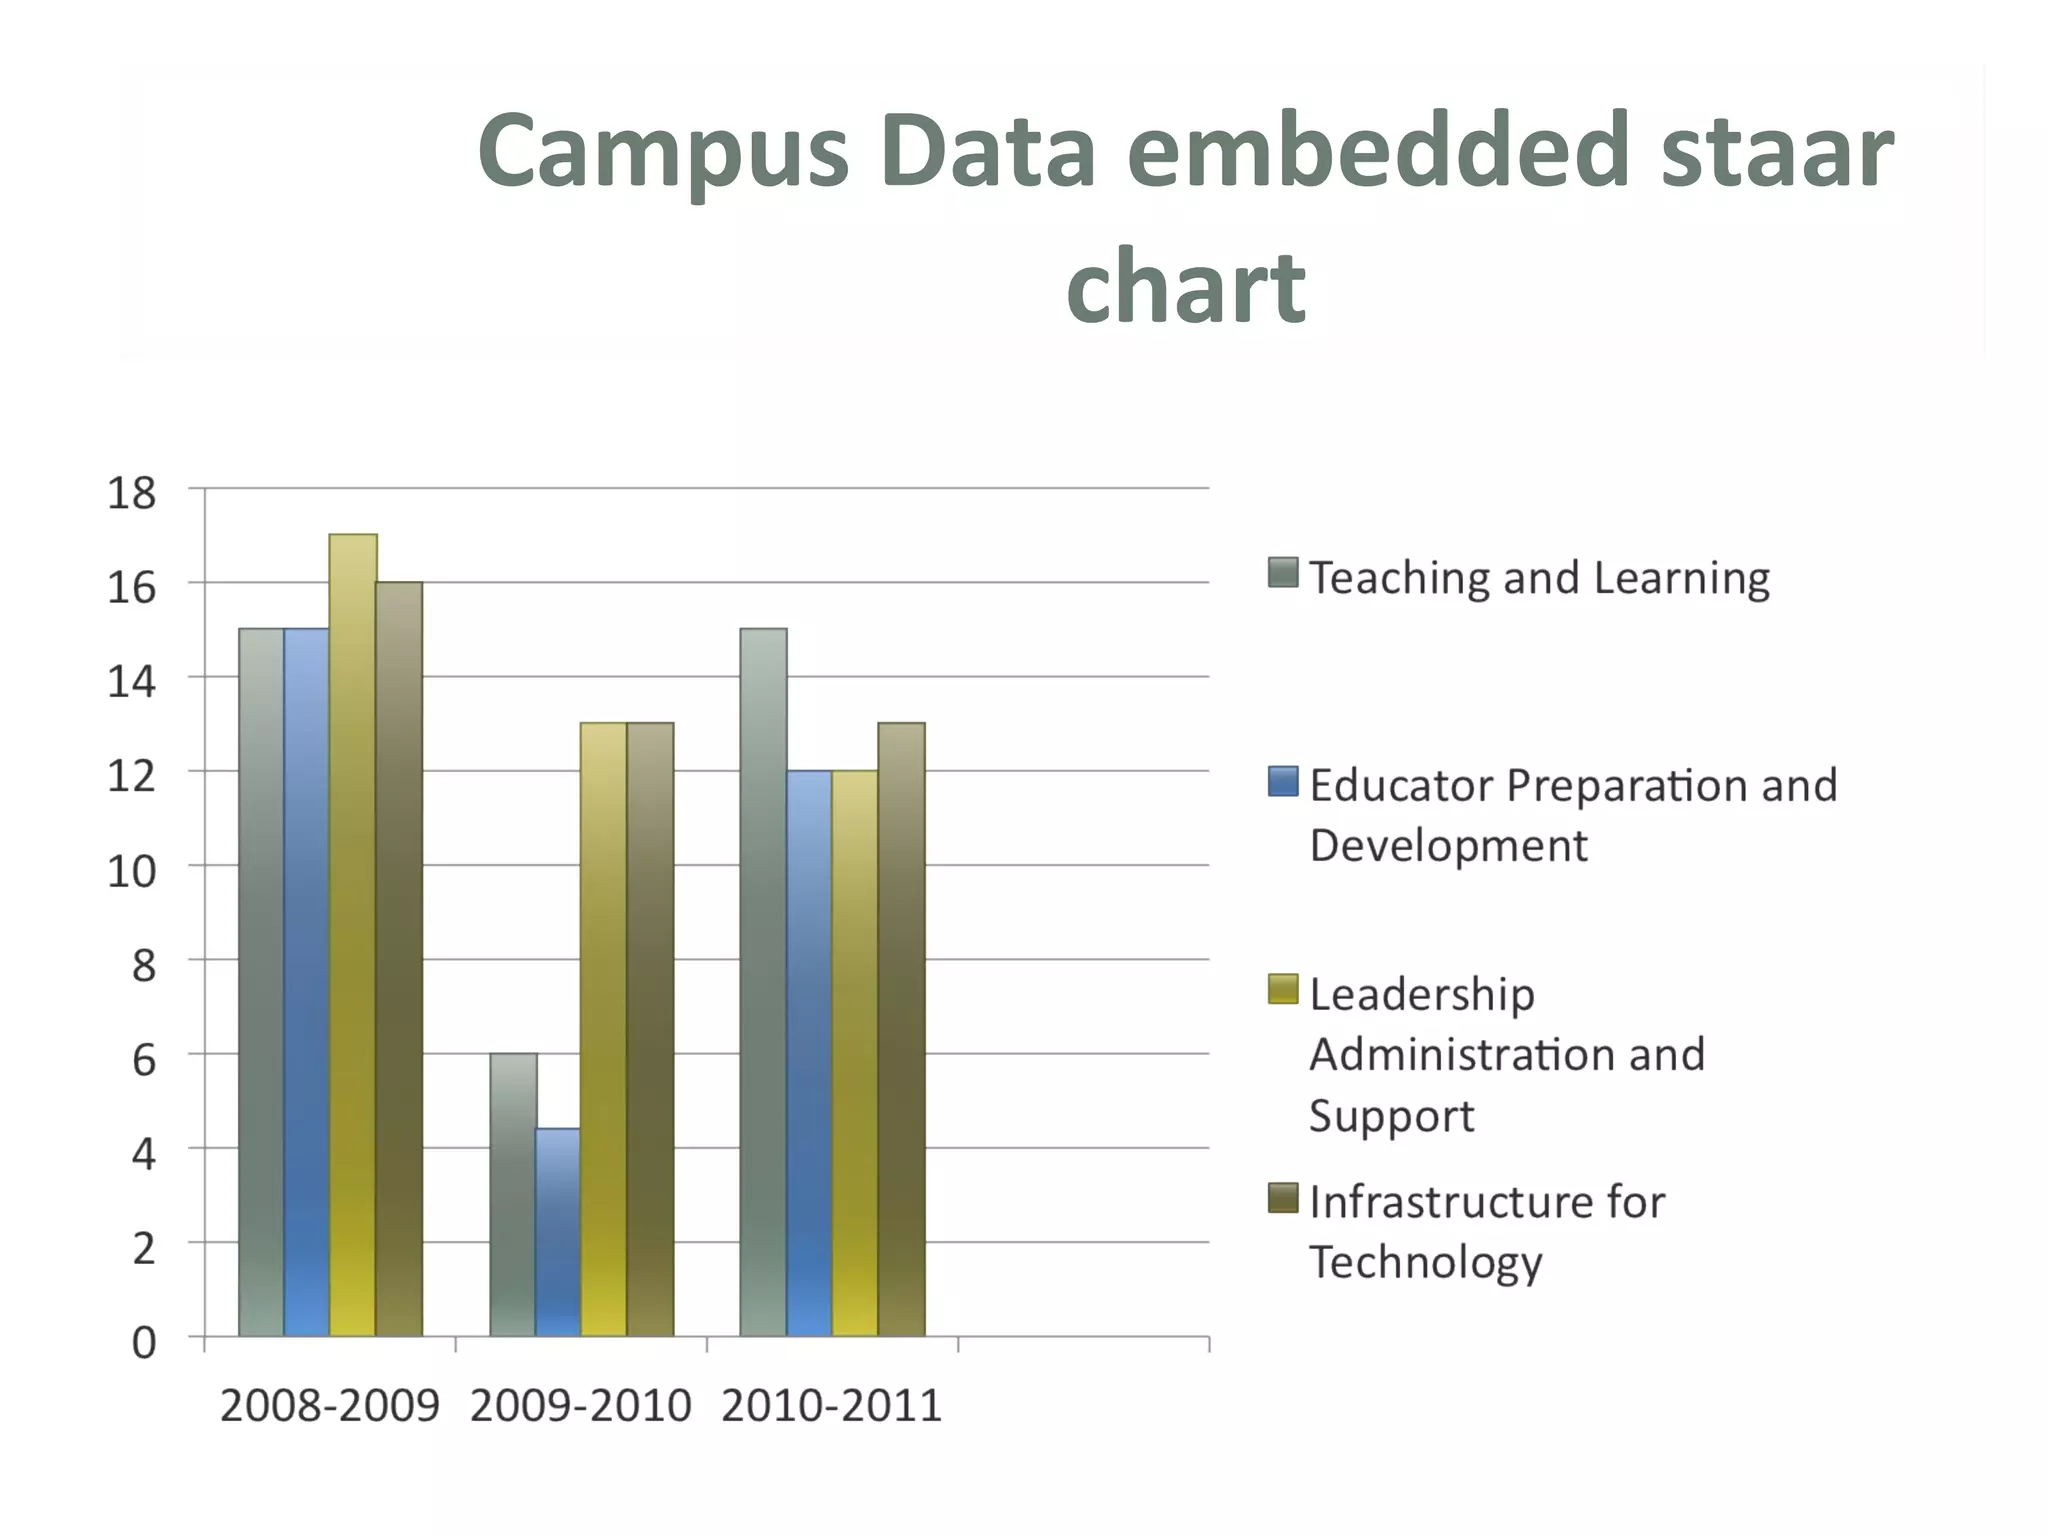
A Guide to UNDERSTANDING STAAR CHART
Kelso Elementary
“Soaring eagles”
Agenda…………
What is a STAAR Chart?
SBEC Technology Application Standards
Four Key Areas and Performance Descriptions
Campus Data Embedded STAAR Chart
Summary
Website Information
What is STAAr Chart?
 The Texas Teacher STaR Chart has been developed
around the four key areas of the Long-Range Plan
for Technology, 2006-2020: Teaching and Learning;
Educator Preparation and Development; Leadership,
Administration and Instructional Support; and
Infrastructure for Technology. The Texas Teacher
STaR Chart is designed to help teachers, campuses,
and districts determine their progress toward
meeting the goals of the Long-Range Plan for
Technology, as well as meeting the goals of their
district.
The Texas Teacher STaR Chart can assist in the
measurement of the impact of state and local
efforts to improve student learning through the use
of technology as specified in No Child Left Behind,
Title II, Part D. It also can identify needs for on-going
professional development and raise awareness of
research-based instructional goals.
SBEC Technology Application
Standards
 Standard I. All teachers use technology-related terms, concepts, data input strategies
and ethical practices to make informed decisions about current technologies and their
applications.
 Standard II. All teachers identify task requirements, apply search strategies and use
current technology to efficiently acquire, analyze, and evaluate a variety of electronic
information.
 Standard III. All teachers use task-appropriate tools to synthesize knowledge, create and
modify solutions and evaluate results in a way that supports the work of individuals and
groups in problem-solving situations.
 Standard IV. All teachers communicate information in different formats and for diverse
audiences.
 Standard V. All teachers know how to plan, organize, deliver and evaluate instruction
for all students that incorporates the effective use of current technology for teaching
and integrating the Technology Applications Texas Essential Knowledge and Skills (TEKS)
into the curriculum.
Campus Data embedded staar
chart
Summary
Instructions for Completing a Texas Teacher STaR Chart Profi le
The printed Texas Teacher STaR Chart may be used for discussion and collection of data. In addition, there is an online
Texas
Teacher STaR Chart that provides campus, district, and teacher summary reports. Use the instructions below and
those online at
www.tea.state.tx.us/starchart to develop Teacher STaR Chart profi les.
1. The Texas Teacher STaR Chart should be completed by each teacher on the campus.
2. The Texas Teacher STaR Chart survey results are designed to provide supporting data for the Texas Campus STaR
Chart. The STaR Chart contained in this document should be used to collect and record teacher data for each indicator.
3. The Long-Range Plan for Technology identifi es four Key Areas: Teaching and Learning; Educator Preparation and
Development; Leadership, Administration and Instructional Support; and Infrastructure for Technology. Indicators in
the Teaching and Learning and Educator Preparation and Development areas should describe the teacher’s self-
assessed
level of profi ciency. Responses in the Leadership, Administration and Instructional Support and Infrastructure for
Technology areas should refl ect the teacher’s perception of the instructional environment.
4. Each Key Area is divided into Teacher STaR Chart Focus Areas. Within each Focus Area, indicators are provided for
assessing the teacher’s Level of Progress. It is possible that the teacher may have indicators in more than one Level of
Progress. Each teacher should select the one Level of Progress that best describes the teacher’s technology profi
ciency.
5. Sample performance descriptions are provided for the Teaching and Learning and Educator Preparation and
Development key areas. Performance descriptions are not provided for the Leadership, Administration and
Instructional
Support, and Infrastructure for Technology key areas, as the responses to these sections should refl ect the teacher’s
perception of the instructional environment.
Staar Chart:
Website Information
For more information
regarding your campus data
visit the website:
http://starchart.epsilen.com/

Staar chart

  • 1.
    A Guide toUNDERSTANDING STAAR CHART Kelso Elementary “Soaring eagles”
  • 2.
    Agenda………… What is aSTAAR Chart? SBEC Technology Application Standards Four Key Areas and Performance Descriptions Campus Data Embedded STAAR Chart Summary Website Information
  • 3.
    What is STAArChart?  The Texas Teacher STaR Chart has been developed around the four key areas of the Long-Range Plan for Technology, 2006-2020: Teaching and Learning; Educator Preparation and Development; Leadership, Administration and Instructional Support; and Infrastructure for Technology. The Texas Teacher STaR Chart is designed to help teachers, campuses, and districts determine their progress toward meeting the goals of the Long-Range Plan for Technology, as well as meeting the goals of their district. The Texas Teacher STaR Chart can assist in the measurement of the impact of state and local efforts to improve student learning through the use of technology as specified in No Child Left Behind, Title II, Part D. It also can identify needs for on-going professional development and raise awareness of research-based instructional goals.
  • 4.
    SBEC Technology Application Standards Standard I. All teachers use technology-related terms, concepts, data input strategies and ethical practices to make informed decisions about current technologies and their applications.  Standard II. All teachers identify task requirements, apply search strategies and use current technology to efficiently acquire, analyze, and evaluate a variety of electronic information.  Standard III. All teachers use task-appropriate tools to synthesize knowledge, create and modify solutions and evaluate results in a way that supports the work of individuals and groups in problem-solving situations.  Standard IV. All teachers communicate information in different formats and for diverse audiences.  Standard V. All teachers know how to plan, organize, deliver and evaluate instruction for all students that incorporates the effective use of current technology for teaching and integrating the Technology Applications Texas Essential Knowledge and Skills (TEKS) into the curriculum.
  • 6.
  • 7.
    Summary Instructions for Completinga Texas Teacher STaR Chart Profi le The printed Texas Teacher STaR Chart may be used for discussion and collection of data. In addition, there is an online Texas Teacher STaR Chart that provides campus, district, and teacher summary reports. Use the instructions below and those online at www.tea.state.tx.us/starchart to develop Teacher STaR Chart profi les. 1. The Texas Teacher STaR Chart should be completed by each teacher on the campus. 2. The Texas Teacher STaR Chart survey results are designed to provide supporting data for the Texas Campus STaR Chart. The STaR Chart contained in this document should be used to collect and record teacher data for each indicator. 3. The Long-Range Plan for Technology identifi es four Key Areas: Teaching and Learning; Educator Preparation and Development; Leadership, Administration and Instructional Support; and Infrastructure for Technology. Indicators in the Teaching and Learning and Educator Preparation and Development areas should describe the teacher’s self- assessed level of profi ciency. Responses in the Leadership, Administration and Instructional Support and Infrastructure for Technology areas should refl ect the teacher’s perception of the instructional environment. 4. Each Key Area is divided into Teacher STaR Chart Focus Areas. Within each Focus Area, indicators are provided for assessing the teacher’s Level of Progress. It is possible that the teacher may have indicators in more than one Level of Progress. Each teacher should select the one Level of Progress that best describes the teacher’s technology profi ciency. 5. Sample performance descriptions are provided for the Teaching and Learning and Educator Preparation and Development key areas. Performance descriptions are not provided for the Leadership, Administration and Instructional Support, and Infrastructure for Technology key areas, as the responses to these sections should refl ect the teacher’s perception of the instructional environment.
  • 8.
    Staar Chart: Website Information Formore information regarding your campus data visit the website: http://starchart.epsilen.com/

Editor's Notes

  • #2 I think that every presentation regarding finance or investments has to be grounded in some type of metaphor. The right metaphor allows the audience to feel immediately comfortable with the presentation even though they may not have much prior knowledge on the subject matter. To me, sailing has always seemed to provide just the right terms to describe both the planning and patience required of a successful investor. Whether it be “charting the course” of an investment plan or having the patience required to navigate choppy markets, sailing and investing can make for a compelling presentation. Disclaimer: You understand that Microsoft does not endorse or control the content provided in the following presentation. Microsoft provides this content to you for informational purposes only; it is not intended to be relied upon as business or financial advice. Microsoft does not guarantee or otherwise warrant the accuracy or validity of this information and encourages you to consult with a business or financial professional as appropriate.
  • #3 This slide lets the audience know that everyone is at “some stage” of retirement planning.
  • #4 As one of the largest fee-only investment managers in the state of Georgia, our job is to help you chart out your own course to retirement. Here, presenters should place their credibility statement, education, title, and/or years of experience.
  • #5 This slide begins with “written financial plan”, which is a critical step in being able to navigate any path towards retirement. In any financial presentation, it is important to help the audience establish and understand their goals. Understanding this process is to “chart the course” for each individual in the room. Every financial professional should have a different take on this, but typically there will be between two and three planning phases for a given audience/client. If three goals are needed, you can simply add to the graphic. Financial professionals should feel free to customize the language labeled in bullet points for each phase. Note: To add another goal to the SmartArt graphic on this slide, click in the graphic to activate the SmartArt text pane. Click at the end of the last bullet in the pane, press Enter, and the press Shift+Tab to start another first-level bullet. A new section will be added to the graphic automatically and existing elements automatically resized. To add the items under the new goal, press Enter in the text pane to create a new paragraph and then press Tab to demote the new paragraph to the second level.
  • #6 This slide lays out the overall objective of the presentation; which is how to achieve or start working towards a “successful retirement”. It starts with a “written financial plan”, and moves clock-wise – all centered around the main goal. On this continuum, buttons can be added or removed, depending upon the financial professional giving the presentation. A successful retirement plan has many moving parts and each of them must serve a unique function in carrying you to retirement. Regardless of your situation, the journey to retirement is likely dotted with some storms and choppy seas along the way. Here, I have laid out what I believe to be the very basic principles necessary for any successful retirement plan.
  • #7 This slide illustrates more of a timeline or progression for completing major savings during the course of an investor’s lifetime. The slide serves to answer the age-old question, “Where am I now and where do I start?”.
  • #8 This is a visual that should be discussed with the audience. It describes the relationship between risk and reward. Notice that the relationship between the two is very familiar; the higher the risk an investment carries, the higher your potential payoff will be. Likewise, lower risk investments carry little or no reward. This slide is an extremely simple explanation of the risks involved in different investments, but it is important to understand the basics before you move forward.
  • #9 As you’re accumulating, this is a logical order in which to contribute to your commonly-used retirement savings vehicles. Financial professionals should feel free to customize their own hierarchy so that the audience has a clear, visual understanding of how investment “blocks” should build on each other.