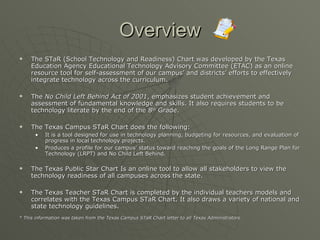
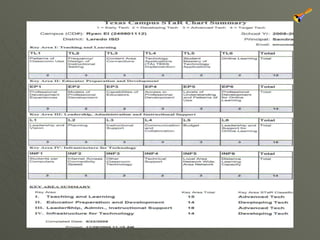
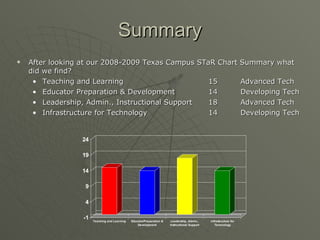
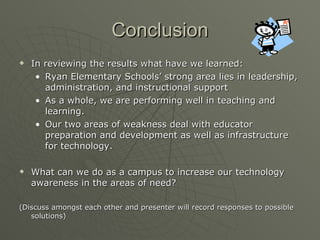
Created by: Jessica Rivera Texas ST  R Chart
Agenda Overview of the School Technology and Readiness Chart Instructions for Completing the Texas Campus  STaR Chart How to rate your campus Ryan Elementary School STaR Chart Summary Group Discussion & Conclusion Goals for the 2010-2011 School Year
Overview The STaR (School Technology and Readiness) Chart was developed by the Texas Education Agency Educational Technology Advisory Committee (ETAC) as an online resource tool for self-assessment of our campus’ and districts’ efforts to effectively integrate technology across the curriculum. The  No Child Left Behind Act of 2001 , emphasizes student achievement and assessment of fundamental knowledge and skills. It also requires students to be technology literate by the end of the 8 th  Grade. The Texas Campus STaR Chart does the following: It is a tool designed for use in technology planning, budgeting for resources, and evaluation of progress in local technology projects.  Produces a profile for our campus’ status toward reaching the goals of the Long Range Plan for Technology (LRPT) and No Child Left Behind. The Texas Public Star Chart Is an online tool to allow all stakeholders to view the technology readiness of all campuses across the state. The Texas Teacher STaR Chart is completed by the individual teachers models and correlates with the Texas Campus STaR Chart. It also draws a variety of national and state technology guidelines. * This information was taken from the Texas Campus STaR Chart letter to all Texas Administrators.
Instructions for Completing the  Texas Campus STaR Chart Profile By clicking on the action button below, we will be able to gain access to the Texas STaR Campus Chart. This will enable us to view step-by-step instructions on how to complete the Texas Campus STaR Chart Profile.  You can also gain access to view the Texas STaR Chart by going to http://starchart.esc12.net/
Rating Your Campus We will first view the STaR Chart by clicking on the icon below.  We will then rate our campus using the information below: Read each section of the four areas of the STaR Chart. Select the cell in each category that best describes your campus. Enter the corresponding number (1=Early Tech 2=Developing Tech  3=Advanced Tech  4=Target Tech) in the chart Add up all numbers across and get the total Based on the total number, use the scale below to rate each area: 6-8 pts.  Early Tech 9-14 pts.  Developing Tech 15-20 pts.  Advanced Tech 21-24 pts.  Target Tech
Ryan Elementary STaR Chart Let’s see how our results compare to how the campus did!!
 
Summary After looking at our 2008-2009 Texas Campus STaR Chart Summary what did we find? Teaching and Learning 15 Advanced Tech Educator Preparation & Development 14 Developing Tech Leadership, Admin., Instructional Support 18 Advanced Tech Infrastructure for Technology 14 Developing Tech
Conclusion In reviewing the results what have we learned: Ryan Elementary Schools’ strong area lies in leadership, administration, and instructional support As a whole, we are performing well in teaching and learning. Our two areas of weakness deal with educator preparation and development as well as infrastructure for technology. What can we do as a campus to increase our technology awareness in the areas of need? (Discuss amongst each other and presenter will record responses to possible solutions)
Technology Goals for the Upcoming School Year Provide more staff development sessions for teachers in the area of technology, both online and face-to-face. Teachers need to be able to demonstrate more of the SBEC Technology Application Standards. Provide our campus with internet access in more than 50% of the classrooms. Increase our number of technical staff on campus. Provide access to online learning for both students and teachers.
I  would like to thank Ryan Elementary School Principal, Mrs. Sandra Munoz for allowing me to present this information to you.  Mrs. Sandra Munoz

Texas Star Chart

  • 1.
    Created by: JessicaRivera Texas ST  R Chart
  • 2.
    Agenda Overview ofthe School Technology and Readiness Chart Instructions for Completing the Texas Campus STaR Chart How to rate your campus Ryan Elementary School STaR Chart Summary Group Discussion & Conclusion Goals for the 2010-2011 School Year
  • 3.
    Overview The STaR(School Technology and Readiness) Chart was developed by the Texas Education Agency Educational Technology Advisory Committee (ETAC) as an online resource tool for self-assessment of our campus’ and districts’ efforts to effectively integrate technology across the curriculum. The No Child Left Behind Act of 2001 , emphasizes student achievement and assessment of fundamental knowledge and skills. It also requires students to be technology literate by the end of the 8 th Grade. The Texas Campus STaR Chart does the following: It is a tool designed for use in technology planning, budgeting for resources, and evaluation of progress in local technology projects. Produces a profile for our campus’ status toward reaching the goals of the Long Range Plan for Technology (LRPT) and No Child Left Behind. The Texas Public Star Chart Is an online tool to allow all stakeholders to view the technology readiness of all campuses across the state. The Texas Teacher STaR Chart is completed by the individual teachers models and correlates with the Texas Campus STaR Chart. It also draws a variety of national and state technology guidelines. * This information was taken from the Texas Campus STaR Chart letter to all Texas Administrators.
  • 4.
    Instructions for Completingthe Texas Campus STaR Chart Profile By clicking on the action button below, we will be able to gain access to the Texas STaR Campus Chart. This will enable us to view step-by-step instructions on how to complete the Texas Campus STaR Chart Profile. You can also gain access to view the Texas STaR Chart by going to http://starchart.esc12.net/
  • 5.
    Rating Your CampusWe will first view the STaR Chart by clicking on the icon below. We will then rate our campus using the information below: Read each section of the four areas of the STaR Chart. Select the cell in each category that best describes your campus. Enter the corresponding number (1=Early Tech 2=Developing Tech 3=Advanced Tech 4=Target Tech) in the chart Add up all numbers across and get the total Based on the total number, use the scale below to rate each area: 6-8 pts. Early Tech 9-14 pts. Developing Tech 15-20 pts. Advanced Tech 21-24 pts. Target Tech
  • 6.
    Ryan Elementary STaRChart Let’s see how our results compare to how the campus did!!
  • 7.
  • 8.
    Summary After lookingat our 2008-2009 Texas Campus STaR Chart Summary what did we find? Teaching and Learning 15 Advanced Tech Educator Preparation & Development 14 Developing Tech Leadership, Admin., Instructional Support 18 Advanced Tech Infrastructure for Technology 14 Developing Tech
  • 9.
    Conclusion In reviewingthe results what have we learned: Ryan Elementary Schools’ strong area lies in leadership, administration, and instructional support As a whole, we are performing well in teaching and learning. Our two areas of weakness deal with educator preparation and development as well as infrastructure for technology. What can we do as a campus to increase our technology awareness in the areas of need? (Discuss amongst each other and presenter will record responses to possible solutions)
  • 10.
    Technology Goals forthe Upcoming School Year Provide more staff development sessions for teachers in the area of technology, both online and face-to-face. Teachers need to be able to demonstrate more of the SBEC Technology Application Standards. Provide our campus with internet access in more than 50% of the classrooms. Increase our number of technical staff on campus. Provide access to online learning for both students and teachers.
  • 11.
    I wouldlike to thank Ryan Elementary School Principal, Mrs. Sandra Munoz for allowing me to present this information to you. Mrs. Sandra Munoz